WALL ORIENTATION EFFECT ON THE DETACHMENT
OF A VAPOR BUBBLE
Touhami Baki
a,*Djamel Sahel
a, Ahmed Guessab
ba Faculté de Mécanique, Laboratoire de Carburants Gazeux et Environnement, USTO.MB, ALGERIA, BP 1505, El-M’Naouer, Oran 31000, Algeria b ENP Oran, Industrial Products and Systems Innovations Laboratory (IPSIL), Oran 31000, Algeria
A
BSTRACTBoiling is influenced by a large number of parameters; the angle of orientation constitutes one of these parameters which have a positive impact on the heat transfer. The dynamic of the bubble plays a significant role in the improvement of heat transfer during boiling. For this reason, we are located on the bubble scale and we simulated the detachment of vapor bubble in the liquid water on a heated surface, when the angle of orientation varies from 0 to 180°. We followed the evolution of the sliding of the bubble; it appears that the thermal boundary layer is disturbed and that the heat transfer coefficient reached major proportions and the sliding velocity of the bubble depends on the orientation of the wall.
Keywords: Boiling, sliding, heat transfer coefficient, simulation.
* Corresponding author. Email: [email protected]
1.
INTRODUCTION
Boiling is a very effective mode of heat transfer, it allow to extract an enormous quantity of heat for low variations of temperature, and finds a broad application in chemical industry, petrochemical, food, and refrigeration.
Nucleate pool boiling remains an extremely complex and imperceptible phenomenon, and depends on several parameters like underlined it Dhir (1998). Among these parameters, the effect of the inclination of the wall, studied by Kaneyasu et al (1988) for water at the atmospheric pressure; the orientation was varied from 0° to 175° compared to the horizontal one. A direct relationship was established between the angle of inclination and the heat transfer coefficient; this last increase when the angle increases, this is valid for the weak heat flows. On the other hand, for important heat flows, no relation is established with the angle of orientation. The comprehension of the phenomenon of boiling passes by the investigation at the microscopic level, to knowing dynamics of the bubble and its environment.
Mukherjee and Dhir (2003) made the simulation of the growth and the detachment of a vapor bubble, as well as the coalescence of two and three vapor bubbles. Manickam and Dhir (2012) studied experimentally the sliding of a bubble by interferometry on the low side of a heated surface. They noted that the sliding of the bubble improves the heat transfer. Van der Geld et al (2014) presented measurements of the growth of vapor bubble and its detachment for some orientation, and compared with 2D numerical simulations. An analysis of the forces acting on the bubble during its sliding was examined.
In this study, we simulated the dynamic of a bubble, during the sliding and the detachment from a hot wall, when the inclination varies; we have so compare, the velocities, the distance of sliding and the heat transfer when the angle go from 0 to 180 degrees.
2.
PROPOSED NUMERICAL MODEL
2.1
Method
The dynamics of the bubble included the growth and the detachment. For the simulation of the detachment of the bubble, we supposed that it had reached a necessary volume to start its process. The equivalent starting diameter was given by using the correlation of Fritz (1935) detailed in the equation (1).
0.02008
( l v) d
g
(1)
The studied process is the detachment of the hot surface of a steam bubble; the liquid is at the saturation temperature. The simulation is focused in two dimensions, the flows are laminar, the temperature of the wall remains constant and the thermodynamic properties of each of the two phases are insensitive to small variations of temperature and pressure.
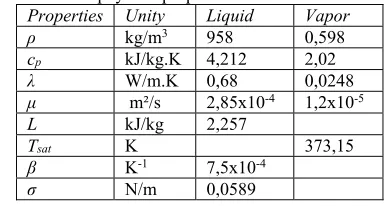
During the process, the mass transfer from the liquid phase to the vapor phase is not included; the thermal and physical properties are presented in table 1. All the properties are evaluated in the case of water at atmospheric pressure and the temperature at 100°C, as shown in table 1.
Table 1 Thermal and physical properties of water.
Properties Unity Liquid Vapor
ρ kg/m3 958 0,598
cp kJ/kg.K 4,212 2,02
λ W/m.K 0,68 0,0248
μ m²/s 2,85x10⁻⁴ 1,2x10⁻⁵
L kJ/kg 2,257
Tsat K 373,15
β K-1 7,5x10⁻⁴
σ N/m 0,0589
Frontiers in Heat and Mass Transfer
2.2
Initial Conditions
At the time of the detachment; the bubble is regarded as a half-sphere of diameter 3.50 mm. The equivalent diameter d given by the formula of Fritz (1) for a contact angle of 54° is d=2.72 ݉݉. The properties of the liquid phase and vapor are taken for water with 100 °C; the temperature of the vapor is considered equal to the temperature of saturation, The temperature of the wall is equal to 110 °C, either an overheating of wall Δܶ=10°C and the pressure is taken equal to the atmospheric pressure.
The temperature of the bubble is the temperature of saturation but the temperature of the liquid is overheated compared to the bubble by taking account of the overpressure of the bubble.
2.3
Governing equations
The VOF (Volume Of Fluid) model is used when two or more phases are present in a control volume, and are not miscible, the volume fraction variable for each fluid in the calculation cell is then introduced; if the volume fraction of the qth fluid in the cell is denoted by "q,” When
q0the cell is empty of the fluid q, and when
q1the cell is full of the fluid q, on the other hand if 0
q 1there is the presence of two fluids and the cell contains the interface.The properties of the mixture are determined by the presence of the p and q fluid phases in the control volume and are assumed to remain constant in each phase, the density of each cell is calculated by the formulation p p
1 p
q, the same for the viscosity and the others properties.The tracking of the interface is modeled by the continuity equation (3) for the fraction of volume of a phase for the qth fluid; it is presented in the following form:
. q q q q s v t
(3)
Where s is the source term, by default it is equal to zero. The volume fraction of the second phase will be deduced, given that the sum of the volume fractions for a cell is equal to unity
p
q 1. With this approach, the continuity equation is solved for each phase, with a single-phase formulation.Flows are considered to be laminar, the momentum equation is solved throughout the domain regardless of the phase or phase mixture, and the velocity field obtained is weighted according to the volume fractions; viscous stress tensor and the equation of the conservation of momentum (4) are reduced to the following formulations after the introduction of the assumptions that the fluids are incompressible and Newtonian:
T
S
v v
v . vv p .S g Ft
(4)
And the energy equation is given by the formulation (5) and defines as:
E .
v
E p
.
eff T
Sht
(5)
2.4
Boundary conditions
The control domain selected has dimensions 20 mm x 10 mm, the low part is hot surface (wall), the right-sided is the entry (velocity inlet), the left side is the exit (pressure outlet) and the upper part is symmetry (symmetry). Calculations will be made in Cartesian coordinates; the bubble made with 476 cells, will be placed on the wall with the coordinates (15,0). The geometry and the grid were generated by using the software Gambit 2.4.6; on the level of surface heating we have y=0, u=0, v=0, T=Tw; above the field, at y=ymax, u=0, v=0, T=Tl; on the two sides, at x=0 and x=xmax, u=0, v=0, T=Tl ; all flow velocities are zero , it is considered that the bubble is in pool boiling.
2.5
Parameters of simulation used
After introduction of the initial conditions and the specifications of the boundary conditions, the control of the solution as well as initialization must be specified before the starting of calculation.
The control of the solution consists of to adopt the precision of the coupling schema of pressure and velocity, the schema of discretization of the various variables and the under-relaxation factors. In this case, algorithm PISO for the pressure coupling and velocity and the schema of rebuilding of the interface geo-reconstruct were used. This last diagram is most precise; it makes a linear interpolation by using the volume fractions of the meshes close to the interface.
First order diagrams were specified for the discretization of the Momentum parameters and Energy and body Weighted force for pressure. Default under-relaxation factors were used, where the step of time of 10-4 seconds is selected.
By introducing the initial conditions on the numerical domain using the Fluent software 6.3.26; we obtain the contours of fraction, at the initial state, as it is indicated on figure 1.
Figure 2 shows a little effect of mesh; the grid chosen for simulation is 200×100 for mesh 2, the bubble moves, and the complete detachment from the hot wall takes place after 17 ms. we used two other grids 182×91, mesh 1 and 222×111, mesh 3. The detachment for the grid 1 was carried out after 18 ms and for the third at 19 ms; in this test the angle of inclination is null; the grid 200×100 is retained, for the following simulations
Fig. 1 Contour of the bubble in an initial state
Fig. 2 Mesh influence
Figure 3 shows the movement of the bubble when the wall is horizontal, so at an angle θ = 0°; the contours schematized are the steps that follows a bubble at the detachment, they indicate the initial position, after 3ms, then half of the course and finally the phase of detachment.
The same conditions were renewed for simulation by changing the direction of acceleration compared to the hot wall, thus we examines the angle of inclination of the wall and its effect on the detachment of the bubble.
Fig. 3 Contour of bubble at θ = 0°
a) inclination angle θ = 30°
b) inclination angle θ = 90°
c) inclination angle θ = 150°
Fig. 4 Contour of bubble for different orientation
3.
RESULTS AND DISCUSSIONS
After simulation of the detachment of the bubble of a horizontal wall, we varied the orientation angle of the wall from 0° to 180°.
3.1
Detachment and sliding
Figure 4 a to c, shows the detachment and sliding of a bubble for different orientation of the hot wall; from 30 ° to 90 degree, more the angle increases, more the bubble slides over a much large length and detachment is delayed; at 30 ° the bubble slides 0.3 mm and lift off after a period of 20 ms, at 60 ° the bubble slides over a distance of 4.8 mm and detachment occurs after 63 ms; At 90 ° detachment occurs after 83 ms, the bubble will have traveled a distance of 8.3 mm; when the angle of orientation is greater than 90 ° the bubble is found below the wall it slides and remains stuck to the wall; for the duration of 83 ms, the bubble has moved a distance of 7.5 mm for an angle of 120 ° and 5.6 mm for 150 °; when the wall do rotation of 180 ° the bubble remains below, adhered to the wall without moving.
The bubble is shown in the figures in the initial state after 3 ms, during the half time and before the detachment; first the base area shrinks to the same location then the bubble begins to slide until detachment.
3.2
Effect of contact angle
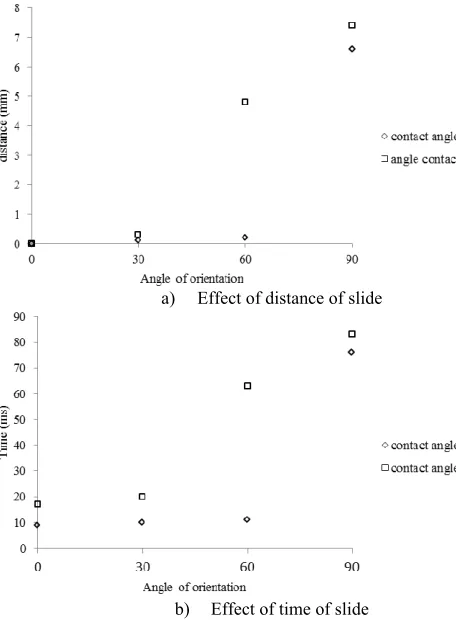
Figure 5 shows the relation between the angle of orientation and the two parameters which are the distance of sliding of the bubble along the wall and the time of this same slide. We have choose a bubble of reference with 54° of contact angle and compare it with another bubble with 44 ° contact angle, It is noted that when the angle θ is between 0 and 30°, the increase in the distance is tiny just as for the time of slide which varies only slightly. From 30° to 60°, the increase is very important whether for the distance of slide or the time of slide. After 60° and until 90°, the increase in the distance and the time from slide remain important but less than for the band of 30 to 60°, for the two bubbles, but the bubble with 54° contact angle slide more than other mostly when the angle of orientation is equal to 60°.
a) Effect of distance of slide
b) Effect of time of slide
3.3
Sliding velocity
The evolution of the sliding velocity of the center of the bubble according to time is indicated in Figure 6; for an orientation of the angle
of 30, 60 and 90°. For 30°, velocity increases during a time 0 to 5 ms to exceed the value of 1,5 cm/s, then it remains constant from 5 to 14 ms and finally it increases again until the detachment of the bubble where it will have reached a value of 1,89 cm/s. For the angle of 60°, the velocity of displacement increases gradually up to 43 ms to reach the velocity of 11.93 cm/s, then it decreases and remains constant until the detachment of the bubble has a velocity of 9.91 cm/s. When the angle of orientation is equal to 90°, the sliding velocity of the bubble increases with a slope more important than the two previous up to 39 ms where it will have reached a peak of 13.07 cm/s, then it decreases and is stabilized along a stage until the detachment where it leaves the wall with a velocity of 11.41 cm/s; for the three cases, we have a disturbance around 6ms then velocity decrease and increase again.
Fig. 6 Velocity vs time for inclined plate from 30 to 90°
Fig. 7 Velocity vs time for inclined plate 120 to 150°
In all the cases, the profile of the sliding velocity has the pace of a bubble rising in a liquid, the velocity progresses then tends towards a velocity limits of 21 cm/s, the latter is determined by the equation (7) given by Davies and Taylor (1950), it corresponds to a rise of a bubble without sliding on the wall and is higher than all velocities at the time of the detachment of the bubble.
0 0, 707
u gD (7)
The final velocity depends on the angle of orientation, and the time of change τ of the velocity is relatively the same one for the various angles of orientation and corresponds to 30ms, when the bubble is downward, and 40 ms when the bubble is upward.
Fig. 8 Final velocity from = 0 with 90°
Figure 8 shows final velocity at the moment of the detachment of the bubble for varying from 30 to 90°, between 0 and 30 the velocities grows slightly, then at 30 ° it grows quickly, after 60° it grows again slightly until 90°; these values where compared to the experimental data from Maity (2000), and gives good agreement for equal to 0, 30 and 60, for 90 there is a slight lag.
Fig. 9 Froude number according the inclined plate
Figure 9 show us the Froude number of equation (8) plotted to angle (180 - ), and compared with Maxworthy (1991) experiment; the result agrees well the present work when the bubble is downward the plate for two angles 120 and 150, and indicates when the angle increases the Froude number decreases.
1/3
1/2sin V Fr
gB
(8)
The differences between the experimental data and those of the simulation in Figures 8 and 9 are due to the simplifying hypotheses of the simulation and that the bubble is processed in 2D and not in 3D.
3.4
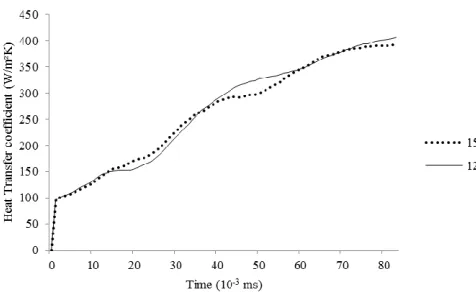
Heat transfer coefficient
The evolution of the heat transfer coefficient along the wall according to the time is determined by the equation (9), the surface A has been selected far from the influences of entry and exit of the domain.
1
A
h hdA
A
(9)
Fig. 10 Heat transfer coefficient according to time, for = 30 to 90°
In the same way, when the bubble is in lower part of the wall and the angle of orientation varies from 120 with 150° the coefficient of transfer of heat practically evolves in the same way as shows in the Figure 11, but remains higher if the bubble is above the wall.
Fig. 11 Heat transfer coefficient according to time, for = 120 to 150°
3.5
Temperature
The thermal boundary layer between the hot wall and the bulk plays an important role in the heat transfer execution. After an established mode, and in the absence of bubble, this thermal boundary layer has a certain thickness. Moreover when the bubble slides along the wall, it disturbs this layer and the heat transfer will be improved. The ten isotherms which formed parallel lines with the wall will be deformed by the foot of the bubble which slides and remains stuck to the wall. More the distance or time of sliding is important and more the deformation of the isotherms is important, and the transfer is improved as shows it the Figures 12a to 12c.
The first figure 12a corresponds to an orientation of the wall of 30°, the disturbance is tiny and the isotherms follow the pattern of the bubble at the time of the detachment. The figure 12b corresponds to the orientation of 90°, the isotherms are influenced by the slide and the detachment of the bubble; When the bubble is in lower part of the wall, there is no detachment but the bubble at the time of its slide disturbs even more the thermal boundary layer and we obtains isotherms indicated on the figures 12c, for angle of orientation equal to 150°.
3.6
The hydrodynamic parameters
When moving a bubble, parameters such as velocity and pressure will be modified, we followed and compared these two parameters around the bubble at the beginning of the displacement at 3 ms and on detachment, in the case of an orientation with θ =90°, since at this angle the bubble travels a long distance and its velocity is the highest.
a) = 30°
b) = 90°
c) = 150°
Fig. 12 Isotherms for varies from 30 to 150°
Fig. 13 Pressure on and in bubble
a) X velocity
b) Y velocity
Fig. 14 Velocity profile
Figure 14 a and b shows the velocities along the x-axis parallel to the wall and y perpendicular to it, during the displacement of the bubble the liquid will be antrained, for which we have plotted the velocity profile along the y-axis, at the top of the bubble. The velocities at the start at 3ms vary slightly along the x-axis, the bubble begins to antrain the liquid upwards, and a part goes down, along the y-axis, we have disturbance in both directions; at the detachment the liquid is pushed strongly upwards, the rest is antrained downwards indicating a large recirculation, the velocities along the y axis show clearly the recirculation of the liquid, and other part is pushed towards the wall.
4.
CONCLUSIONS
A numerical analyze has been carried out to simulate the phenomenon of detachment of a vapor bubble on an inclined wall, for different angles from 0° to 180°. The conclusions are summarized as follows:
The bubble slides then is detached, the distance and the time of slide increase when the angle of orientation of the wall increases from 0 to 90°.
The sliding velocity increase then reached a final velocity, which depends on the angle of inclination.
The heat transfer coefficient evolves according to the angle of orientation, and increases quickly between 30 and 60°
The contour of the isotherms is strongly disturbed, particularly when the bubble is in lower part of the wall.
All the studied parameters, namely time of slide, the distance of sliding, the sliding velocity of the bubble before detachment and the heat transfer coefficient increase slightly when the angle of orientation varies from 0 to 30°, then they vary vigorously between 30 and 60° and finally they strongly increase between 60 and 90°, but less than between 30 and 60°.
ACKNOWLEDGEMENTS
The authors thank Professor C.W.M. van der Geld for all discussions and technical assistance.
NOMENCLATURE
A Area (m²)
a Thermal diffusivity (m²/s)
B Bubble volume (m3)
cp Heat capacity (J/kg.K)
D Domain
d Bubble departure diameter (m)
E Energy (J) F Force (N)
Fr Froude number
g Acceleration due to gravity (m/s²) h Heat transfer coefficient (W/m².K)
L Latent heat of vaporization (J/kg)
m Mass transferred (kg) p Pressure (Pa)
q Surface heat flow (W/m²)
s Source term S Viscous stress tensor
T Temperature (K)
T Time (s) u Velocity (m/s)
v Velocity (m/s)
x Direction (m)
y Direction (m)
Greek Symbols
α Volume fraction
β Thermal expansion (K-1)
Difference
δ Thermal boundary layer (m) Contact angle
λ Thermal conductivity (W/m.K)
μ Dynamic viscosity (kg/m.s)
ν Kinematic viscosity (m²/s) Angle of orientation of the wall
ρ Density (Kg/m3) σ Surface tension (N/m)
Subscripts eff Effective
h Heat
l Liquid
max Maximum
o Reference
p p phase
q q phase
sat Saturation
t Thermal
v Vapor
w Wall
REFERENCES
Davies R.M., Taylor G., 1950, “The Mechanics of Large Bubbles Rising through Extended Liquids and through Liquids in Tubes,” Proc. R. Soc. Lond. A. Math. Phys. Sci. 200 375–390.
https://www.doi.org/10.1098/rspa.1950.0023
DhirV.K., 1998, “Boiling Heat Transfer, Annu”. Rev. Fluid Mech. 30 365–401.
https://www.doi.org/10.1146/annurev.fluid.30.1.365
Fritz W., 1935,” Maximum volume of vapor bubbles,” Physic Zeitschr.
36 379–384.
Kaneyasu N., Yasunobu F., Satoru U., Haruhiko O., 1984, “Effect of surface configuration on nucleate boiling heat transfer,” Int. J. Heat Mass Transf.27, 1559–1571.
https://www.doi.org/10.1016/0017-9310(84)90268-0
Manickam S., Dhir V., 2012, “Holographic interferometric study of heat transfer to a sliding vapor bubble,” Int. J. Heat Mass Transf.55 925–940.
https://www.doi.org/10.1016/j.ijheatmasstransfer.2011.10.016
Mukherjee A., Dhir V.K., 2003, “Numerical Study of Lateral Merger of Vapor Bubbles during Nucleate Pool Boiling”. ASME. Heat Transfer Summer Conference, Heat Transfer: Volume2 373-381.
https://www.doi.org/10.1115/HT2003-47203
Van der Geld C.W.M., Baltis C.H.M., Priems G.J.M., Baki T., 2014, “some problems in nucleate flow boiling,” in: MATEC Web of Conferences (Ed.), MATEC Web Conf., EDP Sciences.
https://www.doi.org/10.1051/matecconf/20141801003
Maity S., 2000, “Effect of velocity and gravity on bubble dynamics,”
M.S. Thesis Univ. Calif.
http://boiling.seas.ucla.edu/Publications/S_Maity.pdf
Maxworthy T., 1991, “Bubble rise under an inclined plate,” J. Fluid Mech.229 659–674.