Operations Support Systems, Implication of
Software Error- Log messages on GSM/GPRS
Network Performance
(A case study of Airtel Nig. Networks)
*1
Otori, A. Uye;
2Adetiba, O. Ekundayo;
3Ali, John;
4John, H. Mormi
1,2,3 Aeronautical Telecommunications Engineering School, Nigerian College of Aviation Technology, Zaria, Nigeria
4
Department of Electrical Engineering, University of Abuja, Nigeria.
ABSTRACT--GSM/GPRS Network faults dynamic feature can be utilized in the field of Trend/statistical analysis of the error-log message summary for both the Base Station Subsystems and Mobile Switching Centers by comparing the relationship between the twin parameters of Frequency of Occurrence and the Mean Time to Repair (MTTR) each fault type. The Fault Trend Analysis shows that as the number of times a particular fault type occur increases the Mean Time to Repair such faults decreases, with some deviation from this trend in some cases when we classified them as high priority faults with serious impact on network performance and those that have little or no impact on network performance. Filtering and Correlation are two methods we used to simplify the separation of the principal alarms and redundant alarms from their side effect on network performance. A method called Tupling is used to filter and correlate the large volume of error-log message covering a period of three months from Airtel’s network with the resulting summary analysed. The result could be used to reduce total downtime and improve quality of Service (QOS) as per Service Level Agreement.
Keywords: Fault Management, Mean Time to Repair,
Tupling, Fault Trend Analysis and Alarms.
I. INTRODUCTION
The Second Generation Global System for Mobile communications (2G GSM) was designed primarily to provide circuit switched speech and data value added services were simply based on the Short Message Services (SMS). Today, most GSM network Operators are experienced in a voice oriented Time Division Multiplexed (TDM) technologies and have gone further to introduce a more complex Third Generation (3G) networks which is based on the Code Division Multiplexed (CDM) technologies with its other flavors, e. g. Wideband Code Division Multiple Access (WCDMA), Asynchronous Transport Module (ATM) in the transport layer for the Universal Mobile Telecommunications Systems (UMTS), [7].
Following development of the internet, the General Packet Radio Services (GPRS) was introduced to handle packet data services in GSM network. An additional Internet Protocol (IP) network infrastructure was introduced along with new services platforms, e.g. the Multimedia Messaging Services (MMS). Information Technology components such as Network Management System (NMS) and Operations Support Systems (OSS) needs to be enhanced to be able to properly monitor and manage GSM network elements end-to-end [8]. Hence, network monitoring tools are sufficiently implemented in network operation and maintenance. The OSS is the functional entity from where network operators monitor and control the entire Mobile systems.
This Work focuses on FCAPS model which is overlapping with the most popular traditional models deployed by any service provider called Operations, Maintenance and Provisioning (OAM&P).
This research work will investigate the Airtel‟s network performance in this regard and explore the different techniques of services provisioning and holistic approach to integrated network management systems for a better and more robust network operation.
II. PROBLEM DEFINITION
Software faults are an integral part of the world of wireless (GSM) technology due to so many reasons: Software patches and code errors i.e. wrong parameterization of software, Interference, program execution errors and Mean Time to Failure (MTTF) including but not restricted to Mean Time to Repair (MTTR). Given the complexity and size of network Software alarms, filtering and correlating the large volumes of data (Error-logs messages) and choosing the correct tool/technique from the large set of tools available to carry out the Fault trend analysis requires great effort. The alarm represents the symptoms and as such there are two real world concerns: The sheer volume of alarm events as network software errors are logged and using some statistical tool to perform the Fault Trend Analysis. Filtering and Correlation of error-log messages for classifying the causes/effects of fault types helps to resolve the first concern, attempt will be made at resolving the second real world concern by studying the behavior of network error-log message summary by comparing the twin parameters of frequency of occurrence of each fault types and their corresponding time to repair individual fault types.
III. THEORETICAL BACKGROUND
A. International Telecommunications Union FCAPS & OSS Framework
The Telecommunications Management Network (TMN) model was introduced by ITU as a reference model for the Operations Support Systems (OSS) of telecommunication service providers. The TMN concept is an architectural framework for the interconnection of different types of OSS components within the Network Elements (NE). TMN also describes the standardized interfaces and protocol used for the exchange of information between OSS components and NE, and the total functionality needed for network management [8]. The TMN model comprises of the following four layers:
Business Management Layer: Performs functions related to business aspects, analyze trends and quality issues; for example, to provide a basis for billing and other financial reports.
Service Management Layer: Performs functions for the handling of services in the network definitions; administration and charging of service.
Network Management Layer: Performs functions for distribution of network
resources; configuration, control and supervision of the network.
Element Management Layer: Contains function for the handling of individual network elements. This includes: alarm management; handling of information backup; logging and maintenance of hardware.
At each layer in the TMN model, five functional areas called: Fault; Configuration; Accounting or Authentication; Performance and Security Management (FCAPS) are defined.
Each TMN layer needs to perform some or all FCAPs functions in certain ways as illustrated in Fig2.1
Fig.2.1 Mapping between TMN reference model and the FCAPS.(Source: ITU Recommendation M. 3000 at www.itu.org)
B. Fault Management
Faults are an integral part of the world of wireless GSM technology due to so many reasons: e.g. frequent disconnection in the air interface, narrow bandwidth, lack of resources and high mobility [3]. Hence the necessity of providing better fault tolerant mechanism for ensuring reliable working of a GSM network cannot be overemphasized.
Fault management is perhaps the most widely implemented of the ISO Network Management Elements [6].
Also, fault management system helps to detect faulty software and fix them automatically or until technical personnel clears such software faults as alarms.
C. Software Management
Nowadays, GSM world is a new software paradigm that is of prime interest in the IT research community. As a prerequisite for ensuring a better network operation, the Operations Support Systems which comprises of the Network – wide management systems and the operations, and maintenance system is made possible with the various software platform implemented across all Network Elements from Base Station to the Mobile Switching Center (MSC). The complex environment in a GSM/UMTS networks has made it imperative to ensure a more resilient network, architecture and the use of object oriented software for specific tasks e.g. (C++ and Linux UNIX implemented in the NMS (OSS) with little or no errors in the original algorithm. To help mobile services providers meet these new challenges with a better Quality of Service (QOS) and to facilitate the smooth integration of multivendor equipments, NMS should provide mediation amongst all NEs including Network Management Center‟s (NMC‟s) stable standard interfaces, service provisioning activities must be automated through ensuring that the software errors are kept minimal. It is not possible to have an error – free network operation though.
IV. METHODOLOGY AND DATA COLLECTION
Traditionally, Log files were not only intended to be read by humans in order to support fault diagnosis but also to be used for root- cause analysis after a system has failed. The raw data so obtained are not suited to trend analysis for proper fault diagnosis, hence, the need to first filter the raw data before correlating the parameters for modeling. After Filtering and Correlation of the error- log message to obtain the summary of alarms for both the Base Station Controllers (BSC) and Mobile Switching Centers (MSC) using some advance filtering and sorting; the compressed alarm is now used for the Fault trend Analysis.
A. Methodology
Network Elements (NE) Software alarms and error logs i.e. overall network error- log message from NEs like, BSC and MSC of Airtel Network was collected for a period of Three (3) Months.
A method called „Tupling‟ will be used to filter the raw and voluminous error log messages at both the BSC and MSC. The Filtering and Correlation will be realized by using some Excel Formulae
Fault Trend Analysis of Alarm Summaries will be used to classify (correlate) Network faults using criteria like: Priority, nature and hierarchy of faults that are gathered.
Statistical tools (Area Chart) will be used for the Fault Trend Analysis of the derived summary of alarms and their impact on network performance.
B. DATA COLLECTION AND PRESENTATION
The data used in this work was obtained from AirTel Networks Network Management Center, Lagos. Error log files of network elements like: MSC and BSS (BSC) consisting of error log-Messages was collected for a period of three (3) Months (January, 2010 to March, 2010). The Dataset consists of error-log messages with a total of 10,000 logs of fault each from the MSCs and the BSCs. In analyzing the huge data set obtained; such failures that are related to power and those that occur due to climatic changes were truncated (filtered) as redundant alarms to be stored in another log file, because we are only interested in software alarms that have direct impact on network performance.
Error-log messages often contain events that are related to a specific fault due to parallelism in the system; these events are interleaved with unrelated events. These can be seen as noise in the dataset which needs to be filtered before correlation of the faults.
alarm compression and generalization [5]. Applying this algorithm to the error logs resulted in an immense reduction of the number of alarm reports. Meanwhile, the following expressions were used in turn to filter and correlate the raw data in MS Excel as advanced sorting and filtering techniques:
=COUNTIF (range, “error log name‟‟) (3.1) This was used to count the total number of occurrences of each fault types over the total sample size of 10, 000 separate error log-messages. And; Which is used for time converting the average duration over the total number of occurrences of each error log-messages; the compressed (correlated) Alarm summaries for the MSCs and the BSCs are presented in appendix 2 (A and B). Nevertheless, as is always the case for many grouping algorithm; it may assign the same ID to two errors that are not caused by a single symptom and error messages might be combined that refer to several unrelated faults commonly referred to as collision. In this work, different error IDs were assigned to the active alarms from the correlated log files.
V. RESULTS AND ANAYSIS
A. Fault Trend Analysis of Base Station Subsystems (BSS) Error-Log Message Summary
Trend analysis of the BSC fault summary (Appendix 1A) has shown from careful observation of “Frequency of Occurrence” and their corresponding “Duration” that: they occur more frequently and the higher the “Frequency of Occurrence” the lower the“Duration” (MTTR) and vice versa (Fig. 4.1). Consequently, faults that are of high priority have two parameters that have major impact on network performance, i.e. the “Frequency of Occurrence” and the “Mean Time to Repairr” such faults to restore the network to its normal operation. When the error-log summary is further classified based on priority; the same behavior was noticed.
The classification of BSS alarms based on Priority is further divided into Subclasses: High Level Priority Faults with Complete Impact on the Network, which comprises of „BSS Internal Problems‟,„RSL Link failed‟ and „LAPD_OML Failure‟; High Level Priority Faults with no Impact on Call Processing but Severely Affecting Specific
Fault Trend Analysis of Mobile Switching Center (MSC) Error-Log Message Summary
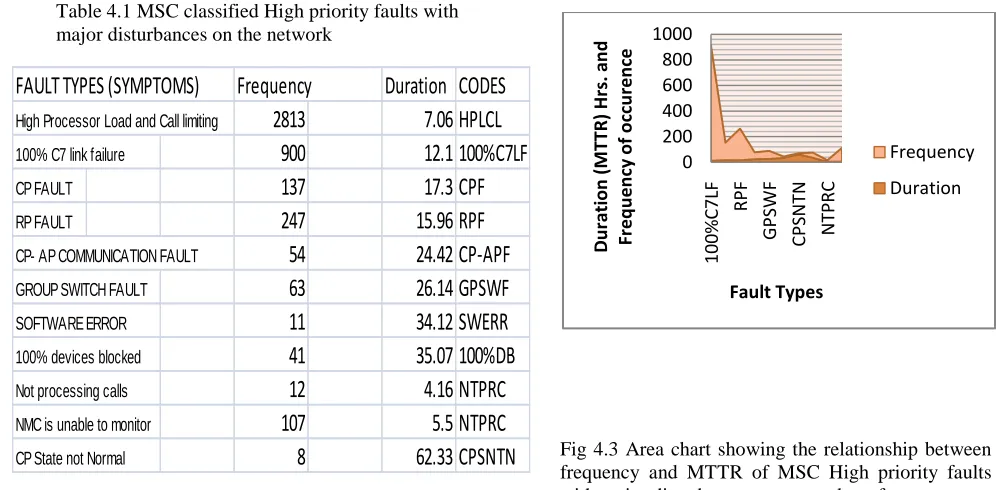
Table 4.1 MSC classified High priority faults with major disturbances on the network
Fig 4.3 Area chart showing the relationship between frequency and MTTR of MSC High priority faults with major disturbances on network performance.
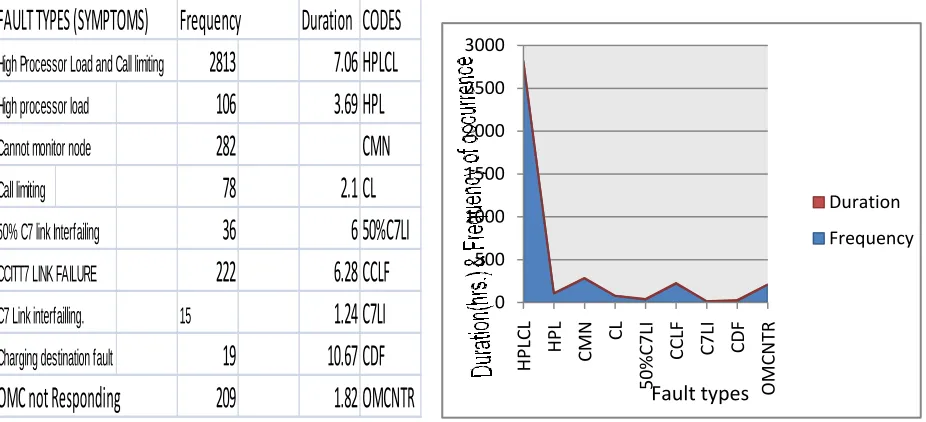
Table 4.2 showing MSC classified High priority faults With little or no disturbances on the network
0 200 400 600 800 1000
100%
C7
LF
RPF
G
PSWF
CPSNT
N
N
TPRC
D
u
ration
(M
TTR)
H
rs.
an
d
Fr
e
q
u
e
n
cy
o
f o
cc
u
re
n
ce
Fault Types
Frequency
Duration
FAULT TYPES (SYMPTOMS)
Frequency
Duration CODES
High Processor Load and Call limiting
2813
7.06 HPLCL
100% C7 link failure
900
12.1 100%C7LF
CP FAULT
137
17.3 CPF
RP FAULT
247
15.96 RPF
CP- AP COMMUNICATION FAULT
54
24.42 CP-APF
GROUP SWITCH FAULT
63
26.14 GPSWF
SOFTWARE ERROR
11
34.12 SWERR
100% devices blocked
41
35.07 100%DB
Not processing calls
12
4.16 NTPRC
NMC is unable to monitor
107
5.5 NTPRC
FAULT TYPES (SYMPTOMS) Frequency
Duration CODES
High Processor Load and Call limiting
2813
7.06 HPLCL
High processor load
106
3.69 HPL
Cannot monitor node
282
CMN
Call limiting
78
2.1 CL
50% C7 link Interfailing
36
6 50%C7LI
CCITT7 LINK FAILURE
222
6.28 CCLF
C7 Link interfailling.
15
1.24 C7LI
Charging destination fault
19
10.67 CDF
OMC not Responding
209
1.82 OMCNTR
Fig 4.4 Area chart showing the relationship between frequency and MTTR of MSC High priority faults with little or no impact on network performance.
The summary of MSC Alarms can be classified based on the criterion of priority. MSC faults are very critical to network performance and smooth operation of the entire mobile network due to the nature of the switching equipment and the large volume of software modules implemented for various network operation. The MSC also interconnect all other network elements and the Network Management Systems.MSC Fault Summary was also classified into: High level priority Faults with complete impact and major disturbance on the system (Table 4.1) and High level priority faults with no impact on call processing but severely affecting specific services (Table 4.2)
B. INTERPRETATION OF RESULTS FOR MSC MSC Fault Summary was also classified into: „‟High Level Priority Faults with Complete Impact and Major Disturbance on the System” (Table 4.1) and “High Level Priority Faults with no Impact on Call Processing but Severely Affecting Specific Services (Table 4. 2). The same impact the twin parameters of “Duration (MTTR)” and “Frequency of Occurrence have on BSS is applicable to MSC. High level priority faults with major impact on call processing, with few exceptions though. As shown in Fig 4.3; the last two fault types: „‟NTPRC‟‟ and „‟NUTMON‟‟ occurs 12 and 107 times respectively while their respective duration is 4.16 and 5.5 Hrs. This is a slight deviation from the usual trend that when the number of occurrence increases; the duration decreases this is attributed to the critical nature
of these fault types: If the Network cannot process calls and NMC is unable to monitor faults, then the network is being crippled with serious service disruption. Hence, very low MTTR values. For example, 100%C7LF which occurs 900 times in three months with a low duration of 12.1hrs compared to software error (SWERR) which occur just 11 times but the MTTR is about 34.12hrs.
But for those faults that have little or no impact on signal processing; serious deviation from the observed behavior was noticed, here, on the average the MTTR for all fault types in this category is 5 hours irrespective of the frequency of occurrence of such fault types. These fault types are considered to be of high priority base on two criterions, firstly, they occur more frequently than other fault types and secondly, they are associated with a relatively short MTTR i. e. the duration it takes to restore network to normal operational condition.
A critical look at the chart (Fig. 4.4) shows that the average MTTR here is relatively low and almost constant for all fault types not minding the number of times such faults occur. The recommended duration by ITU of 4hrs MTTR is almost met here. Although, this fault types have no serious impact on call processing but affects specific services like:„‟charging destination fault‟‟ and „‟call limiting‟‟ which have serious impact on revenue and network quality of services; hence, their relative low MTTR values.
0 500 1000 1500 2000 2500 3000
H
P
LCL HPL
CMN
CL
50%
C7
LI
CC
LF
C
7LI CDF
OMCNTR
Duration
Frequency
VI. CONCLUSIONS
The results of the Fault Trend Analysis shows that there are two important parameters that affect network performance during network event/alarm analysis: “The Frequency of Occurrence” of the fault types (symptoms) from a given cause; and the “Mean Time to Clear such faults (MTTR) or duration.
The fault trend analysis shows that the higher the frequency of occurrence of any particular fault types the lower the duration or the mean time to clear such faults and vice versa. But, a deviation from this observation was noticed for those faults at the MSC that have little or no impact on signal processing.
REFERENCES
[1] Daniel, P. and Tsao, M. (1983). Trend analysis on systems error profiles. In IEEE Proceedings & Symposium on Fault Tolerant
Computing, Milano, Italy.p. 116-119.
[2] David, M. (2007). Nortel Units Performance Management Solutions.Nexus Telecoms whitepaper, Document T – 12 – 00247, Nexus Switzerland. Retrieved June 1, 2010 from http://www.nexus.com/nortelunits/performance
[3] Distaso, J. (1980). The Measurement and Management of Software Reliability. IEEE Trans Software eng. 68(9), 1133-1134.
[4] Hughes, S. (2006). Enterprise architecture for next generation telecommunications service provider. Huges Technical Journal. Retrieved October 12, 2010 from http://www.hsc.com/ [5] Jacobson, G. andWeissman, M. D. (1993, November 10). Alarm
Correlation Techniques. IEEE network forum, Stuttgart,
Germany. 7(6), 52-59.
[6] Masud, A. (2006). Fault Management in Communications Networks. MSC Thesis. Ahmadu Bello University, Zaria. Retrieved January 7, 2009, from Electrical Engineering departmental library.
[7] Maye, J. and Morvan, G. (2006). Achieving efficient operational transformation.Alactel telecommunications review. 21(3), 253-255.
[8] Nicolas, M., and Peirce–Nenri, G. (2003). Integrated network and service management for Mobile Network.Alcatel telecommunication review. 10(4), 153-157.
[9] Paessler, M. (2007). Towards a common OSS Architecture. A Journal on Open Element Management System (EMS) Suite by
Nokia. Retrieved January 10, 2010
fromwww.nokiasiemensnetworks.com/