Dr. Sadhana Rajput
Quality Assurance Laboratory,
The M. S. University of Baroda, Vadodara E-mail: [email protected]
Address for correspondence
Access this article online www.japer.in
Development and validation of UV and RP-HPLC method for
estimation of Nepafenac in bulk drug and opthalmic formulation
Introduction
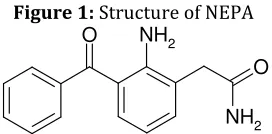
Nepafenac (NEPA), [2-(2-amino 3-benzoyl phenyl) acetamide] (Figure 1) is Antiinflammatory (NSAID’s) which is indicated for the treatment of pain and inflammation associated with cataract surgery. NEPA is a prodrug. After penetrating the cornea, NEPA undergoes rapid bioactivation to amfenac, which is a potent NSAID that uniformly inhibits the COX1 and COX2 activity. [1] Amfenac is thought to inhibit the
action of prostaglandin H synthase (cyclooxygenase), an enzyme required for prostaglandin production.
Figure 1: Structure of NEPA O
O
NH2 NH2
The literature survey reveals that, two simple and sensitive visible spectrophotometric methods have been developed for the estimation of NEPA in pure and pharmaceutical dosage forms. These methods are based on the oxidative coupling reaction between
MBTH(3-Methyl-2-bezothiazolinone hydrazone) and NEPA resulting in the formation of pink colored chromogen (λmax 540 nm) and the complex formation
between Potassium permanganate and NEPA resulting in the formation of blood red colored chromogen (λmax 425 nm). [2] One of the reported
method utilizes phosphate buffer for development of UV method. [3] Determination of NEPA in plasma by
RP-HPLC has also been reported. [4] The chemical
purity of NEPA has been determined by HPLC-UV method. [5] Hence, the main aim of the present work is
to develop a simple, rapid, accurate and precise UV and RP-HPLC method for determination of NEPA in suspension formulation. The proposed method was validated as per ICH guidelines. [6]
Experimental
Chemicals:
NEPA (Bulk drug) was kindly provided by Sun Pharma, Baroda. Nevanac [7] Ophthalmic Suspension
0.1%w/v (Alcon, USA) was purchased from local pharmacy. Analytical and HPLC grade Methanol (MeOH) and acetonitrile (ACN) were purchased from rankem, mumbai. HPLC grade Ammonium Formate and Formic acid were purchased from Loba Chemie Pvt Ltd, Mumbai.
Instrumentation and Analytical Conditions: Research
ResearchResearch
Research ArticleArticleArticleArticle
An ultraviolet (UV) and reverse phase high-performance liquid chromatographic (RP-HPLC) methods were developed and validated for the quantitative determination of Nepafenac in bulk and suspension formulation. UV method was performed with the λ max at 238.0 nm and 378.0 nm. RP-HPLC was carried out using C8 Olyster columnn with a mobile phase Acetonitrile: 10 mM Ammonium Formate buffer (pH 4.0 with formic acid): Methanol (27.5:45:27.5). The flow rate was 1.0 ml min-1 and effluent was detected at 238 nm. The retention time of NEPA was 4.60 min. Both the methods showed good linearity, reproducibility and precision. No spectral or chromatographic interferences from the excipients were found in UV and RP-HPLC. Validation parameters such as linearity, precision, accuracy, and specificity were determined. The methods were successfully applied to commercial formulation.
Keywords: UV, RP-HPLC, Nepafenac, Q2 (R1)
ABSTRACT ABSTRACT ABSTRACT ABSTRACT
Sadhana Rajput*, Chhaya Shrimali, Madhuri Baghel
Quality Assurance Laboratory, Centre for Relevance and
Excellence in Novel drug Delivery Systems, Pharmacy Department, G. H. Patel Building, Donor’s Plaza, The Maharaja Sayajirao University of Baroda, Vadodara, Gujarat, 390002, India.
Shimadzu UV-1700 double beam spectrophotometer connected to a computer loaded with Shimadzu UV Probe 2.10 software was used for all the spectrophotometric measurements. The absorbance spectra of the reference and test solutions were carried out in 1cm quartz cells over the range of 200-800 nm. Chromatography was performed on Shimadzu (Shimadzu Corporation, Kyoto, Japan) chromatographic system equipped with Shimadzu LC-20AT pump and Shimadzu SPD-20AV absorbance detector. Samples were injected through a Rheodyne 7725 injector valve with fixed loop at 20 μl. Data acquisition and integration was performed using Spinchrome software (Spincho biotech, Vadodara). The isocratic RP-HPLC was carried out at a flow rate of 1.0mLmin−1 using C8 Olyster columnn with a
mobile phase ACN: 10 mM Ammonium Formate buffer (pH 4.0 with formic acid): MeOH (27.5:45:27.5). Detection was carried out at 238.0 nm. The mobile phase was prepared daily, filtered through a 0.2 μm membrane filter (Millipore) and sonicated for 5 min before use.
Preparation of Standard Solutions:
UV Method: NEPA stock solution (1mg mL-1) was
prepared by dissolving 25 mg of NEPA in 25 ml MeOH in 25ml volumetric flask. NEPA working solution (0.1 mg mL-1) was prepared by transferring 2.5 ml from
stock solution to 25 ml volumetric flask and diluted up to the mark with MeOH. For preparation of calibration curve at 238.0 nm, aliquots ranging from 0.4 ml to 2 ml were taken, from standard stock solution, in 10 ml volumetric flask and diluted to 10 ml with MeOH to give final concentration of 4, 8, 12, 16, 20μg/ml of NEPA. For preparation of calibration curve at 378.0 nm, aliquots ranging from 2 ml to 6 ml were taken, from standard stock solution, in 10 ml volumetric flask and diluted to 10 ml with MeOH to give final concentration of 20, 30, 40, 50 60μg/ml of NEPA .
HPLC Method
NEPA stock solution (1mg mL-1) was prepared by
dissolving 25 mg of NEPA in 25 ml MeOH in 25ml volumetric flask. NEPA working solution (0.1 mg mL-1)
was prepared by transferring 2.5 ml from stock solution to 25 ml volumetric flask and diluted up to the mark with MeOH. Aliquots ranging from 0.01 ml to 2 ml were taken, from standard stock solution, in 10 ml volumetric flask and diluted to 10 ml with Mobile phase to give final concentration of 1, 5, 10, 25, 50, 75, 100, 150 & 200 μg mL-1 of NEPA. 20 μl of each
concentration were injected in the chromatographic system and chromatogram was recorded. Calibration graph was constructed by plotting peak area versus concentration of each drug and the regression equation was calculated.
Preparation of Sample Solutions
For both methods 5ml of 0.1% aqueous suspension of NEPA was transferred to 50 ml of volumetric flask and sufficient MeOH was added to get the working sample (100µg mL-1). The solution was filtered through 0.2 µ
whatman filter paper. Different volumes of above prepared solution were taken and diluted with MeOH to get different concentrations of NEPA. The above prepared solutions were analyzed by UV and HPLC for the content of NEPA.
Results and Discussion
Validation of Methods
Linearity and range
The proposed spectrophotometric method showed good linearity in the concentration range of 4 to 20 µg mL-1 for NEPA (Figure 2 (a and b)). For
chromatographic method the linearity was observed over the concentration range of 1-200 µg mL-1 (Figure
Figure 2 (a): Calibration Curve for NEPA at 238nm (UV)
Figure 2 (b): Calibration Curve for NEPA at 378nm (UV)
Figure 3: Calibration curve of NEPA (RP-HPLC)
Table 1: Results of Linearity data for the quantitative determination of NEPA
Statistical
parameters UV (238) UV (378) HPLC
Concentrati on range (μgmL−1)
4- 20 4- 20 1-200 Regression
equation
0.0786X+0.00 65
0.0235X+0.02 25
49.985X+27.6 92 Correlation
coefficient (r)
0.999 0.9997 0.9995
Precision
Inter-day and intra-day precision for both methods were measured in terms of % RSD. The experiment
was repeated 3 times in a day (Intraday precision) for 3 different concentrations and the average % RSD values of the results were calculated. Similarly the experiment was repeated on 3 different days (Inter day precision) and the average % RSD value for peak area of NEPA was calculated. The low value of SD obtained confirms the precision of the method (Table 2).
Table 2: Intra and Inter-day precision data for estimation of NEPA
Precision RSD (%)
UV (238) UV (378) HPLC
Intra day 0.44521 0.404324 0.511283
Inter day 1.289294 1.181257 1.167331
LOD and LOQ:
Calibration curve was repeated for 9 times and the standard deviation (SD) of the intercepts was calculated. Then LOD and LOQ were measured as follows. The results obtained are shown in Table 3. LOD=3.3 * SD/slope of calibration curve
LOQ=10 * SD/slope of calibration curve SD = Standard deviation of intercepts
Table 3: LOD and LOQ of NEPA
Parameter UV (µg ml
-1)
HPLC (µg ml-1)
238 378
LOD 0.034339 0.028325 0.309582
LOQ 0.107179 0.088407 0.938128
Accuracy
Table 4: Recovery from Marketed formulation
Excess drug added to
analyte (%)
Theoretical Content (µg/ml)
UV (238) UV (378) HPLC
*Amount Found (µg/ml)
Recovery (% ) ± S.D.
*Amount Found (µg/ml)
Recovery (% ) ± S.D.
*Amount Found (µg/ml)
Recovery (% ) ± S.D.
0 10.0 9.953 99.253±0.0498 10.1 101.0±0.0233 9.984 99.849±0.0454 80 18.0 17.91 99.500±0.423 17.84 99.166±0.421 17.980 99.895±0.043 100 20.0 19.852 99.261± 0.627 20.138 100.69± 0.641 20.041 100.242±
0.127 120 22.0 21.82 99.217±0.599 22.04 100.21±0.523 22.971 99.872±0.043 *Average of three experiments
Robustness
The robustness of spectroscopic method was determined by using MeOH of 3 different manufacturers for the preparation of stock solution of standard drugs. The average value of % RSD for determination of NEPA less than 2 % revealed the robustness of the method (Table 5).
Table 5: Robustness study using MeOH from three different manufacturers
MeOH
NEPA (mg) Taken
*NEPA Found
% Recovery NEPA
1 1 0.992 99.2±0.701 2 1 0.982 98.2±0.441 3 1 0.99 99.0±0.143
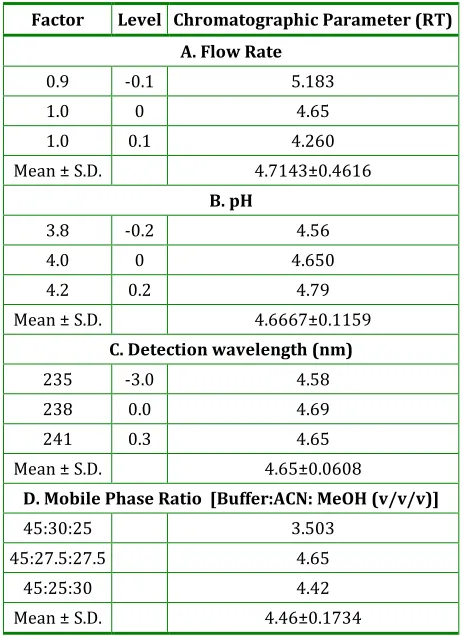
To evaluate robustness of the chromatographic method few parameters were deliberately varied. The parameters included variation in flow rate, change in pH of buffer, detection wavelengths and organic ratio. The average value of % RSD for determination of NEPA less than 2 % revealed the robustness of the method. Each factor selected to examine were changed at 3 levels (-1, 0, 1). One factor at the time was changed to estimate the effect. Thus replicate injections (n=3) of standard solution at 3 concentration levels were performed under small changes of 3 chromatographic parameters (factors). Results, presented in Table 6 indicate that the selected chromatographic parameter s remained unaffected by small variation in these factors, which demonstrates that the developed method is robust.
Table 6: Robustness of HPLC method
Factor Level Chromatographic Parameter (RT)
A. Flow Rate
0.9 -0.1 5.183 1.0 0 4.65 1.0 0.1 4.260 Mean ± S.D. 4.7143±0.4616
B. pH
3.8 -0.2 4.56 4.0 0 4.650 4.2 0.2 4.79 Mean ± S.D. 4.6667±0.1159
C. Detection wavelength (nm)
235 -3.0 4.58 238 0.0 4.69 241 0.3 4.65 Mean ± S.D. 4.65±0.0608
D. Mobile Phase Ratio [Buffer:ACN: MeOH (v/v/v)]
45:30:25 3.503 45:27.5:27.5 4.65
45:25:30 4.42 Mean ± S.D. 4.46±0.1734
Stability in sample solutions:
Solutions containing different concentrations of NEPA were prepared from standard stock solution and stored at room temperature for 24hrs. They were then injected in to LC system. No additional peaks found in chromatogram & area under the peak comes within 2.0 % of RSD indicate the stability of NEPA in the sample solution.
System suitability
Table 7: Results of system suitability parameters
Parameters Data obtained
Theoretical Plates per meter± RSD 102397±0.835 Theoretical Plates per column± RSD 5120±0.556
Capacity Factor 0.45 Symmetry Factor± RSD 1.143±0.106
Resolution ± RSD 2.3 % RSD of 5 injected solution 1.4372±0.204
Assay:
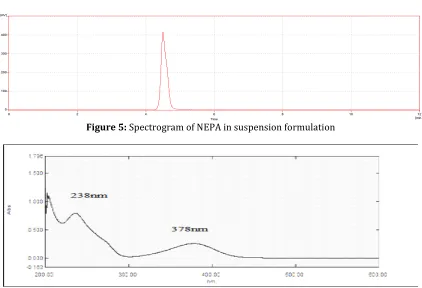
Applicability of the proposed method was tested by analyzing the commercially available ophthalmic suspension formulation containing 0.1% w/v of NEPA. Each sample was analyzed in
Triplicate. Figure 4 and 5 shows an HPLC chromatogram and spectrogram of NEPA in suspension formulation. None of the tablets ingredients interfered with the analyte peak. The results presented in Table 8 are in good agreement with the labelled content.
Table 8: Analysis of marketed formulation
Formulation Drug λmax Labeled (0.and1%w/v) UV HPLC
Amt*. Found % Assay Amt*. Found % Assay
NEVANAC NEPA 238nm 0.1 0.0982 98.2±0.441 0.0996 99.62±0.234 378nm 0.1 0.0997 99.7±0.564 --- ---
Figure 4: HPLC chromatogram of NEPA in suspension formulation
Figure 5: Spectrogram of NEPA in suspension formulation
Conclusion
A validated UV and isocratic HPLC methods have been developed as per ICH guideline for the determination of NEPA in suspension formulation. The proposed methods are simple, rapid, accurate, precise, and specific. Its chromatographic run time of 4.6 min allows the analysis of a large number of samples in a
short period of time. Therefore, it is suitable for the routine analysis of NEPA in pharmaceutical dosage form.
Acknowledgment
References:
1. Gamache D. A., Graff G., Brady M. T., Spellman J. M., Yanni J. M. Nepafenac, A Unique Nonsteroidal Prodrug with Potential Utility in the Treatment of Trauma-Induced Ocular Inflammation: I. Assessment of Anti-Inflammatory Efficacy. Inflammation. 2000; 24(4): 357-370.
2. Anupama B., Madhavi D., Amareswari S, Hari Prasad C. H. New Visible Spectrophotometric Methods for Determination of Nepafenac. AJRC. 2011; 4: 611. 3. Yadav S. J., Doshi M. N., Panchori H. P., Bhalero S. S. A
Simple & rapid Spectrophotometric Methods for Determination of Nepafenac in pharmaceuticals. JPR. 2012; 5 (8): 4292.
4. Phani Kumar V., Sunandamma Y. A Novel RP-HPLC Method for quantification of Nepafenac in formulation, Plasma (In Vitro). IJPBS. 2012; 3(4): 847-854.
5. Abramskaa E. L., Jedynaka L., Formelab A. , Roszczynski J., Cybulskib M., Puchalskaa M., Zagrodzkaa J. Development and validation of high performance liquid chromatography with a spectrophotometric detection method for the chemical purity and assay of Nepafenac. J. Pharm. Biomed. Anal. 2014; 91: 1-6.
6. International conference on harmonisation of technical requirements for registration of pharmaceuticals for human use ICH harmonised tripartite guideline. Validation of analytical procedures: text and methodology Q2(R1). 1996. 7. http://www.rxlist.com/nevanac-drug.htm. Accessed
on Jan 2014.
How to cite this article: Sadhana Rajput, Chhaya Shrimali, Madhuri Baghel; Development and validation of UV and RP-HPLC method for estimation of Nepafenac in bulk drug and opthalmic formulation; J. Adv. Pharm. Edu. & Res. 2015: 5(1): 15-20.