This is an open access journal, and articles are distributed under the terms of the Creative Commons Attribution-Non Commercial-ShareAlike 4.0 License, which allows others to remix, tweak, and build upon the work non-commercially, as long as appropriate credit is given and the new creations are licensed under the identical terms.
Evaluating the use and quality of University Face-Book in
medical education: a cross sectional study, UAE
Ammar Abdulrahman Jairoun
1*, Sabaa Saleh Al-Hemyari
2, Abdulla khalfan Alkendi
3,
Mina Rabea Al
Ani
4, Moyad Shahwan
51Department of Public Health and Safety, Consumer Product Safety Section, Dubai Municipality, UAE,2Department of Clinical Pharmacy, Ministry of Health and Prevention,
UAE, 3Emergency, Crisis & Disaster center, Ministry of Health, UAE, 4Department of Basic medical science, University of Sharjah, UAE, 5College of Pharmacy and Health
Sciences, Ajman University, Ajman.
Correspondence: Ammar Abdulrahman Jairoun, Department of Public Health and Safety, Consumer Product Safety Section, Dubai Municipality, UAE. E_mail: [email protected]
ABSTRACT
Context: Face-book allows students to create, manipulate, and share content, exchange opinions and connect with each other online. These features and functions among others, motivate the students to use the face-book in the context of medical education, thus better understanding of this service’ expectations and perceptions, improves the quality. Aims: to evaluate the use and quality of university Face-book page in medical education from medical students’ perspective in the content of service quality. Setting and Design: This study was a descriptive cross sectional survey conducted from March 2017 to December 2017 among a convenience sample of 144 undergraduate medical students of Ajman University (AU) in United Arab Emirates (UAE). Method and Material: Data were collected by using validated web-based electronic Questionnaire which is a personal, socio-economic and the Service Quality (SERVQUAL) questionnaire. Statistical analysis: Data analysis was done through SPSS version 23. Paired sample test was used to investigate the gap exists between the expectation and perception mean scores. Results: Medical students’ expectations exceed the actual quality provided for service recipients. Conclusions: The negative gap between students’ perceptions and expectations in all dimensions of quality, indicates that the actual service is less than what was expected and shows that quality improvement is necessary in all dimensions.
Keywords: Face-book, Medical students, Social media, Survive quality
Introduction
Social Network Sites (SNSs) such as Facebook, MySpace, Twitter, Bebo and others can be described as web-based medium where the individuals create a public or semi-public profile for social interaction and content sharing. Practice and research show that many organizations realize how critical are the SNSs’ services and have integrated these sites into different domains in many felids such as commerce, business, marketing, politics, health, computing and engineering [1]. In society advances, SNSs
had been engaged as tools of interaction with students in the universities. It also has a significant value in learning where the students can share information about the institution, academic materials [2] and attitude about instructors’ performance and student services [3]. Moreover, the use of such non-regulated SNSs may affect the grades of students who use these sites [4]. In this context, an increasing number of researchers have focused their attention on the use of social media services in the educational context and open several ways to use this technology [2, 4-8]. Moreover, a number of studies have also assessed the characteristics and functions identified by students in social media enhanced learning systems in the context of higher education and other targeting the factors that motivate the users to act in social media services related to their studies and student life [9, 10]. As social networking became critical and important in medical education, SNSs quality and the information provided to those who are active on these sites should be satisfying to meet their expectations. Considering this fact, the current study aimed to Access this article online
Website: www.japer.in E-ISSN: 2249-3379
How to cite this article: Ammar Abdulrahman Jairoun, Sabaa Saleh
Al-Hemyari, Abdulla khalfan Alkendi, Mina Rabea Al Ani, Moyad Shahwan.
Evaluating the use and quality of University Face-Book in medical education: a cross sectional study, UAE. J Adv Pharm Edu Res 2018;8(2):55-62.
evaluate the service quality of university Face-book page in medical education from students’ perspective and to understand the level of gap that exists between expectation and perception among the medical students in United Arab Emirates (UAE) with regard to service quality.
Materials and Methods
This study was descriptive cross sectional survey, conducted from March 2017 to December 2017 among undergraduate medical students of Ajman University (AU) in UAE. Approval for study conduction was received from the University Student Research Committee. All undergraduate students from 1st to 5th year of medical colleges (pharmacy and dentistry) and who have used Face-book in their education were eligible and enrolled in the study. Postgraduates of the university were excluded. For statistical reason, first and second year students were combined and called first years, also we combined third, fourth and fifth year students and called final year. A convenience sampling technique was used to approach potential respondents for the study. This survey was designed to be self-completed by the student through a web-based electronic link that was sent to the respondents’ emails. The questionnaire was sent to 200 medical students from which 144 respondents have been achieved yielding a response rate of 72%. The participation of the students in this study was entirely voluntary and without compulsion. The nature and purpose of the study was explained within the first page of the survey and if participants continued to the following page this, was taken as their consent and willingness to participate in the study. Data collection was performed using a SERVQUAL questionnaire developed by Parasuraman and Zeithaml [11] in 1985. The questionnaire comprises of two main sections: an “expectation” section with 33 items and a “perception” section consisting of a set of matching statements. The items in both expectation and perception sections were classified into seven dimensions of Functionality & Design, Reliability & Trustworthiness, Responsiveness, Assurance, Empathy, Content and Security & Privacy. These items were rated on 7-points Likert scale (1= “Completely Disagree,” 2 = “Disagree,” 3 = “Slightly Disagree,” 4 = “Neutral,” 5 = “Slightly Agree,” 6 = “Agree,” and 7 = “Completely agree”). Considering the standard questionnaire, the questionnaire was thoroughly reviewed by subject experts and a pilot study was carried out among 20 randomly selected medical students. The data was analyzed using the SPSS version 23. Two scores were created to measure the expectation and perception of the participants towards the service quality of university Face-book page. Each score was defined as the proportion of questions for which the answers were either “agree” or “completely agree”. Paired sample test was used to investigate the gap exists between the expectation and perception mean scores. A p value < 0.05 was chosen as the criteria to make decisions regarding statistical significance.
Results:
1. G Socio-demographic characteristics of
the participants
A total of 144 subjects participated in the study and completed the whole questionnaire. Males constituted 43.8% of sample (n= 63) and 56.3% of respondents were females (n=81). Among these participants 23.6% belonged to first years and 76.4% were final year students. Regarding nationality, 66% were Emirati and 34% were expatriates. For more details, see table 1.
Table 1: Demographic characteristics of the participants (n=144)
Socio-demographic Frequency (%)
Gender: Male
Female 63 (43.8%) 81 (56.3%)
Study Year First years
Final years 110 (76.4%) 34 (23.6%)
Nationality: Emeriti
Non Emirati 95 (66%) 49 (34%)
2. Expectation and Perception about
university Face-Book page in medical
education: Analysis of the overall scores
Figure 1: Histogram of Expectation and Perception scores 3. Expectation and Perception about
university Face-Book page in medical
education: A Gap Analysis
Table 2 shows the analysis of the gap existing between the expectation and perception of undergraduate medical students towards university face-book page. The table also provides the 95% confidence interval for the differences along with p-values. These p-values were provided from the results of the paired sample t test.
The study revealed that, there is (-0.49) an overall gap between the perception and expectation of the undergraduate medical students towards the service quality of university Face-book page. Moreover, the significance value is (P = ˂0.0001) which is less than 0.05 at 95% level of significance. The same pattern of the results was observed between the mean scores of all SERVQUAL dimensions, where the expectation mean scores are greater than the perceptions mean scores. we can conclude that; medical students’ expectations exceed the actual quality provided for service recipients.
The results of each of the questions related to SERVQUAL
dimensions were analyzed using frequency and percentage (Table, 3,4,5,6,7,8 & 9).
Table 2: Mean scores of SERVQUAL dimensions
Table 4: Frequency table for Reliability & Trustworthiness of university Face-Book page
Reliability & Trustworthiness items Completely Disagree n(%)
Disagree
n(%) Slightly Disagree n(%) Neutral n(%)
Slightly Agree n(%)
Agree n(%)
Completely Agree
n(%) E6- Facebook page administrators should include
a post update at least every second day. 3 (2.1%) 5 (3.5%) 10 (6.9%) 16 (11.1%) 35 (24.3%) 34 (23.6%) 41 (28.5%) P6- your university Facebook page administrator
includes a post update at least every second day. 4(2.8%) 10 (6.9%) 26 (18.1%) 27 (18.8%) 34(23.6%) 34(23.6%) 9 (6.3%) E7- Facebook page administrators should
respond to queries by showing sincere interest in
solving them. 2 (1.4%) 2 (1.4%) 18(12.5%) 21 (14.6%) 29(20.1%) 38(26.4%) 34(23.6%) P7- your university Facebook page administrator
responds to queries by showing sincere interest
in solving them. 8(5.6%) 11(7.6%) 17(11.8%) 31
(21.5%) 41 (28.5%) 22(15.3%) 14 (9.7%) E8- Facebook pages should deliver the
information they promise their users. 4 (2.8%) 2 (1.4%) 10 (6.9%) 22 (15.3%) 31 (21.5%) 37 (25.7%) 38 (26.4%) P8- your university Facebook page delivered the
information it promised to the user. 2 (1.4%) 6 (4.2%) 17 (11.8%) 35 (24.3%) 35(24.3%) 31 (21.5%) 18 (12.5%) E9- Facebook pages and posts should not include
any errors or mistakes. 4 (2.8%) 2 (1.4%) 12 (8.3%) 16 (11.1%) 38(26.4%) 35(24.3%) 37 (25.7%) P9- your university Facebook page and posts do
not include any errors or mistakes. 3 (2.1%) 8 (5.65) 9 (6.3%) 36 (25%) 38 (26.4%) 30 (20.8%) 20 (13.9%) E10- The pictures and videos on the Facebook
page of any university should reflect the reality
of the university. 3 (2.1%) 4 (2.8%) 14 (9.7%) 16 (11.1%) 16 (11.1%) 40 (27.8%) 38 (26.4%) P10- The pictures and videos on your university
Facebook page reflect the reality of the
university accurately. 6 (4.2%) 4 (2.8%) 10 (6.9%) 32 (22.2%) 50(34.7%) 25(17.4%) 17(11.8%) E11- Facebook users should be able to trust the
information provided on the Facebook page of
any university. 4 (2.8%) 3 (2.1%) 13 (9.0%) 27 (18.8%) 26 (18.1%) 39 (27.15) 32 (22.2%) P11- You trust the information provided on the
your university Facebook page. 2 (1.4%) 6 (4.2%) 13 (9.0%) 27 (18.8%) 48(33.3%) 27 (18.8%) 21(14.6%)
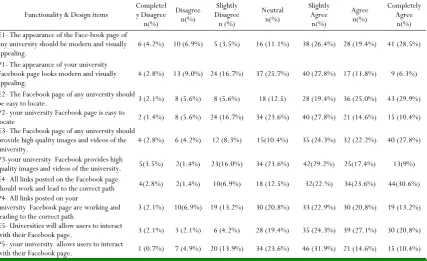
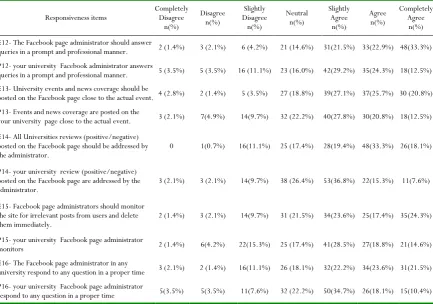
Table 5: Frequency table for Responsiveness of university Face-Book page Table 3: Frequency table for Functionality & Design of university Face-Book page
Functionality & Design items Completely Disagree n(%)
Disagree n(%)
Slightly Disagree n (%)
Neutral n(%)
Slightly Agree
n(%)
Agree n(%)
Completely Agree
n(%) E1- The appearance of the Face-book page of
any university should be modern and visually
appealing. 6 (4.2%) 10 (6.9%) 5 (3.5%) 16 (11.1%) 38 (26.4%) 28 (19.4%) 41 (28.5%) P1- The appearance of your university
Facebook page looks modern and visually
appealing. 4 (2.8%) 13 (9.0%) 24 (16.7%) 37 (25.7%) 40 (27.8%) 17 (11.8%) 9 (6.3%) E2- The Facebook page of any university should
be easy to locate. 3 (2.1%) 8 (5.6%) 8 (5.6%) 18 (12.5) 28 (19.4%) 36 (25.0%) 43 (29.9%) P2- your university Facebook page is easy to
locate 2 (1.4%) 8 (5.6%) 24 (16.7%) 34 (23.6%) 40 (27.8%) 21 (14.6%) 15 (10.4%) E3- The Facebook page of any university should
provide high quality images and videos of the
university. 4 (2.8%) 6 (4.2%) 12 (8.3%) 15(10.4%) 35 (24.3%) 32 (22.2%) 40 (27.8%) P3-your university Facebook provides high
quality images and videos of the university. 5(3.5%) 2(1.4%) 23(16.0%) 34 (23.6%) 42(29.2%) 25(17.4%) 13(9%) E4- All links posted on the Facebook page
should work and lead to the correct path 4(2.8%) 2(1.4%) 10(6.9%) 18 (12.5%) 32(22.%) 34(23.6%) 44(30.6%) P4- All links posted on your
university Facebook page are working and
leading to the correct path 3 (2.1%) 10(6.9%) 19 (13.2%) 30 (20.8%) 33 (22.9%) 30 (20.8%) 19 (13.2%) E5- Universities will allow users to interact
with their Facebook page. 3 (2.1%) 3 (2.1%) 6 (4.2%) 28 (19.4%) 35 (24.3%) 39 (27.1%) 30 (20.8%) P5- your university allows users to interact
Responsiveness items Completely Disagree n(%)
Disagree n(%)
Slightly Disagree n(%)
Neutral n(%)
Slightly Agree
n(%)
Agree n(%)
Completely Agree
n(%) E12- The Facebook page administrator should answer
queries in a prompt and professional manner. 2 (1.4%) 3 (2.1%) 6 (4.2%) 21 (14.6%) 31(21.5%) 33(22.9%) 48(33.3%) P12- your university Facebook administrator answers
queries in a prompt and professional manner. 5 (3.5%) 5 (3.5%) 16 (11.1%) 23 (16.0%) 42(29.2%) 35(24.3%) 18(12.5%) E13- University events and news coverage should be
posted on the Facebook page close to the actual event. 4 (2.8%) 2 (1.4%) 5 (3.5%) 27 (18.8%) 39(27.1%) 37(25.7%) 30 (20.8%) P13- Events and news coverage are posted on the
your university page close to the actual event. 3 (2.1%) 7(4.9%) 14(9.7%) 32 (22.2%) 40(27.8%) 30(20.8%) 18(12.5%) E14- All Universities reviews (positive/negative)
posted on the Facebook page should be addressed by
the administrator. 0 1(0.7%) 16(11.1%) 25 (17.4%) 28(19.4%) 48(33.3%) 26(18.1%) P14- your university review (positive/negative)
posted on the Facebook page are addressed by the
administrator. 3 (2.1%) 3 (2.1%) 14(9.7%) 38 (26.4%) 53(36.8%) 22(15.3%) 11(7.6%) E15- Facebook page administrators should monitor
the site for irrelevant posts from users and delete
them immediately. 2 (1.4%) 3 (2.1%) 14(9.7%) 31 (21.5%) 34(23.6%) 25(17.4%) 35(24.3%) P15- your university Facebook page administrator
monitors 2 (1.4%) 6(4.2%) 22(15.3%) 25 (17.4%) 41(28.5%) 27(18.8%) 21(14.6%) E16- The Facebook page administrator in any
university respond to any question in a proper time 3 (2.1%) 2 (1.4%) 16(11.1%) 26 (18.1%) 32(22.2%) 34(23.6%) 31(21.5%) P16- your university Facebook page administrator
respond to any question in a proper time 5(3.5%) 5(3.5%) 11(7.6%) 32 (22.2%) 50(34.7%) 26(18.1%) 15(10.4%)
Table 6: Frequency table for Assurance of university Face-Book page
Assurance items Completely Disagree n(%)
Disagree n(%)
Slightly Disagree n(%)
Neutral n(%)
Slightly Agree
n(%)
Agree n(%)
Completely Agree
n(%) E17- The information provided on the Facebook
page of any university should build confidence in the
university. 3 (2.1%) 4 (2.8%) 3 (2.1%) 23 (16.0%) 35(24.3%) 32(22.2%) 44(30.6%) P17- your university information provided on the
Facebook page 6(4.2%) 6(4.2%) 15(10.4%) 30 (20.8%) 39(27.1%) 33(22.9%) 15(10.4%) E18- The Facebook page administrator of any
university should have the ability to answer all
questions and possess the accurate information. 2 (1.4%) 2 (1.4%) 15(10.4%) 20(13.9%) 47(32.6%) 30(20.8%) 28(19.4%) P18- your university Facebook page administrator
has the ability to answer all questions and possess
the accurate information. 4 (2.8%) 3 (2.1%) 18(12.5%) 33 (22.9%) 47(32.6%) 23(16.0%) 16(11.1%) E19- The Facebook page should be a safe and secure
platform to express my opinions about any
university. 3 (2.1%) 2 (1.4%) 10(6.9%) 31 (21.5%) 36(25.0%) 33(22.9%) 29(20.1%) P19- your university Facebook page is a safe and
secure platform. 2 (1.4%) 6(4.2%) 12(8.3%) 48 (33.3%) 35(24.3%) 24(16.7%) 17(11.8%) E20- The content on a university Facebook page
should make me feel more confident 2 (1.4%) 4 (2.8%) 10(6.9%) 29 (20.1%) 38(26.4%) 28(19.4%) 33(22.9%) P20- your university content on the Facebook page
makes me feel more confident about attending the
institution in the future. 2 (1.4%) 6(4.2%) 18(12.5%) 33 (22.9%) 44(30.6%) 30(20.8%) 11(7.6%)
Table 7: Frequency table for Empathy of university Face-Book page
Empathy items Completely Disagree n(%)
Disagree n(%)
Slightly Disagree n(%)
Neutral n(%)
Slightly Agree
n(%)
Agree n(%)
Completely Agree
n(%) E21- University Facebook pages should make you
familiar with the institution before you ever
physically enter the campus. 1(0.7%) 2 (1.4%) 13(9.0%) 22 (15.3%) 44(30.6%) 26(18.1%) 36(25.0%) P21- your university Facebook page makes you
familiar with the institution before y ever
E22- Facebook pages should encourage me to connect with other current students at the
university. 2 (1.4%) 5(3.5%) 12(8.3%) 39 (27.1%) 25(17.4%) 34(23.6%) 27(18.8%) P22- your university Facebook page encourages
me to connect with other current students at the
university. 5(3.5%) 6(4.2%) 16(11.1%) 31 (21.5%) 50(34.7%) 22(15.3%) 14(9.7%) E23- Facebook pages should allow me to connect
with Alumni’s of the university. 3 (2.1%) 7(4.9%) 14(9.7%) 19 (13.2%) 45(31.3%) 35(24.3%) 21(14.6%) P23- The Facebook page allows me to connect
with Alumni’s of your university. 6(4.2%) 8(5.6%) 17(11.8%) 34 (23.6%) 42(29.2%) 21(14.6%) 16(11.1%)
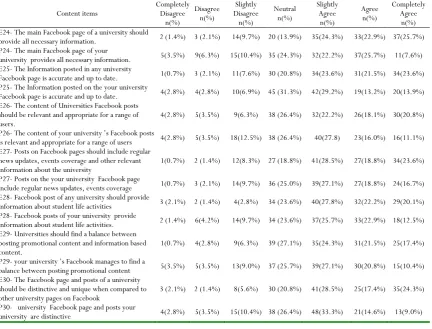
Table 8: Frequency table for Content of university Face-Book page
Content items Completely Disagree n(%)
Disagree n(%)
Slightly Disagree n(%)
Neutral n(%)
Slightly Agree n(%)
Agree n(%)
Completely Agree
n(%) E24- The main Facebook page of a university should
provide all necessary information. 2 (1.4%) 3 (2.1%) 14(9.7%) 20 (13.9%) 35(24.3%) 33(22.9%) 37(25.7%) P24- The main Facebook page of your
university provides all necessary information. 5(3.5%) 9(6.3%) 15(10.4%) 35 (24.3%) 32(22.2%) 37(25.7%) 11(7.6%) E25- The Information posted in any university
Facebook page is accurate and up to date. 1(0.7%) 3 (2.1%) 11(7.6%) 30 (20.8%) 34(23.6%) 31(21.5%) 34(23.6%) P25- The Information posted on the your university
Facebook page is accurate and up to date. 4(2.8%) 4(2.8%) 10(6.9%) 45 (31.3%) 42(29.2%) 19(13.2%) 20(13.9%) E26- The content of Universities Facebook posts
should be relevant and appropriate for a range of
users. 4(2.8%) 5(3.5%) 9(6.3%) 38 (26.4%) 32(22.2%) 26(18.1%) 30(20.8%) P26- The content of your university ’s Facebook posts
is relevant and appropriate for a range of users 4(2.8%) 5(3.5%) 18(12.5%) 38 (26.4%) 40(27.8) 23(16.0%) 16(11.1%) E27- Posts on Facebook pages should include regular
news updates, events coverage and other relevant
information about the university 1(0.7%) 2 (1.4%) 12(8.3%) 27 (18.8%) 41(28.5%) 27(18.8%) 34(23.6%) P27- Posts on the your university Facebook page
include regular news updates, events coverage 1(0.7%) 3 (2.1%) 14(9.7%) 36 (25.0%) 39(27.1%) 27(18.8%) 24(16.7%) E28- Facebook post of any university should provide
information about student life activities 3 (2.1%) 2 (1.4%) 4(2.8%) 34 (23.6%) 40(27.8%) 32(22.2%) 29(20.1%) P28- Facebook posts of your university provide
information about student life activities. 2 (1.4%) 6(4.2%) 14(9.7%) 34 (23.6%) 37(25.7%) 33(22.9%) 18(12.5%) E29- Universities should find a balance between
posting promotional content and information based
content. 1(0.7%) 4(2.8%) 9(6.3%) 39 (27.1%) 35(24.3%) 31(21.5%) 25(17.4%) P29- your university ’s Facebook manages to find a
balance between posting promotional content 5(3.5%) 5(3.5%) 13(9.0%) 37 (25.7%) 39(27.1%) 30(20.8%) 15(10.4%) E30- The Facebook page and posts of a university
should be distinctive and unique when compared to
other university pages on Facebook 3 (2.1%) 2 (1.4%) 8(5.6%) 30 (20.8%) 41(28.5%) 25(17.4%) 35(24.3%) P30- university Facebook page and posts your
university are distinctive 4(2.8%) 5(3.5%) 15(10.4%) 38 (26.4%) 48(33.3%) 21(14.6%) 13(9.0%)
Table 9: Frequency table for Security & Privacy of university Face-Book page
Security & Privacy items Completely Disagree n(%)
Disagree n(%)
Slightly Disagree n(%)
Neutral n(%)
Slightly Agree n(%)
Agree n(%)
Completely Agree
n(%) E31- Any university will protect the Facebook page
user’s right to privacy. 3 (2.1%) 12(8.3%) 19(13.2%) 19 (13.2%) 35(24.3%) 27(18.8%) 48(33.3%) P31- your university protects the Facebook user’s
right to privacy. 4(2.8%) 3 (2.1%) 9(6.3%) 29 (20.1%) 48(33.3%) 32(22.2%) 19(13.2%) E32- Facebook page administrators will not post any
material on the Facebook page that violates student’s
privacy. 2 (1.4%) 2 (1.4%) 10(6.9%) 23 (16.0%) 37(25.7%) 28(19.4%) 42(29.2%) P32- your university will not post any material on its
Facebook page that violates student’s right to privacy 1(0.7%) 3 (2.1%) 17(11.8%) 38 (26.4%) 37(25.7%) 24(16.7%) 24(16.7%) E33- It should be easy to contact the Facebook
administrator privately. 3 (2.1%) 3 (2.1%) 8(5.6%) 25 (17.4%) 43(29.9%) 27(18.8%) 35(24.3%) P33- It is easy to contact your university Facebook
administrator privately. 6(4.2%) 3 (2.1%) 13(9.0%) 34 (23.6%) 39(27.1%) 28(19.4%) 21(14.6%)
Discussion
To our knowledge, this is the first study to assess the use and the service quality of university Face-book page in medical
Face-book page was poor in 59%. The present study further indicates a statistically significant difference between the means of student’ expectations and their perceptions in almost all dimensions (P =0.000), so that students’ expectations exceed the actual quality provided for service recipients. According to the study results, the highest gap between students’ perceptions and expectations was observed in the functionality and reliability dimensions. In terms of Functionality /Design dimension, the appearance of the university Face-book page scored the highest gap between students’ perceptions and expectations, while updating the Face-book page, responding to queries and answering the queries in a prompt and professional manner showed the highest gap between students’ perceptions and expectations in Reliability dimension. Our findings showed that 40% of students believed that, information provided on the university Face-book page does not build confidence in their university and around half of them (55.5%) identified that, main Face-book page of their university does not provide all the necessary information. Similar to our study, some researchers declared that YouTube platform can mislead the users, as the available information is not well regulated [12]. Moreover, no significance association was found between Twitter engagement and exam performance of undergraduate medical students [13]. However, these results are not supported by the finding from the other studies, where the use of the face-book found to be good and beneficial channel for online educational community and interaction between students and their teachers [14, 15]. The present study showed also, that around third of the students (31.3%) believed that their university doesn’t protect the Face-book user’s right to privacy. Similarly, this is consistent with the finding from the previous study [16]. The results of this study warrant the importance of implementation of service quality assessment program of the university face-book page in medical education to determine current gaps, to meet the students’ expectation and to to achieve the highest level of quality. Moreover, these results emphasize the significant roles played by the policy makers and managers in addressing the difference between the students’ perceptions and expectations towards university face-book page and in determining suitable levels of service delivery based on the highest score shown by the ‘ERVQUAL’ tool.
Conclusion
The negative gap between students’ perceptions and expectations in all dimensions of quality, indicates that the actual service is less than what was expected and shows that quality improvement is necessary in all dimensions.
References
1. Qiuzhen, W., Jing, X., & Jun, L. Group purchase: A win-win combination of social networking services with e-commerce typical representative—Nuomi. com. Paper
presented at the Information Science and Engineering (ICISE), 2010 2nd International Conference on, 2010. 2. Pimmer, C., Linxen, S., and Gröhbiel, U. “Facebook as a
learning tool? A case study on the appropriation of social network sites from mobile phones in developing countries, “British Journal of Educational Technology. 2012; (43:5), pp. 726-738.
3. Otto, J., Sanford, D. A., and Ross, D.N. “Does
ratemyprofessor.com really rate my professor?” Assessment & Evaluation in Higher Education.2008; (33:4), pp.355-368.
4. Bennett, S., Bishop, A., Dalgarno, B., Waycott, J., and Kennedy, G. “Implementing Web 2.0 technologies in higher education: a collective case study,” Computers & Education. 2012; (59:5), pp.524-534.
5. Wankel, C. “Management education using social media,” Organization Management Journal. 2009; (6:4), pp. 251-262.
6. Dabbagh, N., and Kitsantas, A. “Personal Learning Environments, social media, and self-regulated learning: a natural formula for connecting formal and informal learning,” Internet and Higher Education. 2012; (15:1), pp. 3-8.
7. McCorkle, D. E., and McCorkle, Y. L. “Using LinkedIn in the marketing classroom: exploratory insights and recommendations for teaching social media/networking,” Marketing Educational Review. 2012; (22:2), pp.157-166. 8. Tyagi, S. “Adoption of Web 2.0 technology in higher
education: a case study of universities in National Capital Region, India,” International Journal of Education and Development using Information and Communication Technology. 2012; (8:2), pp. 28-43.
9. K. Silius, T. Miilumäki, J. Huhtamäki, T. Tebest, J. Meriläinen and S. Pohjolainen, “Students’ Motivations for Social Media Enhanced Studying and Learning,” in Knowledge Management & E-Learning: An International Journal (KM&EL), the Special Issue on “Technology Enhanced Learning”, vol. 2, March 2010.
10. K. Silius and A.-M. Tervakari, “Variety of quality experiences on web- based courses,” in Proc. 7th IEEE International Conference on Advanced Learning Technologies, ICALT. Niigata, Japan, July 2007, J. M. Spector, et al., Eds., 2007.
11. Parasuraman AVA, Zeithaml LL. A conceptual model of service quality and its implications for future research. J Marketing 1985 Sep; 29:41e50.
12. Pant S, Deshmukh A, Murugiah K, Kumar G, Sachdeva R, Mehta JL. Assessing the credibility of the “YouTube approach” to health information on acute myocardial infarction. Clin Cardiol. 2012;35(5):281–285.
14. Thalluri J, Penman J. Social media for learning and teaching undergraduate sciences: good practice guidelines from intervention. Electron J e-Learn. 2015;13(6):455–465. 15. Whittaker AL, Howarth GS, Lymn KA. Evaluation of
Facebook© to create an online learning community in an undergraduate animal science class. Educ Media Int. 2014;51(2):135–145.