O R I G I N A L R E S E A R C H
Open Access
The association of tumor-to-background ratios
and SUVmax deviations related to point spread
function and time-of-flight F18-FDG-PET/CT
reconstruction in colorectal liver metastases
Julian MM Rogasch
1*†, Ingo G Steffen
1†, Frank Hofheinz
2, Oliver S Großer
1, Christian Furth
1, Konrad Mohnike
1,
Peter Hass
3, Mathias Walke
3, Ivayla Apostolova
1and Holger Amthauer
1Abstract
Background:The maximum standardized uptake value (SUVmax) is a common clinical parameter for quantification in F18-fluorodeoxyglucose positron emission tomography/computed tomography (FDG-PET/CT), but it is influenced by image reconstruction. The aim of this study was to analyze the association of SUVmax deviations related to point spread function (PSF) and time-of-flight (TOF) reconstruction with tumor-to-background ratios (TBR) in colorectal liver metastases (CRLM).
Methods:Fifteen patients (f, 6; m, 9; median age, 59 years; range, 32 to 72 years) with 28 liver metastases were included retrospectively. FDG-PET/CT imaging (median activity, 237 MBq; range, 231 to 252 MBq; median uptake, 61 min; range, 55 to 67 min) was performed on a Siemens Biograph mCT 64 followed by image reconstruction using 3D-ordered subset expectation maximization (3D-OSEM) or 3D-OSEM with PSF modeling - both with and without TOF information. Differences in SUVmax were analyzed using the Friedman test and Wilcoxon test for paired non-parametric data. The correlation of inter-method differences with the lesions’TBR was studied using Spearman’s rank correlation coefficient (rho). Differences between lesions with low (<4.8) and high (>4.8) TBR were analyzed using the Mann-WhitneyUtest (TBR measured with 3D-OSEM; binarized by its median).
Results:There was a significant correlation of the lesions’TBR with relative SUVmax differences related to PSF (PSF + TOF vs. 3D-OSEM + TOF, rho = 0.61; PSF vs. 3D-OSEM, rho = 0.52) or TOF (PSF + TOF vs. PSF, rho =−0.58; 3D-OSEM + TOF vs. 3D-OSEM, rho =−0.61). Accordingly, PSF algorithms only showed higher SUVmax than non-PSF algorithms in lesions with a high TBR (median differences at low/high TBR, +2.6%/+9.1% [PSF + TOF vs. 3D-OSEM + TOF]; +0.7%/+6.4% [PSF vs. 3D-OSEM]). TOF integration also led to higher SUVmax but mainly at low TBR (low/high TBR, +10.4%/+1.8% [PSF + TOF vs. PSF]; +8.6%/−0.1% [3D-OSEM + TOF vs. 3D-OSEM]).
Conclusions:Both PSF and TOF reconstruction resulted in a substantial alteration of SUVmax in CRLM. TOF provided the highest SUVmax increase in low-contrast lesions while - vice versa - PSF showed the most relevant increase in high-contrast lesions. Thus, one should be aware that quantitative analyses of lesions with varying TBR, e.g., in radiotherapy or follow-up studies, may be mainly affected by either PSF or TOF reconstruction, respectively.
Keywords:F18-FDG-PET/CT; SUVmax; Reconstruction algorithm; PSF; TOF; Tumor-to-background ratio; Colorectal liver metastases; Target volume definition
* Correspondence:[email protected]
†Equal contributors
1Klinik für Radiologie und Nuklearmedizin, Universitätsklinikum Magdeburg A.ö.R.,
Otto-von-Guericke Universität Magdeburg, Leipziger Straße 44, Magdeburg 39120, Germany
Full list of author information is available at the end of the article
Background
Combined F18-fluorodeoxyglucose positron emission
tomography/computed tomography (FDG-PET/CT) has proven its significant impact on the therapeutic manage-ment in patients with colorectal liver metastases (CRLM) when compared to conventional imaging methods, such as CT or magnetic resonance imaging (MRI) [1-4]. More-over, the maximum standardized uptake value (SUVmax) as a common quantitative measure of the focal FDG up-take may be helpful for therapy response assessment [5] or as a basis for target volume definition in radiotherapy planning [6,7].
However, FDG-PET quantification is influenced by the reconstruction algorithm used [8,9]. Recent algorithms feature iterative calculations with integration of time-of-flight (TOF) analysis (to approximate the real location of the positron-electron annihilation) and the point spread functions (PSF) of the PET scanner to account for its specific detection properties. Prieto et al. [10] and Knäusl et al. [11,12] reported higher SUV and smaller metabolic tumor volumes (MTV) when applying these algorithms compared to common ordered subset expect-ation maximizexpect-ation (OSEM) algorithms. Accordingly, they should be used with caution for the purpose of quantification. Although a reliable reference value is missing in clinical lesions, the assumed SUVmax over-estimation by PSF-based algorithms could result in a dis-torted assessment of therapy response or inaccurate volume definition.
In a recent publication, we showed based on phantom measurements that the mentioned inter-method differ-ences depend on the respective signal-to-background ratio (SBR) and are nearly absent at low SBR which are typical for hepatic lesions [13]. Furthermore, an independent evaluation of TOF-related effects on quantification in liver lesions has not been performed so far. Thus, the aim of the present study was to evaluate the influence of PSF and TOF reconstruction and tumor-to-background ratios (TBR) on SUVmax in patients with CRLM.
Methods
Patients
This retrospective, explorative single-center study in-cluded 15 patients [female, n= 6; male, n= 9; median age, 59 years (range, 32 to 72 years)] which had been re-ferred for FDG-PET/CT in our department to evaluate potential palliative treatment options including systemic chemotherapy and/or local ablative therapy. All patients suffered from FDG-avid liver metastases from colorectal cancer (rectal cancer,n= 9; colon cancer, n= 6), and all patients had undergone at least one line of systemic chemotherapy (median, two lines; range, one to five lines). Written informed consent of the patients was ob-tained for the publication of this report and any
accompanying images. This analysis was performed in compliance with the Helsinki Declaration and approved by the ethics commission of the Otto-von-Guericke University Magdeburg (ID number: RAD196).
PET/CT
PET/CT imaging was performed using the tracer F18-FDG and a dedicated PET/CT device (Biograph mCT 64®; Siemens Healthcare, Erlangen, Germany) according to procedure guidelines for tumor PET imaging by the European Association of Nuclear Medicine [14]. Whole-body imaging was performed from the vertex to the proximal femora within six to eight bed positions (emis-sion, 3 min each) and axial bed coverage of 216 mm each (Siemens TrueV®; bed overlap, 89 mm). A median activity of 237 MBq (range, 231 to 252 MBq) was ap-plied intravenously with a median uptake time of 61 min (range, 55 to 67 min). A low-dose CT was used for at-tenuation correction and anatomical mapping (50 mA, 120 kV, 0.5 s/rotation; pitch, 0.8).
Image reconstruction
FDG-PET raw data were reconstructed with four algo-rithms and respective presets provided by the manufac-turer: 3D-ordered subset expectation maximization (3D-OSEM; iterations, 2; subsets, 24), 3D-OSEM + time-of-flight analysis (3D-OSEM + TOF; iterations, 2; subsets, 21), iterative reconstruction with system-specific PSF modeling (PSF; Siemens TrueX®,‘HD∙PET’; iterations, 2; subsets, 24), and PSF + TOF (Siemens
‘ultraHD∙PET’; iterations, 2; subsets, 21) [15]. The pro-jection data were reconstructed with 3-mm slice thickness (rows, 200; columns, 200; voxel size, 4.1 × 4.1 × 3.0 mm). After reconstruction, a Gaussian filter (FWHM, 2 mm) was applied to all data. Attenuation correction CT raw data were reconstructed with a slice thickness of 3 mm and a filter for abdominal low-dose CT (convolution kernel, B30f ).
SUV and TBR
All SUV were measured using dedicated software (ROVER, version 2.1.4, ABX advanced biochemical com-pounds GmbH, Radeberg, Germany). The TBR was
de-fined as the ratio of the lesions’ SUVmax and the
SUVmean of healthy liver tissue (background) determined for each reconstruction algorithm. The background SUV-mean was measured within a spherical volume of interest (diameter, 50 mm) positioned in an area of physiological liver tissue.
Dedicated CECT and MRI
manual delineation using ROVER software. CECT or MRI was performed within 8 weeks of the FDG-PET/CT examination (median, 1 day; IQR, 0 to 14 days; range, 0 to 48 days). CECT data were acquired 70 s after intra-venous injection of 80 to 150 ml of a non-ionic iodin-ated contrast agent (Imeron 300, iomeprol 300, Bracco ALTANA Pharma GmbH, Konstanz, Germany). CT scans were performed from the apex of the lungs to the thigh (automatic tube current modulation with max-imum tube current, 230 mAs; tube voltage, 120 kV; gan-try rotation, 0.5 s). MRI of the liver was performed using a 1.5-T Philips Acheiva® (Philips, Best, The Netherlands) in enhanced T1 High Resolution Isotropic Volume Excita-tion (eTHRIVE) mode after intravenous administraExcita-tion of 0.025 mmol/kg bodyweight Gd-EOB-DTPA (Primovist®, Bayer, Leverkusen, Germany).
Statistical analysis
Data analyses were carried out using SPSS 22 (IBM Corporation, Armonk, NY, USA) and R 3.1.3 (Foundation for Statistical Computing, Vienna, Austria, 2015, http:// www.R-project.org). Due to a small sample size, non-parametric distribution of data was assumed. Descriptive parameters were expressed as median, interquartile range (IQR), and range and depicted as box plots. SUVmax dif-ferences between reconstruction algorithms were investi-gated using the Friedman test and Wilcoxon signed-rank test for paired non-parametric data. The correlation be-tween relative SUVmax differences and the lesions’ TBR was analyzed using the Spearman’s rank correlation coeffi-cient. Furthermore, a binarization of the measured TBR was performed based on its median value measured in 3D-OSEM reconstructed data (<4.8/>4.8) followed by the
Mann-Whitney Utest to compare SUVmax differences
in lesions classified by low and high TBR, respectively. Similarly, the lesion volumes were binarized by the me-dian value (9.3 ml) to compare small and large lesions. General linear models (GLM) including the TBR mea-sured in 3D-OSEM reconstructed data, the lesion vol-ume, and their interaction (TBR * lesion volume) were calculated to examine the association of both variables with the SUVmax differences. Corresponding inter-action plots based on binarized TBR and lesion volume were created. Statistical significance was assumed at a Pvalue of less than 0.05.
Results
Twenty-eight FDG-avid hepatic target lesions were ana-lyzed. The median background SUVmean was similar for all reconstruction algorithms (median SUVmean, 2.8; range, 2.0 to 4.1). The measured SUVmax and calculated TBR are summarized in Table 1. Inter-method SUVmax differences and their correlation with the TBR were assessed separately for PSF and TOF. Accordingly, the
following section provides a comparison of correspond-ing PSF and non-PSF algorithms (PSF + TOF vs. 3D-OSEM + TOF; PSF vs. 3D-3D-OSEM) or corresponding TOF and non-TOF algorithms (PSF + TOF vs. PSF; 3D-OSEM + TOF vs. 3D-3D-OSEM), respectively.
SUVmax differences between PSF and non-PSF algorithms
In lesions with low TBR (<4.8), PSF + TOF provided comparable SUVmax as 3D-OSEM + TOF (median dif-ference, +2.6%;P= 0.1). PSF featured similar SUVmax as
3D-OSEM (+0.7%; P= 0.73). In lesions with high TBR
(>4.8), PSF + TOF showed significantly higher SUVmax than 3D-OSEM + TOF (median difference, +9.1%; P< 0.01). PSF also provided higher SUVmax than 3D-OSEM (+6.4%;P< 0.01).
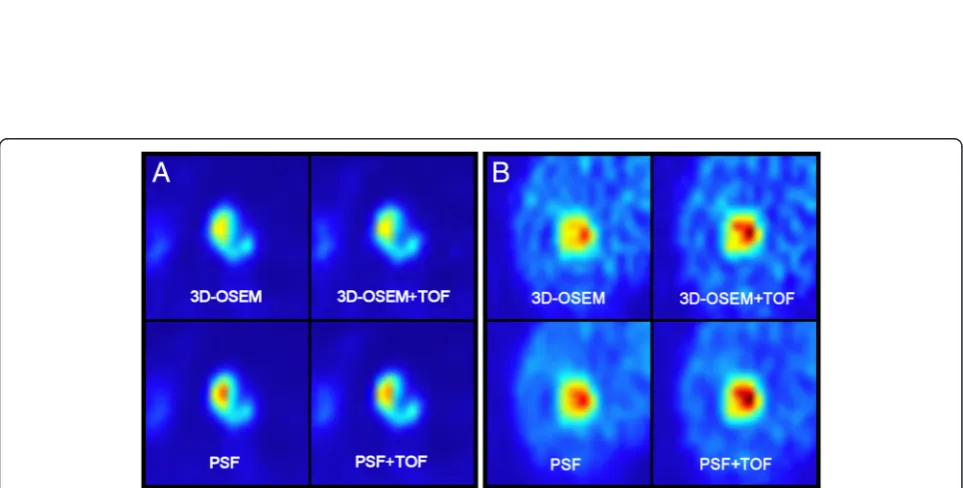
The inter-method differences for PSF + TOF vs. 3D-OSEM + TOF and PSF vs. 3D-3D-OSEM were significantly higher in high-contrast lesions compared to low-contrast lesions (Mann-Whitney U test; eachP< 0.05). All differ-ences are also displayed in Table 2, while Figure 1 displays corresponding box plots. Figure 2 provides axial PET im-ages of representative examples to illustrate the effect of the TBR on the extent of PSF-related SUVmax differences.
SUVmax differences between TOF and non-TOF algorithms
In lesions with low TBR (<4.8), PSF + TOF provided sig-nificantly higher SUVmax in comparison with PSF Table 1 SUVmax and TBR for each reconstruction
algorithm
PSF + TOF PSF 3D-OSEM + TOF 3D-OSEM
SUVmax
Median 12.2 11.0 11.6 11.1
IQR 10.5 to 17.4 9.3 to 17.2 9.9 to 16.0 9.4 to 16.8
Range 5.5 to 47.1 4.4 to 47.5 5.3 to 42.6 4.8 to 43.8
TBR
Median 5.0 4.7 4.6 4.8
IQR 3.3 to 6.3 3.2 to 6.1 3.4 to 5.8 3.1 to 5.6
Range 1.8 to 16.9 1.7 to 16.5 1.9 to 15.3 1.8 to 15.3
Median values of SUVmax and TBR displayed for all reconstruction algorithms with their respective IQR and range.
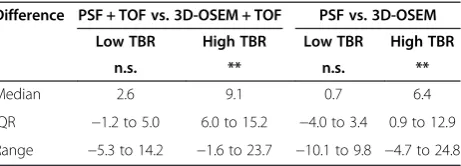
Table 2 Relative SUVmax differences - PSF vs. non-PSF
Difference PSF + TOF vs. 3D-OSEM + TOF PSF vs. 3D-OSEM
Low TBR High TBR Low TBR High TBR
n.s. ** n.s. **
Median 2.6 9.1 0.7 6.4
IQR −1.2 to 5.0 6.0 to 15.2 −4.0 to 3.4 0.9 to 12.9
Range −5.3 to 14.2 −1.6 to 23.7 −10.1 to 9.8 −4.7 to 24.8
Figure 1Relative SUVmax differences between reconstruction algorithms. Box plots of relative SUVmax differences in lesions with low TBR and high TBR. Comparison of PSF vs. non-PSF (upper row) as well as TOF vs. non-TOF algorithms (lower row). Outliers are marked as circles.
(median difference, +10.4%; P< 0.01). 3D-OSEM + TOF also featured higher SUVmax than 3D-OSEM (+8.6%;P< 0.01). In lesions with high TBR (>4.8), PSF + TOF showed comparable SUVmax in comparison with PSF (median
difference, +1.8%; P= 0.2). 3D-OSEM + TOF featured
similar SUVmax as 3D-OSEM (−0.1%;P= 0.73).
The SUVmax differences for PSF + TOF vs. PSF and 3D-OSEM + TOF vs. 3D-OSEM were significantly higher at low TBR compared to high TBR (eachP< 0.01). All dif-ferences are also displayed in Table 3. Figure 1 provides corresponding box plots and Figure 2 illustrates represen-tative examples.
Correlation of relative SUVmax differences with the TBR
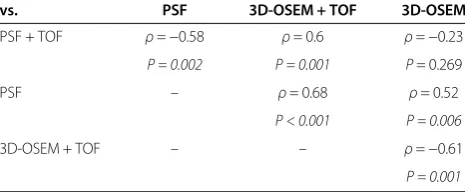
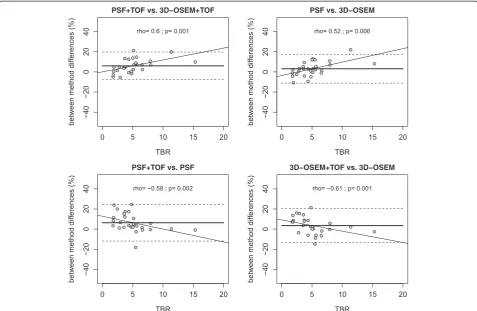
The relative SUVmax differences between PSF + TOF and 3D-OSEM + TOF were positively correlated with the lesions’ TBR measured for 3D-OSEM (ρ= 0.6; P< 0.01). Differences between PSF and 3D-OSEM also showed a significant positive correlation with the re-spective TBR (ρ= 0.52;P< 0.01).
Conversely, the relative SUVmax differences between PSF + TOF and PSF were negatively correlated with the lesions’ TBR (ρ=−0.58; P< 0.01). Differences between 3D-OSEM + TOF and 3D-OSEM featured a negative correlation (ρ=−0.61; P< 0.01) with the TBR, too (Table 4, Figure 3). There was no significant correlation of SUVmax differences between PSF + TOF and 3D-OSEM with the TBR (ρ=−0.23;P= 0.269).
Dependency of relative SUVmax differences on the lesion volume
The lesion volume measured in CECT or MRI data ranged from 0.8 to 60.3 ml (median, 9.3 ml; IQR, 2.8 to 29.3 ml). There was a significant positive correlation of the lesion volume and the TBR measured in 3D-OSEM reconstructed data (ρ= 0.56; P< 0.01). Lesions with a high TBR were significantly larger (median, 18.5 ml; IQR, 8.1 to 45.1 ml) than lesions with low TBR (median, 3.7 ml; IQR, 2.1 to 14.1 ml;P< 0.01).
There was no significant correlation between PSF-related SUVmax differences and the lesion volume (PSF + TOF vs. 3D-OSEM + TOF,ρ= 0.03; P= 0.88; PSF vs. 3D-OSEM, ρ= 0.08; P= 0.68). SUVmax differences between
TOF and non-TOF algorithms showed a significant nega-tive correlation with the lesion volume (PSF + TOF vs. PSF, ρ=−0.5; P< 0.01; 3D-OSEM + TOF vs. 3D-OSEM, ρ =−0.41; P< 0.05). Neither PSF-related nor TOF-related SUVmax differences varied significantly between small and large lesions (eachP> 0.05).
The GLM showed a significant association of SUVmax differences between PSF and non-PSF algorithms with
the TBR (PSF + TOF vs. 3D-OSEM + TOF, P< 0.001;
PSF vs. 3D-OSEM, P< 0.001) but not with the lesion
volume (both P= 0.91). The interaction between the
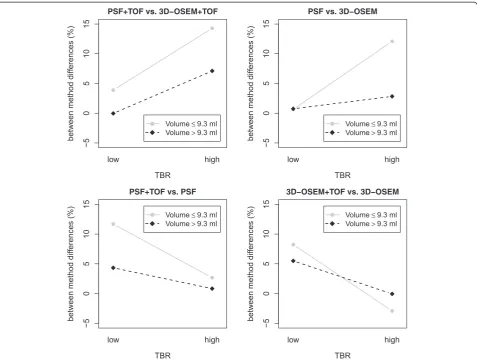
TBR and lesion volume was significant (both P< 0.05; Figure 4). TOF-related SUVmax differences were associ-ated with the TBR (PSF + TOF vs. PSF, P< 0.05) or showed a tendency towards an association (3D-OSEM + TOF vs. 3D-OSEM, P= 0.054). There was no significant association with the lesion volume (P= 0.2 andP= 0.18). The interaction between TBR and lesion volume was also not significant (bothP> 0.15; Figure 4).
Discussion
The present study focused on SUVmax in patients with CRLM, examining the influence of PSF and TOF recon-struction algorithms as well as different TBR.
The integration of PSF and TOF into reconstruction revealed relevant impact on SUVmax when lesions were separated by their TBR (low, <4.8; high, >4.8) measured in 3D-OSEM reconstructed data. In lesions with a high TBR, both PSF + TOF and PSF showed significantly higher SUVmax compared to the corresponding non-PSF algorithms. The median relative differences were slightly higher for combined PSF + TOF (PSF + TOF vs. 3D-OSEM + TOF, +9.1%) than for PSF alone (PSF vs. 3D-OSEM, +6.4%). Of course, these results are, strictly speaking, only valid for the specific scanner and recon-struction software used in this study, but it can be ex-pected that with other systems, similar SUV deviations would occur.
Knäusl et al. evaluated nine lung lesions regarding SUVmax based on PSF (also Siemens TrueX® algorithm) and OSEM reconstruction and reported even higher Table 3 Relative SUVmax differences - TOF vs. non-TOF
Difference PSF + TOF vs. PSF 3D-OSEM + TOF vs. 3D-OSEM
Low TBR High TBR Low TBR High TBR
** n.s. ** n.s.
Median 10.4 1.8 8.6 −0.1
IQR 3.1 to 19.0 −0.8 to 5.5 3.3 to 14.8 −6.0 to 2.4
Range 1.0 to 27.2 −16.7 to 27.9 −5.9 to 17.5 −13.9 to 24.0
Median, IQR, and range of relative SUVmax differences between TOF and non-TOF algorithms displayed separately for low (<4.8) and high (>4.8) TBR. Wilcoxon test: n.s., not significant; **P< 0.01.
Table 4 Correlation between relative SUVmax differences and the TBR
vs. PSF 3D-OSEM + TOF 3D-OSEM
PSF + TOF ρ=−0.58 ρ= 0.6 ρ=−0.23
P = 0.002 P = 0.001 P= 0.269
PSF – ρ= 0.68 ρ= 0.52
P < 0.001 P = 0.006
3D-OSEM + TOF – – ρ=−0.61
P = 0.001
differences of 19% on average [12]. This may be due to typically higher TBR in pulmonary lesions with pro-nounced SUV differences and due to an increased noise level caused by the higher product of iterations and sub-sets used by Knäusl et al. (4 iterations, 21 subsub-sets). Akamatsu et al. analyzed 41 lymph node metastases and observed SUVmax differences of about +40% between PSF + TOF and OSEM + TOF as well as between PSF and OSEM. Again, differences increased with an increas-ing number of iterations [16].
However, the observed inter-method differences re-lated to PSF were significantly correre-lated with the le-sions’TBR and were significantly lower in lesions with a low TBR. A recent study on FDG-PET phantom mea-surements analyzed radial activity concentration profiles of spheres filled with a solution of F18-FDG at three dif-ferent SBR. It demonstrated that signal elevations at the spheres’ boundaries (known as Gibbs artifacts [17]) oc-curred only in PSF + TOF and PSF and only at medium (6:1) and high (16:1) SBR. In analogy to the current re-sults, this led to an artificially increased SBR and to the observed deviations in quantitative parameters [13].
The integration of TOF analysis resulted in SUVmax differences comparable to those observed for additional PSF (PSF + TOF vs. PSF, +10.4%; 3D-OSEM + TOF vs. 3D-OSEM, +8.6%). However, these deviations were mea-sured in lesions with a low TBR while SUV in high-contrast lesions were significantly less affected by TOF. These inverse findings of PSF and TOF may explain why no correlation was observed for differences between combined PSF + TOF and 3D-OSEM (PSF, non-TOF) and the TBR. In other words, PSF + TOF increased SUVmax across the entire range of the TBR when com-pared to 3D-OSEM (correlation plot not shown). As a consequence, a differentiated assessment of PSF + TOF and PSF with regard to varying TBR is required. There are scarce data on the independent influence of TOF analysis on SUV in clinical lesions. In the abovemen-tioned study, Akamatsu et al. reported SUVmax differ-ences of only +2% between PSF + TOF and PSF as well as between OSEM + TOF and OSEM, probably due to relatively high TBR of the analyzed lesions. Nevertheless, a TOF-related SUVmax increase was mainly observed in lesions with low SUVmax [16]. Schaefferkoetter et al.
assessed the signal-to-noise ratios (SNR) of FDG-avid foci which were artificially added to FDG-PET scans of 23 patients. The authors reported increasing SNR of OSEM + TOF, PSF, and PSF + TOF compared to OSEM. In analogy to the current results, the relative SNR gain of OSEM + TOF vs. OSEM was higher in lesions with lower count rate (20,000 vs. 60,000 counts) [18]. Taniguchi et al. performed phantom measurements (lesion diameter, 10 to 37 mm) and clinical studies in hepatic lesions (aver-age diameter, 10.7 mm) to analyze the influence of PSF and TOF on lesion contrast, coefficient of variation (CV) of the background activity, as well as lesion SNR. Both PSF and TOF independently increased liver lesion SNR with the best tradeoff between lesion contrast and CV for combined PSF + TOF. Furthermore, PSF + TOF reduced the CV of the liver in overweight patients (>70 kg) to the CV level in OSEM reconstructed data of normal-weight pa-tients (<70 kg) [19]. That such differences in quantitative
measures can also result in improved lesion detection was shown by El Fakhri et al. who analyzed the influence of TOF integration on detection rates in simulated liver and lung lesions. TOF improved lesion detection over non-TOF PET in both hepatic and pulmonary lesions but showed the greatest advantage at low contrast (contrast, 2.0:1 vs. 5.7:1) and in patients with higher body mass index (BMI; >30 vs. <30) [20].
It is well known that the TBR is affected by the lesion size due to partial volume effects which are more pro-nounced in smaller lesions [21,22]. As we observed such a positive correlation between the lesion volume and the TBR, we included the TBR, the lesion volume, and their interaction into GLMs. For PSF integration, the GLM showed no association between SUVmax differences and the lesion size whereas a highly significant association with the TBR was observed. In addition, there was a sig-nificant interaction between the TBR and the lesion
volume, indicating that the effect of the TBR on PSF-related SUVmax differences depends on the lesion vol-ume. Thus, we observed an increased impact of the TBR in smaller lesions. Also, in TOF integration, the SUV-max differences showed a significant association with the TBR (PSF + TOF vs. PSF) or a tendency towards an association (3D-OSEM + TOF vs. 3D-OSEM). In com-parison to PSF, a similar effect of the lesion volume can be observed in the interaction plots. However, in GLM, the interaction term showed no significance which may be caused by a high variance of SUVmax differences in combination with a small sample size. This dependency of TOF-related effects on the lesion volume is in agree-ment with previous studies showing that the impact of TOF is especially relevant in small lesions [23,24].
SUVmax are commonly used for threshold-dependent volume definition in a clinical setting. If the delineation is strictly based on SUVmax (i.e., relative threshold with-out background correction), these differences would also implicate corresponding MTV deviations as reported previously [12]. However, we refrained from volumetric analyses as such delineation methods may not reflect the clinical practice where more sophisticated algorithms with background correction or manual MTV delineation are required - especially in hepatic lesions [14,25,26]. Thus, the actual MTV deviations may be lower and less dependent on the TBR than the current results on SUV-max deviations suggest.
Nevertheless, these results underline that quantitative analyses in radiotherapy planning, follow-up, or multi-center studies can be distorted not only by different re-construction settings but also when comparing lesions located in different organs (e.g., lung and liver) or one lesion with varying TBR measured over the course of time. Depending on the lesions’TBR, one must be aware of SUVmax deviations mainly caused by PSF or TOF, re-spectively. This may be particularly true for hepatic lesions that feature a range of TBR in which both PSF-and TOF-related effects are relevant.
The present study is limited by the retrospective inclu-sion of only 15 patients with 28 leinclu-sions which may im-pair an accurate interpretation of the data that were characterized by relatively large IQRs.
Conclusions
Both PSF and TOF integration independently resulted in substantially increased SUVmax in CRLM. However, PSF- and TOF-related deviations showed an inverse cor-relation with the lesions’ TBR. TOF showed the highest SUVmax deviations in low-contrast lesions, whereas PSF revealed a substantial effect on SUVmax in high-contrast lesions. Although an interaction between the TBR and le-sion volume was observed, these effects were still present after adjustment for the lesion volume. Thus, quantitative
analyses in radiotherapy planning, follow-up, or multicen-ter studies can be distorted when comparing lesions lo-cated in different organs or one lesion with varying TBR measured over the course of time.
Competing interests
HA received a research grant from Siemens Healthcare Diagnostics GmbH, Germany. All other authors declare that they have no competing interests.
Authors’contributions
JMMR, IGS, FH, and HA participated in the design of the study and in the analysis and interpretation of the data and drafted the manuscript. OSG, CF, KM, PH, MW, and IA participated in the interpretation of the data and supervised the manuscript. All authors read and approved the final version of the manuscript.
Acknowledgements
None.
Author details 1
Klinik für Radiologie und Nuklearmedizin, Universitätsklinikum Magdeburg A.ö.R., Otto-von-Guericke Universität Magdeburg, Leipziger Straße 44, Magdeburg 39120, Germany.2Helmholtz-Zentrum Dresden-Rossendorf, PET Center, Institute of Radiopharmaceutical Cancer Research, Bautzner Landstraße 400, Dresden 01328, Germany.3Klinik für Strahlentherapie, Universitätsklinikum Magdeburg A.ö.R., Otto-von-Guericke Universität Magdeburg, Leipziger Straße 44, Magdeburg 39120, Germany.
Received: 27 February 2015 Accepted: 22 April 2015
References
1. Bonanni L, De’liguori Carino N, Deshpande R, Ammori BJ, Sherlock DJ, Valle JW, et al. A comparison of diagnostic imaging modalities for colorectal liver metastases. Eur J Surg Oncol. 2014;40(5):545–50.
2. Chua SC, Groves AM, Kayani I, Menezes L, Gacinovic S, Du Y, et al. The impact of 18 F-FDG PET/CT in patients with liver metastases. Eur J Nucl Med Mol Imaging. 2007;34(12):1906–14.
3. Kong G, Jackson C, Koh DM, Lewington V, Sharma B, Brown G, et al. The use of 18 F-FDG PET/CT in colorectal liver metastases - comparison with CT and liver MRI. Eur J Nucl Med Mol Imaging. 2008;35(7):1323–9.
4. Selzner M, Hany TF, Wildbrett P, McCormack L, Kadry Z, Clavien PA. Does the novel PET/CT imaging modality impact on the treatment of patients with metastatic colorectal cancer of the liver? Ann Surg. 2004;240(6):1027–34. 5. Hendlisz A, Golfinopoulos V, Garcia C, Covas A, Emonts P, Ameye L, et al.
Serial FDG-PET/CT for early outcome prediction in patients with metastatic colorectal cancer undergoing chemotherapy. Ann Oncol. 2012;23(7):1687–93. 6. Parlak C, Topkan E, Sonmez S, Onal C, Reyhan M. CT- versus coregistered
FDG-PET/CT-based radiation therapy plans for conformal radiotherapy in colorectal liver metastases: a dosimetric comparison. Jpn J Radiol. 2012;30(8):628–34.
7. Riou O, Serrano B, Azria D, Paulmier B, Villeneuve R, Fenoglietto P, et al. Integrating respiratory-gated PET-based target volume delineation in liver SBRT planning, a pilot study. Radiat Oncol. 2014;9:127.
8. Ramos CD, Erdi YE, Gonen M, Riedel E, Yeung HW, Macapinlac HA, et al. FDG-PET standardized uptake values in normal anatomical structures using iterative reconstruction segmented attenuation correction and filtered back-projection. Eur J Nucl Med. 2001;28(2):155–64.
9. Cheebsumon P, Yaqub M, van Velden FH, Hoekstra OS, Lammertsma AA, Boellaard R. Impact of [18 F]FDG PET imaging parameters on automatic tumour delineation: need for improved tumour delineation methodology. Eur J Nucl Med Mol Imaging. 2011;38(12):2136–44.
10. Prieto E, Domínguez-Prado I, García-Velloso MJ, Peñuelas I, Richter JÁ, Martí-Climent JM. Impact of time-of-flight and point-spread-function in SUV quantification for oncological PET. Clin Nucl Med. 2013;38(2):103–9. 11. Knäusl B, Hirtl A, Dobrozemsky G, Bergmann H, Kletter K, Dudczak R, et al.
12. Knäusl B, Rausch IF, Bergmann H, Dudczak R, Hirtl A, Georg D. Influence of PET reconstruction parameters on the TrueX algorithm. A combined phantom and patient study Nuklearmedizin. 2013;52(1):28–35.
13. Rogasch JMM, Hofheinz F, Lougovski A, Furth C, Ruf J, Großer OS, et al. The influence of different signal-to-background ratios on spatial resolution and F18-FDG-PET quantification using point spread function and time-of-flight reconstruction. EJNMMI Physics. 2014;1:12.
14. Boellaard R, O’Doherty MJ, Weber WA, Mottaghy FM, Lonsdale MN, Stroobants SG, et al. FDG PET and PET/CT: EANM procedure guidelines for tumour PET imaging: version 1.0. Eur J Nucl Med Mol Imaging. 2010;37(1):181–200.
15. Panin VY, Kehren F, Michel C, Casey M. Fully 3-D PET reconstruction with system matrix derived from point source measurements. IEEE Trans Med Imaging. 2006;25(7):907–21.
16. Akamatsu G, Mitsumoto K, Taniguchi T, Tsutsui Y, Baba S, Sasaki M. Influences of point-spread function and time-of-flight reconstructions on standardized uptake value of lymph node metastases in FDG-PET. Eur J Radiol. 2014;83(1):226–30.
17. Rahmim A, Qi J, Sossi V. Resolution modeling in PET imaging: theory, practice, benefits, and pitfalls. Med Phys. 2013;40(6):064301.
18. Schaefferkoetter J, Casey M, Townsend D, El Fakhri G. Clinical impact of time-of-flight and point response modeling in PET reconstructions: a lesion detection study. Phys Med Biol. 2013;58(5):1465–78.
19. Taniguchi T, Akamatsu G, Kasahara Y, Mitsumoto K, Baba S, Tsutsui Y, et al. Improvement in PET/CT image quality in overweight patients with PSF and TOF. Ann Nucl Med. 2015;29(1):71–7.
20. El Fakhri G, Surti S, Trott CM, Scheuermann J, Karp JS. Improvement in lesion detection with whole-body oncologic time-of-flight PET. J Nucl Med. 2011;52(3):347–53.
21. Vesselle H, Schmidt RA, Pugsley JM, Li M, Kohlmyer SG, Vallires E, et al. Lung cancer proliferation correlates with [F-18]fluorodeoxyglucose uptake by positron emission tomography. Clin Cancer Res. 2000;6(10):3837–44. 22. Hallett WA, Marsden PK, Cronin BF, O’Doherty MJ. Effect of corrections for
blood glucose and body size on [18 F]FDG PET standardised uptake values in lung cancer. Eur J Nucl Med. 2001;28(7):919–22.
23. Murray I, Kalemis A, Glennon J, Hasan S, Quraishi S, Beyer T, et al. Time-of-flight PET/CT using low-activity protocols: potential implications for cancer therapy monitoring. Eur J Nucl Med Mol Imaging. 2010;37(9):1643–53.
24. Surti S, Kuhn A, Werner ME, Perkins AE, Kolthammer J, Karp JS. Performance of Philips Gemini TF PET/CT scanner with special consideration for its time-of-flight imaging capabilities. J Nucl Med. 2007;48(3):471–80. 25. Bundschuh RA, Andratschke N, Dinges J, Duma MN, Astner ST, Brügel M,
et al. Respiratory gated [18 F]FDG PET/CT for target volume delineation in stereotactic radiation treatment of liver metastases. Strahlenther Onkol. 2012;188(7):592–8.
26. Nestle U, Kremp S, Schaefer-Schuler A, Sebastian-Welsch C, Hellwig D, Rübe C, et al. Comparison of different methods for delineation of 18 F-FDG PET-positive tissue for target volume definition in radiotherapy of patients with non-small cell lung cancer. J Nucl Med. 2005;46(8):1342–8.
Submit your manuscript to a
journal and benefi t from:
7Convenient online submission 7Rigorous peer review
7Immediate publication on acceptance 7Open access: articles freely available online 7High visibility within the fi eld
7Retaining the copyright to your article