Is there a brainstem generator
of chronic daily headache?
V. Nagesh () •S.K. Aurora N. Gelman • S. Gopal NMR/Neurology Research, E & R Basement,
Department of Neurology, Henry Ford Hospital, 2799 West Grand Boulevard, Detroit, MI 48202-2689, USA E-mail: [email protected] Tel.: +1-313-916-2620
Fax: +1-313-916-1324 M. Welch
University of Kansas Medical Center, Kansas City, Kansas, USA
Vijaya Nagesh
Michael Welch
Sheena K. Aurora
Neil Gelman
Shanthi Gopal
Abstract Using BOLD-fMRI we
have previously documented
activa-tion of the red nucleus (RN) and
sub-stantia nigra (SN) during
sponta-neously and visually activated
migraine headaches. These
observa-tions prompted us to study brainstem
function in chronic daily headache
patients using high-resolution
mag-netic resonance imaging (MRI)
techniques. Seventeen chronic daily
headache (CDH) patients, ten
episodic migraine (EM) patients and
fifteen controls (N) were imaged
with a 3 tesla MRI system. For
each subject, the relaxation rates
R2, R2* and R2' were obtained for
RN and SN. There was a significant
decrease in R2' and R2* values for
RN and SN in CDH compared to N
and EM groups (
p
< 0.05), but no
significant difference between the N
and EM groups. A decrease in R2'
and R2
*indicates reduced
deoxyhe-moglobin and hence persistent
acti-vation of the RN and SN in CDH
patients most likely secondary to
ongoing headache at the time of
study. The imaging data provide
objective evidence of disturbed
cen-tral nervous system function in
CDH.
Key words Chronic daily headache
•Migraine
•Magnetic resonance
imag-ing
•Red nucleus
•Substantia nigra
•Image processing
Introduction
The mechanisms of chronic or persistent daily headache
(CDH) that evolves from episodic migraine remain to be
determined and have been studied rarely. During episodic
migraine, activation occurs in brainstem structures involved
in nociception [1–4]. For example, in positron emission
tomography (PET) studies during spontaneous migraine
without aura, increased blood flow was measured in
mesen-cephalic regions that possibly reflected dorsal raphe nuclei
(DRN), periaqueductal gray matter (PAG) and locus
ceruleus (LC) activation [5]. Using blood oxygen level
dependent (BOLD) functional magnetic resonance imaging
(fMRI) we have recently observed activation of the red
nucleus (RN) and substantia nigra (SN) during spontaneous
Subjects and methods
Three groups of subjects were imaged (Table 1). The institutional review board of Henry Ford Health Sciences Center approved the imaging protocol. All subjects who participated in this study pro-vided written informed consent prior to the study. The first group comprised 17 patients diagnosed with chronic daily headache (CDH) preceded by episodic migraine without aura attacks; there were 3 men and 14 women aged 22-57 years (mean age ± SD, 38 ± 11 years). In the second group 10 patients with episodic migraine without aura (EM), 2 males and 8 females aged 23-53 years (mean age ± SD, 36 ± 10 years) were imaged. The third group studied consisted of 15 healthy normal adults (N), 5 men and 10 women aged 20-64 years (mean age ± SD, 38 ± 12 years). The difference in the mean age of the three groups was not statistically significant (p= 0.83, repeated measure ANOVA, Table 1) nor were the gender differences (p= 0.55). International Headache Society (IHS) clas-sification guidelines [8] were used to evaluate and diagnose CDH and EM patients. No migrainous feature was present in any of the EM patients at MRI.
Imaging techniques
All MR images were acquired with a 3 tesla, 80-cm (inner diame-ter) magnet (Magnex Scientific, Abingdon, England) with a maxi-mum gradient strength of 18 mT/m and 250 µs ramp time. A quad-rature birdcage head coil was used for imaging. Spin-echo sagittal images were obtained to align the imaging plane so that it was par-allel to the plane encompassing both the inferior colliculus and mammillary body.
Multislice measurements of R2, R2' and R2* were performed in a single acquisition using the gradient-echo sampling of free induction decay and echo (GESFIDE) sequence [9]. The timing of the echoes in this sequence was identical to that used previously [10]. Briefly, two slice-selective 90º and 180º radiofrequency (RF) pulses were used in this sequence. Five gradient echoes were acquired between the 90º and 180º RF pulses, followed by acqui-sition of six echoes after the 180º pulse. The final (eleventh) echo produced a spin-echo at 98 ms. Twenty-four thin contiguous 2.2-mm slices from the ponto-medullary border to slightly above the superior border of the putamen were obtained within 10.7 min. A 128x128 imaging matrix with a 220-mm field of view, and 2500
ms repetition time was used for image acquisition. Even and odd slices were obtained in separate scans to avoid interference from adjacent slices. The imaging time of the entire protocol, inclusive of positioning and shimming was approximately 20 min.
Image analysis
The image sets were Fourier transformed and zero-filled to yield 256x256 in-plane images for each of the 264 two-dimensional images (24 slices x 11 echoes). Maps of R2, R2' and R2* were obtained as described in a previous study [9]. The procedure involved construction of R2* maps from the first 5 echoes and R2 -(= R2–R2') maps from the last six echoes of the GESFIDE sequence [10]. Further, the R2* and R2- maps were converted to R2 and R2' maps using the following expressions:
R2 = (R2*+ R2-)/2 R2' = (R2*- R2-)/2
Brain tissue segmentation was performed using the iterative self-organizing data analysis technique clustering technique (ISO-DATA) [11]. ISODATA is a semi-automated algorithm based on techniques of multivariate statistical analysis. The algorithm is based on the Euclidean measures of pattern similarity. A vector fea-ture is constructed at each spatial location from the set of input data. The clusters are determined in such a way that the intra-set distance in each cluster is kept to a minimum, and the inter-set dis-tance between two clusters is made as large as possible. The num-ber of source images determines the dimension of the Euclidean (feature) space in which the clustering is carried out. To potential-ly improve tissue specificity, qualitativepotential-ly different images are used to increase the likelihood of separating two tissues with sim-ilar signature profiles.
For each subject, all image slices reconstructed from the final echo (TE/TR = 98/2500 ms) of the GESFIDE sequence were reviewed visually to identify and localize slices containing the peri-aqueductal gray matter (PAG), red nucleus (RN), and substantia nigra (SN). The PAG, RN and SN were visible in two or more slices for all cases reported in this study. ISODATA segmentation was used to accurately delineate and identify the entire volume of the RN and SN. Eleven images (one from each echo of GESFIDE sequence) were used as source images for the ISODATA segmentation of each slice. This technique ensured that anatomic borders were not crossed. An operator classified the resulting zones into gray matter, white matter, cerebrospinal fluid (CSF), PAG, RN and SN. For each subject, the R2 (1/T2), R2* (1/ T2*) and R2' (1/T2*–1/T2) relax-ation rates of the RN, SN and PAG were obtained for the left and right hemispheres separately by projecting the corresponding seg-mented zones onto the maps. Measurements derived from multiple slices for each subject were expressed as a weighted average.
Statistical analysis
The relaxation rates, R2, R2' and R2* of RN and SN for each sub-ject are presented as mean ± SD. One way analysis of variance (ANOVA) was used to test the null hypothesis of equality of pop-ulation means among the three groups. The significance level was set at p< 0.05. Student’s paired ttest was used to compare the relaxation rates for the right versus left hemispheres.
Table 1 Demographics of control (N) subjects, patients with chronic daily headache (CDH) and patients with episodic migraine (EM) studied with MRI to measure transverse relaxation rates of brainstem structures. The difference in the mean age of the three groups studied was not statistically significant (p= 0.89, repeated measure ANOVA)
N CDH EM
(n = 15) (n = 17) (n = 10)
Mean age ± SD, years 38±12 38±11 36±10
Age range, years 20–64 22–57 23–53
Females, n 10 14 8
Results
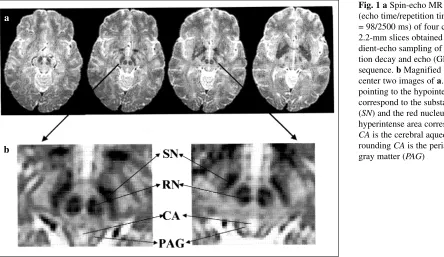
Representative images containing the PAG, RN or SN of
one subject are shown in Fig. 1. The RN and SN are
read-ily identified as hypointense regions and the PAG is
adja-cent to the cerebral aqueduct (hyperintense area).
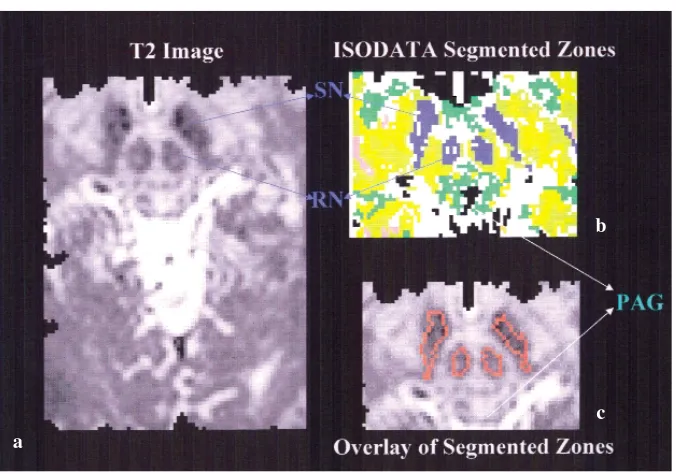
ISODA-TA segmentation and classification of the different zones
are illustrated in Fig. 2. Representative maps of R2, R2'
and R2* for a section through the midbrain are shown in
Fig. 3. The mean ± SD of R2, R2' and R2* obtained for the
RN and SN of the left and right hemispheres for the N,
CDH and EM groups are presented in Table 2.
There was a significant decrease in R2' and R2*
val-ues of the RN and SN of CDH patients compared to N and
EM groups (
p
< 0.05), but there was no significant
differ-ence in the relaxation rates of either the SN or RN
between the N and EM groups. The R2 values among the
three groups in both the RN and SN were not
significant-ly different. Similar results were observed for both left
and right hemispheres. In addition, no intragroup
hemi-spheric differences were noted in the relaxation rates of
either the RN or SN using Student’s paired
t
test. Results
from the PAG analysis form the subject of a separate
com-munication.
Table 2 The transverse relaxation rates R2, R2' and R2* of the red nucleus (RN) and substantia nigra (SN), expressed as mean ± standard deviation for control (N), chronic daily headache (CDH) and episodic migraine (EM) groups. Differences in the relaxation rates among the three groups were tested using one way analysis of variance (ANOVA), with significance level set at p< 0.05. There is a significant decrease in the R2' and R2* values of RN and SN of CDH patients compared to the N and EM groups.
Red nucleus Substantia nigra
Relaxation
rate (1/ms) N CDH EM N CDH EM
R2-Right 24.67 ± 1.69 23.75 ± 1.91 24.34 ± 1.55 27.06 ± 2.29 26.33 ± 2.66 28.25 ± 2.07 R2-Left 24.90 ± 1.82 23.48 ± 1.92 25.58 ± 1.65 26.20 ± 2.24 25.74 ± 2.62 27.60 ± 2.19 R2'-Right 14.93 ± 2.14 10.75 ± 2.27 13.89 ± 1.82 15.03 ± 3.31 11.30 ± 3.32 15.75 ± 3.20 R2'-Left 13.78 ± 2.20 10.69 ± 1.97 14.07 ± 1.87 14.39 ± 3.42 11.80 ± 3.30 15.82 ± 2.84 R2*-Right 39.62 ± 2.47 34.44 ± 2.85 38.46 ± 2.06 42.76 ± 3.97 35.34 ± 4.21 44.02 ± 3.80 R2*-Left 38.88 ± 2.41 34.01 ± 2.61 39.50 ± 2.35 41.33 ± 3.93 37.74 ± 3.78 43.41 ± 3.53
Fig. 1 a Spin-echo MR images (echo time/repetition time (TE/TR) = 98/2500 ms) of four contiguous 2.2-mm slices obtained with the gra-dient-echo sampling of free induc-tion decay and echo (GESFIDE) sequence. bMagnified views of the center two images of a. Arrows pointing to the hypointense areas correspond to the substantia nigra (SN) and the red nucleus (RN). The hyperintense area corresponding to
CAis the cerebral aqueduct, and sur-rounding CAis the periaqueductal gray matter (PAG)
a
Discussion
Using high-resolution MRI techniques, we have mapped
transverse relaxation rates R2, R2' and R2* in patients
with chronic daily headache and compared them to healthy
control subjects and episodic migraine patients. Increased
R2 and R2', especially the latter, is more specific to
depo-sition of non-heme iron in tissues [10]. A decrease in these
measures reflects the influence of free iron from
deoxy-hemoglobin.
There was no alteration of R2 in any of our subject
groups, providing important structural evidence of no
change in tissue water content. The decreases in R2' and
R2* of RN and SN in the CDH patient group are explained
best by flow activation and hyperoxia of these structures
associated with head pain. This is supported by unchanged
R2' and R2* in episodic migraine patients without headache.
A study of CDH patients when headache-free is needed to
evaluate if there is increased tissue iron in RN and SN. As
noted in the Introduction, activation of these brainstem
structures has been observed using fMRI-BOLD [6, 7]. The
Fig. 2 a Spin-echo T2-weighted image (TE/TR = 98/2500 ms) of the midbrain showing the red nucleus (RN) and sub-stantia nigra (SN). Eleven images, one from each echo of the GESFIDE pulse sequence were used in the computer cluster analysis (ISODATA) to segment brain tissue. b, c Results of ISODATA segmentation (b) and the segmented zones superimposed on the T2 image (enlarged view) (c). Each color of the ISODATA segmented image is repre-sentative of a different cluster with unique properties in feature space.Fig. 3 a Transverse relaxation rates, R2, R2' and R2* maps of a single 2.2-mm slice. Image reconstruction and calculation of these maps is detailed in the text. bEnlarged views of the corresponding map detailing the brainstem structures that were studied. The red nucleus (RN) and substantia nigra (SN) appear hyper-intense on the three relaxation rate maps. PAG, periaqueductal gray matter
a
b
a
b
precise reasons for activation of RN and SN in migraine
attacks remain to be established but could include both
noci-ceptive and autonomic dysfunctions.
These imaging data provide the first objective evidence
of disturbed CNS function in CDH. Although we did not
study cortical function, the absence of aura symptoms in this
condition supports the possibility of a brainstem generator
for head pain, similar to that suggested for episodic
migraine without aura [5]. Because different brain regions
were studied, firm comparative conclusions cannot be
drawn between the latter report and our own. Nevertheless,
persistent activation of other components of the brainstem
nociceptive system, such as the trigeminal nucleus, can be
inferred from both studies.
In conclusion, we have shown persistent activation of
the red nucleus and substantia nigra in migraine without
aura patients with episodic headache that over time becomes
daily and persistent. We offer this as preliminary evidence
for a brainstem generator of chronic daily headache.
AcknowledgementsThis work was supported by NIH Grant num-ber P50-NS32399.
References
1. Raskin NH, Hosobuchi Y, Lamb S (1987) Is the brain pain-insensitive? Cephalalgia 7[Suppl 6]:23–25 2. Moskowitz MA (1984) The
neurobiol-ogy of vascular head pain. Ann Neurol 16:157–168
3. Lance JW (1990) A concept of migraine and the search for the ideal headache drug. Headache 30[Suppl 1]:17–28
4. Goadsby PJ, Edvinsson L, Ekman R (1988) Release of vasoactive peptides in the extracerebral circulation of humans and the cat during activation of the trigeminovascular system. Ann Neurol 23:193–196
5. Weiller C, May A, Limmroth V, Juptner M, Kaube H, Schayk RV, Coenen HH, Diener HC (1995) Brainstem activation in spontaneous human migraine attacks. Nat Med 1:658–660
6. Welch KMA, Cao Y, Aurora SK, Wiggins G, Vikingstad EM (1998) MRI of the occipital cortex, red nucleus, and substantia nigra during visual aura of migraine. Neurology 51:1465–1469 7. Cao Y, Aurora SK, Vikingstad EM,
Patel SC, Welch KMA (1999) Functional MRI of the red nucleus and occipital cortex during visual stimula-tion of subjects with migraine. Cephalalgia 19:462 (abstract)
8. Headache Classification Committee of the International Headache Society (1988) Classification and diagnostic criteria for headache disorders, cranial neuralgias and facial pain. Cephalalgia 8 [Suppl 7]:1–96
9. Ma J, Wehrli FE (1996) Method for image-based measurement of the reversible and irreversible contribution to the transverse relaxation rate. J Magn Reson B 111:61–69 10. Gelman N, Gorell JM, Barker PB,
Savage RM, Spickler EM, Windham JP, Knight RA (1999) MR imaging of human brain at 3.0 T: preliminary report of transverse relaxation rates and relation to estimated iron content. Radiology 210:759–767