2010. Plant Management Network. This article is in the public domain. Accepted for publication 7 April 2010. Published 11 June 2010.
Evaluation of Nitrogen and Phosphorus Fertilizer
Placement with Strip Tillage for Irrigated Pacific
Northwest Corn Production
David Tarkalson and Dave Bjorneberg, USDA-ARS, Northwest Irrigation & Soils Research Lab, Kimberly, ID 83341
Corresponding author: David Tarkalson. [email protected]
Tarkalson, D., and Bjorneberg, D. 2010. Evaluation of nitrogen and phosphorus fertilizer placement with strip tillage for irrigated Pacific Northwest corn production. Online. Crop Management doi:10.1094/CM-2010-0611-01-RS.
Abstract
Nutrient placement options with strip tillage (ST) can potentially improve plant nutrient utilization and increase crop yield compared to conventional fertilizer placement practices under conventional tillage (CT). The effects of tillage practice and N and P placement on grain yield, biomass yield (whole plant, grain + cobs + stover), and N and P uptake of field corn (Zea mays L.) were assessed on four sites during 2007 and 2009 at the USDA-ARS Northwest Irrigation & Soils
Research Laboratory at Kimberly, ID. During each year, two locations (eroded and not eroded from furrow irrigation) were utilized as study locations. Band
placement (15 to 20 cm below the soil surface) of fertilizer with ST increased corn grain yield by 12.5 (689 kg/ha) and 25.9% (1,626 kg/ha) on the eroded locations compared to broadcast N and P and 5 × 5-cm N under CT in 2007 and 2009, respectively. These increased yields also resulted in greater removal of N and P. Reduced tillage costs of ST with associated band placement of N and P could increase the economic productivity of many acres of land in the Pacific Northwest.
Introduction
The use of strip tillage (ST) and other conservation tillage (CT) practices are used to conserve soil and soil water through residue management, and reduce tillage costs in many areas of the Corn Belt. However, in the Pacific Northwest these tillage practices are less common. As presented here, CT refers to any tillage practice that results in the incorporation of most crop residue from a variety of tillage implements (e.g., disc, moldboard plow, roller harrow, and chisel plow). Often multiple passes with different implements are used. Strip tillage is becoming more common in the sugarbeet industry in southern Idaho and due to the high dairy cow populations, the potential use of strip tillage in corn production is increasing. The area under strip tillage in sugarbeet production in the Amalgamated Inc. production area has increased for 0 ha in 2007 to approximately 2,800 ha in 2009. The same growers that used strip tillage in sugarbeet production utilized strip tillage in corn production in over 1,000 ha in 2009 (personal communication, Amalgamated Sugar Inc., Boise, ID) The dual use of strip tillage for sugarbeet and corn production will likely continue to develop, increasing the need for ST best management practices in this region.
Strip tillage is a practice that creates a residue free and tilled zone,
approximately 15 to 38 cm wide and 15 to 20 cm deep. The remaining portion of the field is not tilled and the residue from the previous crop remains on the soil surface. Corn production under ST has been shown to be comparable to or greater than chisel tillage (3,5,8). However, ST reduced corn yields compared to moldboard plow in southern Ontario (10).
Although ST allows for the deep banding of fertilizers, differences in
Low initial soil test P concentrations are the most common conditions in which corn grain yields increased as a result of starter fertilizer applications. Corn yield with 5 × 5 (5 cm to the side and 5 cm below the seed) placement of starter fertilizer at planting was found to be better than placement of fertilizer 5 cm below the row in the fall under zone tillage (11). Zone tillage is analogous to strip tillage (11).
The objective of this research was to evaluate corn production under ST and CT, and various N and P fertilizer placements under conditions found in the Pacific Northwest.
Assessing Effects of Tillage Practice and N and P Placement
The field study was conducted at a total of four locations over a two-year period (2007 and 2009) at the USDA-ARS Northwest Irrigation & Soils Research Lab in Kimberly, ID, on a Portneuf silt loam (coarse-silty, mixed, mesic Durixerollic Calciorthid). The fields have been furrow irrigated for 80 to 100 years and have a 1 to 2% slope. As a result most topsoil has eroded from the top areas of the fields and some has been deposited on the bottom areas of the fields. This erosion process has decreased yields on at least 800,000 ha in the Pacific Northwest (2). During each year of the study two locations were utilized, one located at the top of a field (eroded) and one located at the bottom of a field (not eroded). The two sites in 2007 still utilize furrow irrigation and the two sites in 2009 were under linear move irrigation (converted from furrow irrigation approximately 18 years ago). The study locations were previously cropped to alfalfa (Medicago sativa L.) for at least three years prior to the start of the study. In the fall before planting corn, the alfalfa was sprayed with 2,4-D herbicide at a rate of 3.5 liter/ha and glyphosate at a rate of 2.4 liter/ha.
Prior to field operations, twenty soil sub-samples were collected at depths of 0 to 30 and 30 to 60 cm across all replications of the study locations.
Subsamples from each site and depth were composited. The composited samples were air dried, ground to pass through a 2-mm sieve, and analyzed for organic matter (OM) by combusting a subsample at 400° for 16 h, CaCO percentage (8), bicarbonate extractable P and K (6), and NO -N and NH -N (4).
Treatments were a combination of ST and CT with N and P fertilizer applied either broadcast prior to the final tillage operation (broadcast), placed 5 cm to side and 5 cm below seed at planting (5 × 5), or placed 15 to 20 cm below the soil surface directly below the seed during ST (band). The specific treatment combinations were: (i) ST with band placement of P and broadcast N; (ii) ST with 5 × 5 placement of N and broadcast P; (iii) ST with band placement of N and P; (iv) CT with 5 × 5 placement of N and broadcast P; and (v) CT with broadcast N and P. Total N and P rates of 118 kg N per ha and 65 kg P O per ha were applied to all treatments as urea (46-0-0) and mono-ammonium
phosphate (11-52-0). Nitrogen fertilizer application rate was based on University of Idaho recommendations for corn grain (1) at a yield goal of 11 Mg/ha and NO -N and NH -N concentrations in the 0 to 30 and 30 to 60-cm depth in 2007. A 67 kg N per ha alfalfa credit was applied. The same fertilizer rates were used in 2009 for consistency. All treatments were replicated four times in a randomized complete block design.
Conventional tillage treatments consisted of chisel plow, tandem disk, fertilizer application (on broadcast treatments), and roller harrow in the spring. Strip tillage was conducted using a Strip Cat implement developed by Twin Diamond Industries LLC in Minden, NE. Corn (Pioneer 3523, GDD = 2530 in 2007; Pioneer 38H66, GDD = 2370 in 2009) was planted to the study locations at a seeding rate of 76,600 seed/ha on 24 May and 2 June in 2007 and 2009, respectively. The study locations were irrigated with furrow irrigation in 2007 and sprinkler irrigation in 2009.
Corn grain yield from each plot was determined by harvesting 12.2 m of row on 13 November 2007 and 18.3 m of row on 10 November 2009. Prior to harvest, eight whole plants from each plot were hand-harvested to quantify above ground biomass production (whole plant, grain + cobs + stover) and total N and P content of cobs, stover, and grain. Oven dried grain, stover, and cob
3
3 4
2 5
3 4
50F
samples were ground for total N and P analysis. Total N was determined by combusting 50 mg of sample in a FlashEA1112 (CE Elantech, Lakewood, NJ). Total P was determined using inductively coupled plasma optical emission spectroscopy (ICP-OES) following dry ashing of a 0.5-g sample at 500°C for 6 h and digestion on a hot plate with 10 ml of 1N HNO .
Analysis of variance for the comparison of tillage/fertilizer placement treatments for grain yield, biomass yield, and N and P content of grain and biomass was conducted using the Randomized Complete Block Model from Statistix 8 (2003, Analytical Software, Tallahassee, FL). The least significant difference (LSD) method was used for mean separations.
Soil Analysis
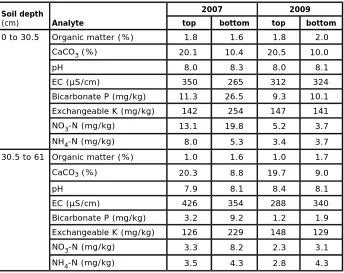
For all sites, many soil properties were similar at the 0 to 30 and 30 to 60-cm depths (Table 1). However, compared to the bottom locations, CaCO percentage was on average two times greater at both soil depths and OM was about 40% less in the 30 to 60-cm depth in the top locations. These differences resulted from the erosion of topsoil on the top end, exposing the calcareous subsoils associated with many soils in this region. Soil test P ranged from 9.3 to 26.5 mg/kg in the 0 to 30-cm depth over all site years. The soil test P
concentrations at three of the sites (2007 top, 2009 top, and 2009 bottom) were considered low to marginal according to the University of Idaho fertilizer recommendations for field corn (1). The recommendations suggested
application of 45 to 157 kg P O per ha depending on the soil lime content. The soil test K at all sites was considered sufficient.
Table 1. Selected soil chemical properties from top and bottom sites in 2007 and 2009.
Grain Yield and Biomass
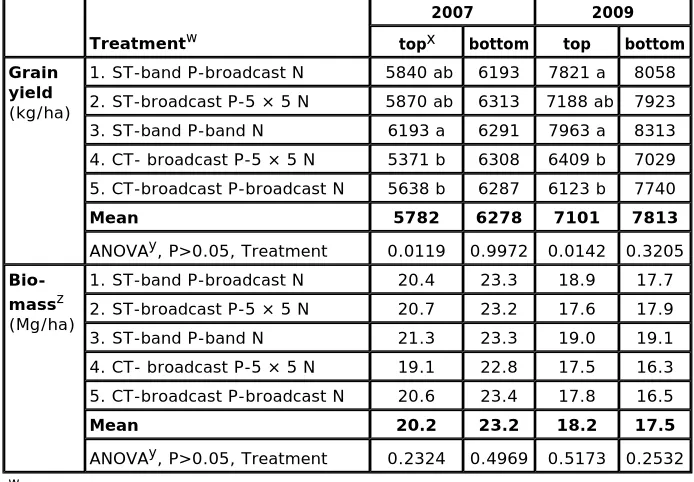
Based on grain yields in 2007 and 2009, N was supplied in adequate quantities and N deficiencies were not likely. Analysis of variance of treatment effects on corn grain yield and biomass were conducted for each field location separately in 2007 and 2009. There were grain yield differences in treatments at the top locations in 2007 and 2009 (Table 2). At the top location in 2007, treatment 3 (ST-band P-band N) was 12.5% (689 kg/ha) greater than the average of the CT treatments (4 and 5). At the top location in 2009, treatments
Soil depth
(cm) Analyte
2007 2009
top bottom top bottom
0 to 30.5 Organic matter (%) 1.8 1.6 1.8 2.0 CaCO (%) 20.1 10.4 20.5 10.0 pH 8.0 8.3 8.0 8.1 EC (µS/cm) 350 265 312 324 Bicarbonate P (mg/kg) 11.3 26.5 9.3 10.1 Exchangeable K (mg/kg) 142 254 147 141 NO -N (mg/kg) 13.1 19.8 5.2 3.7 NH -N (mg/kg) 8.0 5.3 3.4 3.7 30.5 to 61 Organic matter (%) 1.0 1.6 1.0 1.7 CaCO (%) 20.3 8.8 19.7 9.0
pH 7.9 8.1 8.4 8.1 EC (µS/cm) 426 354 288 340 Bicarbonate P (mg/kg) 3.2 9.2 1.2 1.9 Exchangeable K (mg/kg) 126 229 148 129 NO -N (mg/kg) 3.3 8.2 2.3 3.1 NH -N (mg/kg) 3.5 4.3 2.8 4.3
3
3
2 5
3
3
4
3
3
3 (ST-band P-band N) and 1 (ST-band P-broadcast N) were on average 25.9% (1,626 kg/ha) greater than the average of the CT treatments. A direct
comparison of tillage effects on grain yield could be made between treatments 2 (ST-5 × 5 N-broadcast P) and 4 (CT-5 × 5 N-broadcast P) due to the treatments having the same fertilizer placements. Similar grain yields for the two
treatments during both years of the study indicate that there was no effect of tillage on grain yield. Any differences in this study were likely due to band placement of fertilizers with ST. In 2007 and 2009, the placement of N in the CT treatments did not affect grain yield under CT at the top location.
Table 2. Grain yield and biomass (dry matter basis) and analysis of variance in 2007 and 2009 for the top and bottom sites.
w ST = strip tillage, CT = conventional tillage.
x For each year and location rows with the same letter are not significantly
different.
y Analysis of Variance conducted separately for each location in each year. z Biomass = grain + cobs + stover mass.
At the bottom locations in 2007 and 2009, there were no grain yield differences among treatments. Although not statistically compared, the trend for greater grain yields at the bottom locations compared to the top locations was likely due to differing soil properties resulting from irrigation induced erosion at the top locations (Table 1). Previous research on these types of soils in this region has shown yield reductions on the eroded areas of furrow irrigated fields (2). Research has shown a greater immobilization of applied P in these eroded soils due to greater amounts of CaCO (7). In this study, greater CaCO percentage at the top locations likely resulted in the advantage of applying P in a concentrated band under ST.
There was no influence of soil water differences between CT and ST on corn grain or biomass yield (data not shown). In 2007 both sites were furrow irrigated on a regular basis to meet crop ET demand. In 2009, the soil water content in the top 1 m soil depth was statistically the same for both tillage practices throughout the growing season (data not shown). Plant populations also did not influence differences among treatments. In 2007, plant populations averaged 69,800 and 71,400 plants/ha at the top and bottom locations,
respectively. In 2009, plant populations averaged 73,500 and 73,100 plants/ha at the top and bottom locations, respectively.
At the top and bottom locations in 2007 and 2009, there were no differences in biomass among treatments. Grain yield was affected more by soil properties
Treatmentw
2007 2009
top bottom top bottom
Grain yield
(kg/ha)
1. ST-band P-broadcast N 5840 ab 6193 7821 a 8058 2. ST-broadcast P-5 × 5 N 5870 ab 6313 7188 ab 7923 3. ST-band P-band N 6193 a 6291 7963 a 8313 4. CT- broadcast P-5 × 5 N 5371 b 6308 6409 b 7029 5. CT-broadcast P-broadcast N 5638 b 6287 6123 b 7740
Mean 5782 6278 7101 7813
ANOVAy, P>0.05, Treatment 0.0119 0.9972 0.0142 0.3205
Bio- massz (Mg/ha)
1. ST-band P-broadcast N 20.4 23.3 18.9 17.7 2. ST-broadcast P-5 × 5 N 20.7 23.2 17.6 17.9 3. ST-band P-band N 21.3 23.3 19.0 19.1 4. CT- broadcast P-5 × 5 N 19.1 22.8 17.5 16.3 5. CT-broadcast P-broadcast N 20.6 23.4 17.8 16.5
Mean 20.2 23.2 18.2 17.5
ANOVAy, P>0.05, Treatment 0.2324 0.4969 0.5173 0.2532
x
and fertilizer placement than other components of plant biomass (stalks, leaves, and cobs) (Table 2).
Plant N and P Removal
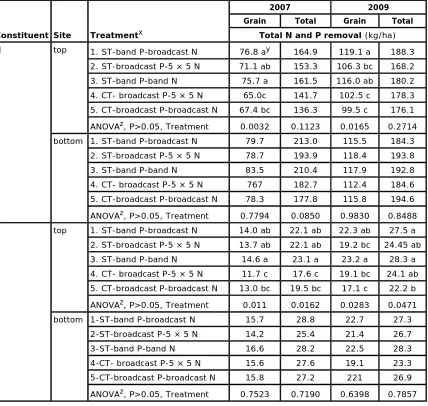
In 2007 and 2009, there were differences in grain N removal between treatments at the top locations (Table 3). At the top locations, treatments 3 (ST-band P-(ST-band N) and 1 (ST-(ST-band P-broadcast N) had 13 and 14% greater grain N removal compared to the CT treatments (4 and 5) in 2007 and 2009,
respectively (Table 3). At the top locations, there were no differences in total biomass N removal among treatments. At the bottom locations, there were no differences in grain or biomass N removal among treatments (Table 2).
Table 3. Total N and P removal (kg/ha) in corn grain and biomass and analysis of variance in 2007 and 2009 for the top and bottom sites.
x ST = strip tillage, CT = conventional tillage.
y For each year and location rows with the same letter are not significantly different. z Analysis of Variance conducted separately for each location and each year.
Constituent Site Treatmentx
2007 2009
Grain Total Grain Total
Total N and P removal (kg/ha) N top 1. ST-band P-broadcast N 76.8 ay 164.9 119.1 a 188.3
2. ST-broadcast P-5 × 5 N 71.1 ab 153.3 106.3 bc 168.2 3. ST-band P-band N 75.7 a 161.5 116.0 ab 180.2 4. CT- broadcast P-5 × 5 N 65.0c 141.7 102.5 c 178.3 5. CT-broadcast P-broadcast N 67.4 bc 136.3 99.5 c 176.1
ANOVAz, P>0.05, Treatment 0.0032 0.1123 0.0165 0.2714 bottom 1. ST-band P-broadcast N 79.7 213.0 115.5 184.3
2. ST-broadcast P-5 × 5 N 78.7 193.9 118.4 193.8 3. ST-band P-band N 83.5 210.4 117.9 192.8 4. CT- broadcast P-5 × 5 N 767 182.7 112.4 184.6 5. CT-broadcast P-broadcast N 78.3 177.8 115.8 194.6
ANOVAz, P>0.05, Treatment 0.7794 0.0850 0.9830 0.8488 P top 1. ST-band P-broadcast N 14.0 ab 22.1 ab 22.3 ab 27.5 a 2. ST-broadcast P-5 × 5 N 13.7 ab 22.1 ab 19.2 bc 24.45 ab 3. ST-band P-band N 14.6 a 23.1 a 23.2 a 28.3 a 4. CT- broadcast P-5 × 5 N 11.7 c 17.6 c 19.1 bc 24.1 ab 5. CT-broadcast P-broadcast N 13.0 bc 19.5 bc 17.1 c 22.2 b
ANOVAz, P>0.05, Treatment 0.011 0.0162 0.0283 0.0471 bottom 1-ST-band P-broadcast N 15.7 28.8 22.7 27.3
2-ST-broadcast P-5 × 5 N 14.2 25.4 21.4 26.7 3-ST-band P-band N 16.6 28.2 22.5 28.3 4-CT- broadcast P-5 × 5 N 15.6 27.6 19.1 23.3 5-CT-broadcast P-broadcast N 15.8 27.2 221 26.9
ANOVAz, P>0.05, Treatment 0.7523 0.7190 0.6398 0.7857
biomass P removal compared to the CT treatments. At the bottom location in 2007 and 2009, no differences were found in grain or biomass P removal among treatments (Table 3).
Conclusions
Many soils in southern Idaho and other areas of the Pacific Northwest have been eroded to various degrees due to furrow irrigation. This study shows that on some eroded soils, band placement of fertilizers, especially P, can increase corn grain yields. In this study, the grain yield increase was between 700 and 1,600 kg/ha. Fertilizer placement did not affect grain yields on less eroded and thus more productive soils. Band placement of fertilizer with ST did not affect biomass irrespective of the soil property differences resulting from erosion.
Literature Cited
1. Brown, B. D., and Westermann, D. T. 1988. Idaho Fertilizer Guide: Irrigated field corn for silage or grain. Current Info. Ser. No. 372. Univ. of Idaho Ext., Moscow, ID.
2. Carter, D. L., Berg, R. D., and Sanders, B. J. 1985. The effect of furrow irrigation erosion on crop productivity. Soil Sci. Soc. Am. J. 49:207-211.
3. Griffith, D. R., Mannering, J. V., Galloway, H. M., Parsons, S. D., and Richey, C. B. 1973. Effects of eight-planting systems on soil temperature, percent stand, plant growth, and yield of corn on five Indiana soils. Agron. J. 65:321-326.
4. Keeney, D. R., and Nelson, D. W. 1982. Nitrogen: Inorganic forms. Pages 643–698 in: Methods of Soil Analysis: Part 2, Chemical and Microbiological Properties, 2nd Edn. A. L. Page, ed. ASA and SSSA, Madison, WI.
5. Mallarino, A. P., Bordoli, J. M., and Borges, R. 1999. Phosphorus and potassium placement effects on early growth and nutrient uptake of no-till corn and relationships with grain yield. Agron. J. 91:37-45.
6. Olsen, S. R., Cole, C. V., Watanabe, F. S., and Dean, L. A. 1954. Estimation of available phosphorus in soils by extraction with sodium bicarbonate. USDA. Circ 939. United State Government Printing Office, Washington, DC.
7. Robbins, C. W., Westermann, D. T., and Freeborn, L. L. 1999. Phosphorus forms and extractability from three sources in a recently exposed calcareous subsoil. Soil Sci. Soc. Am. J. 63:1717-1724.
8. Sherrod, L. A., Dunn, G., Petersen, G. A., and Kolberg, R. L. 2002. Inorganic carbon analysis by modified pressure-calcimeter method. Soil Sci. Soc. Am. J. 66:299-305 9. Vetsch, J. A., and Randall, G. W. 2002. Corn production as affected by tillage system
and starter fertilizer. Agron. J. 94:532-570.
10. Vyn, T. J., and Raimbault, B. A. 1992. Evaluation of strip tillage systems for corn production in Ontario. Agron. J. 93:487-495.