O R I G I N A L R E S E A R C H
Open Access
Diagnostic performance of the specific
uptake size index for semi-quantitative
analysis of I-123-FP-CIT SPECT: harmonized
multi-center research setting versus typical
clinical single-camera setting
Ralph Buchert
1*†, Catharina Lange
2*†, Timo S. Spehl
3, Ivayla Apostolova
1, Lars Frings
3, Cathrine Jonsson
4,
Philipp T. Meyer
3and Sabine Hellwig
3,5Abstract
Introduction:The specific uptake size index (SUSI) of striatal FP-CIT uptake is independent of spatial resolution in the SPECT image, in contrast to the specific binding ratio (SBR). This suggests that the SUSI is particularly
appropriate for multi-site/multi-camera settings in which camera-specific effects increase inter-subject variability of spatial resolution. However, the SUSI is sensitive to inter-subject variability of striatum size. Furthermore, it might be more sensitive to errors of the estimate of non-displaceable FP-CIT binding. This study compared SUSI and SBR in the multi-site/multi-camera (MULTI) setting of a prospective multi-center study and in a mono-site/mono-camera (MONO) setting representative of clinical routine.
Methods:The MULTI setting included patients with Parkinson’s disease (PD,n= 438) and healthy controls (n= 207) from the Parkinson Progression Marker Initiative. The MONO setting included 122 patients from routine clinical patient care in whom FP-CIT SPECT had been performed with the same double-head SPECT system according to the same acquisition and reconstruction protocol. Patients were categorized as“neurodegenerative”(n= 84) or
“non-neurodegenerative”(n= 38) based on follow-up data. FP-CIT SPECTs were stereotactically normalized to MNI space. SUSI and SBR were computed for caudate, putamen, and whole striatum using unilateral ROIs predefined in MNI space. SUSI analysis was repeated in native patient space in the MONO setting. The area (AUC) under the ROC curve for identification of PD/“neurodegenerative”cases was used as performance measure.
(Continued on next page)
© The Author(s). 2019Open Access This article is distributed under the terms of the Creative Commons Attribution 4.0 International License (http://creativecommons.org/licenses/by/4.0/), which permits unrestricted use, distribution, and reproduction in any medium, provided you give appropriate credit to the original author(s) and the source, provide a link to the Creative Commons license, and indicate if changes were made.
* Correspondence:[email protected];[email protected]
†Ralph Buchert and Catharina Lange contributed equally to this work.
1Department for Diagnostic and Interventional Radiology and Nuclear
Medicine, University Hospital Hamburg-Eppendorf, Martinistr. 52, 20246 Hamburg, Germany
2Department of Nuclear Medicine, Charité - Universitätsmedizin Berlin,
(Continued from previous page)
Results:In both settings, the highest AUC was achieved by the putamen (minimum over both hemispheres), independent of the semi-quantitative method (SUSI or SBR). The putaminal SUSI provided slightly better
performance with ROI analysis in MNI space compared to patient space (AUC = 0.969 vs. 0.961,p= 0.129). The SUSI (computed in MNI space) performed slightly better than the SBR in the MULTI setting (AUC = 0.993 vs. 0.991,p= 0. 207) and slightly worse in the MONO setting (AUC = 0.969 vs. AUC = 0.976,p= 0.259). There was a trend toward larger AUC difference between SUSI and SBR in the MULTI setting compared to the MONO setting (p= 0.073). Variability of voxel intensity in the reference region was larger in misclassified cases compared to correctly classified cases for both SUSI and SBR (MULTI setting:p= 0.007 andp= 0.012, respectively).
Conclusions:The SUSI is particularly useful in MULTI settings. SPECT images should be stereotactically normalized prior to SUSI analysis. The putaminal SUSI provides better diagnostic performance than the SUSI of the whole striatum. Errors of the estimate of non-displaceable count density in the reference region can cause misclassification by both SUSI and SBR, particularly in borderline cases. These cases might be identified by visual checking FP-CIT uptake in the reference region for particularly high variability.
Keywords:Dopamine transporter, SPECT, FP-CIT, Semi-quantitative analysis, Specific uptake size index, Specific binding ratio
Introduction
Single-photon emission computed tomography (SPECT) with the I-123 labeled dopamine transporter (DAT) ligand FP-CIT is widely used for detection (or exclusion) of nigrostriatal degeneration in patients with clinically uncertain parkinsonian syndrome (PS) [1]. Semi-quantitative analysis of striatal FP-CIT uptake has the potential to support visual interpretation of the SPECT images [2,3].
Semi-quantitative analysis in radionuclide imaging often aims at estimating the binding potential (BP), first defined by Mintun and co-workers as BP = Bmax / KD, where Bmax is the density of available binding sites (here DAT) and 1/KD is the affinity of the tracer (here FP-CIT) for the binding site [4]. The binding potential is a measure of the capacity of the region of interest (ROI) for specific binding of the tracer, that is, binding to the binding site of interest. More generally, a binding poten-tial can be defined as the equilibrium concentration of specific binding to some other reference concentration [5]. The most widely used binding potential is the non-displaceable binding potential BPnd based on the concentration of the non-displaceable (by blocking of the binding site) tracer in the ROI as reference, i.e.,
BPnd¼Cs=Cnd; ð1Þ
where Cs and Cnd are the equilibrium concentration of specifically bound and non-displaceable tracer in the ROI, respectively. Determination of BPnd requires dy-namic imaging and arterial blood sampling for full tracer kinetic modeling. This is not feasible in clinical routine so that a number of methods have been developed to es-timate BPnd from a single static scan during equilibrium (for FP-CIT approximately given between 3 and 6 h after i.v. injection [6]). The most widely used among these
methods is the specific binding ratio (SBR) defined by the formula [7]
SBR¼ ðC−CRÞ=CR; ð2Þ
Only in an ideal situation in which all main causes of in-accuracy and imprecision of SPECT (attenuation, scatter, partial volume effects, statistical noise) were properly dealt with, the true SBR value would be obtained with any SPECT camera and reduction of inter-camera vari-ability would naturally follow from accuracy.
The specific uptake size index (SUSI) has been pro-posed to improve accuracy of semi-quantitative analysis in FP-CIT SPECT in practice [7, 15, 16]. It has been thoroughly validated in phantom studies where true count densities are known [15,17]. The SUSI eliminates partial volume effects by replacing count densityin the striatal ROI by a measure of total counts in the ROI. More precisely, the SUSI is defined as
SUSI¼ ðT−CRVÞ=CR; ð3Þ
where T is the total number of counts originating from a large striatal ROI, V is the volume of the striatal ROI, and CR is the count concentration in the reference region.
The striatal ROI for the computation of the SUSI is chosen sufficiently large around the striatum to guarantee that all counts originating from the striatum are detected within this ROI. Assuming that image reconstruction is
“activity conserving” (that is, counts are neither lost nor artificially produced by the reconstruction, although lim-ited spatial resolution can cause counts originating from the striatum to be localized outside of the striatum), sum-ming the activity over all voxels within the large striatum ROI collects all counts originating from the striatum. This holds true independently of the spatial resolution in the reconstructed SPECT image as long as the ROI is large enough to encompass all counts originating from the stri-atum. Thus, the SUSI is independent of spatial resolution [15]. The SUSI approach can be seen as a method for par-tial volume correction of the SBR. This is due to the fact that SBR = SUSI / Vs, where Vs is the actual volume of the striatum, as is easily derived from Eqs. (2) and (3) [15].
The SUSI has been used successfully for the quantita-tive characterization of age effects on DAT availability in healthy subjects from the European normal control data-base of FP-CIT SPECT (ENC-DAT) [18]. A total of 13 sites using ten different SPECT camera models contrib-uted to the ENC-DAT study.
The SUSI is typically computed in the original SPECT im-ages in patient space after manual reorientation [7,15,16]. A limitation of the SUSI computed in patient space is that it also depends on the size of the striatum, not via partial vol-ume effects as the SBR, but via the total amount of specific-ally bound FP-CIT that increases with increasing size of the striatum (assuming constant DAT concentration). Thus, inter-subject variability of striatum size causes additional variability of the SUSI that might limit its power to detect nigrostriatal degeneration. The impact of inter-subject
variability of striatum size on the SUSI might be eliminated by concentration-preserving stereotactical normalization of the SPECT images into an anatomical standard space prior to ROI analysis. Inter-subject variability of partial volume ef-fects cannot be eliminated this way.
A recent study suggested the SUSI to be more sensitive than the SBR to errors of the estimate of non-displaceable count density in the striatum by the count density CR in the reference region [19]. In both methods, SBR and SUSI, the reference region is used to correct the striatal signal for non-displaceable“background”in the striatum ROI that di-lutes the effect of nigrostriatal degeneration in these mea-sures if not corrected for. It is evident that the background contribution increases when the ROI size increases beyond the anatomical boundaries of the striatum. Thus, the relative magnitude of the correction for non-displaceable back-ground increases with increasing ROI size. As a conse-quence, the computed measure of specific striatal binding (SBR or SUSI) might be more sensitive to errors (including statistical noise) of the estimate of non-displaceable FP-CIT binding the larger the striatal ROI.
Aim of the present study was to compare the SUSI and the SBR with respect to detection of nigrostriatal degener-ation in (i) a sample of patients with PS in whom FP-CIT SPECT has been performed with the same SPECT camera using the same acquisition protocol with radius of rotation within very tight limits [20] and the same reconstruction protocol (mono-site/mono-camera (MONO) setting) and (ii) in the multi-site/multi-camera (MULTI) setting of the Parkinson Progression Markers Initiative (PPMI) [21]. Inter-subject variability of spatial resolution in the SPECT images most likely was larger in the MULTI setting com-pared to the MONO setting (due to camera-specific vari-ability of spatial resolution in the MULTI setting). The primary hypothesis put to test was that the diagnostic per-formance of the SUSI relative to the SBR is better in the MULTI setting compared to the MONO setting (due to its stability with respect to varying spatial resolution in the SPECT images), particularly when the SUSI is computed after stereotactical normalization (in order to eliminate inter-subject variability of striatum size) rather than in raw images in patient space [7]. The secondary hypothesis put to test was that the variability of the count density in the reference region impacts the diagnostic performance of both SUSI and SBR, and that the effect is larger for the SUSI than for the SBR.
Materials and methods
Mono-site/mono-camera setting
University Medical Center Freiburg. The patients were categorized into two groups: “neurodegenerative PS” and
“non-neurodegenerative PS.” The neurodegenerative group (n= 84, 39 females, 67.3 ± 10.0 years) comprised (i) the Lewy body disease spectrum (n= 60) including Parkinson’s disease (PD,n= 41), PD dementia (PDD,n= 5), and dementia with Lewy bodies (DLB,n= 14), and (ii) atypical parkinsonian syn-dromes (APS, n= 24) including multiple systems atrophy (MSA-P and MSA-P/C, n= 7), progressive supranuclear palsy (PSP,n= 13), and corticobasal degeneration (CBD,n= 4). The non-neurodegenerative group (n= 38, 15 females, 70.0 ± 8.0 years) comprised (i) essential tremor (n= 2), (ii) vascular parkinsonism (VaP, n= 7), (iii) drug-induced parkinsonism (n= 11), (iv) psychogenic parkinsonism (n= 1), (v) possible Alzheimer’s disease (AD, n= 11), and (vi) normal pressure hydrocephalus (NPH, n= 6). The clinical diagnoses were established by a movement disorder specialist based on current consensus criteria and review of all relevant medical charts and clinical follow-up data (mean follow-up 26.8 ± 14.5 months). Patients with other than the listed diagnosis were excluded.
FP-CIT SPECT had been performed according to com-mon guidelines [22,23]. The same double-head SPECT sys-tem (Siemens E.CAM) and the same acquisition protocol had been used in all patients (thyroid uptake blocked with sodium perchlorate, 3 h uptake period after intravenous bolus injection of 193 ± 8 MBq FP-CIT; low-energy high-resolution parallel-hole collimators, 60 projections of 30 s duration with each head along a scan arc of 180° (i.e. 3° angular sampling), radius of rotation = 13.5 ± 0.3 cm, en-ergy window 144–168 keV, acquisition matrix 128 × 128, zoom factor 1.23). In order to ensure consistent image re-construction in all patients, projection data were exported from the archive and retrospectively reconstructed by three-dimensional ordered subset expectation maximization (OSEM) with resolution recovery using the Flash3D algorithm of the scanner software. The following parameter settings were used as previously proposed for FP-CIT SPECT specifically with the E.CAM camera to provide a good compromise between delineation of striatal substructures for visual inspection, recovery of striatal tracer uptake, and noise of non-displaceable tracer uptake in the reference region for semi-quantitative analysis [24]: 8 iterations, 8 subsets, postfiltering with a Gaussian kernel with 8 mm full-width-at-half-maximum (FWHM). Uniform post reconstruction attenuation correction was performed according to Chang (first order, broad-beam attenuation coefficient μ= 0.12/cm); no scatter correction was per-formed. Voxel size was 3.9 × 3.9 × 3.9 mm3.
Multi-site/multi-camera setting
Data were obtained from the Parkinson’s Progression Markers Initiative (PPMI) database (
https://www.ppmi-info.org/access-data-specimens/download-data/) [21]. Up-to-date information on the PPMI is available at www. ppmi-info.org. The PPMI is a longitudinal, multi-center study that aims to assess the progression of clinical features, imaging, and biologic markers in patients with (idiopathic) PD and healthy control (HC) subjects. All PD patients were in an early stage of the disease (diagnosis of PD within the last 2 years prior to screening). Details of the eligibility cri-teria are given at http://www.ppmi-info.org/wp-content/up-loads/2014/01/PPMI-AM7-Protocol.pdf.
All FP-CIT scans available from the PPMI database on 22nd November 2017 were downloaded in DICOM for-mat, independent of subgroup and visit (n= 1710). The analyses of the present study included the first FP-CIT SPECT of all HC subjects and all PD patients, that is, the analyses included also FP-CIT SPECT at an “ un-scheduled” visit if FP-CIT SPECT at the screening visit was not available. Furthermore, the analyses included not only“regular”HC subjects and“regular”PD patients but also subjects who (i) declined participation in the PPMI study after the screening visit but before inclusion in the study (n= 20), or (ii) withdrew agreement after in-clusion in the study (n= 78), or (iii) were excluded from participation in the study due to a reason not related to FP-CIT SPECT (n= 23). This resulted in 656 FP-CIT scans. Visual inspection resulted in exclusion of 11 of these scans: three HC scans were excluded because of clearly reduced striatal FP-CIT uptake (PPMI-ID 3221, 3478, 4095); eight PD scans were excluded because of clearly normal FP-CIT uptake in the striatum (3027, 3289, 3290, 3534, 3618, 3623, 3660, 3863). This resulted in the inclusion of a total of 645 FP-CIT SPECTs: 438 of PD patients and 207 of HC subjects.
preprocessed images that have been stereotactically nor-malized into the anatomical space of the Montreal Neurological Institute (MNI) were available for down-load. The images were in DICOM format with 91 × 109 × 91 cubic voxels of 2 mm edge length.
Semi-quantitative analyses
All semi-quantitative analyses were performed fully automatically using a MATLAB script.
SBR was computed according to formula (2) with ROI analysis in MNI space. For this purpose, individual FP-CIT SPECTs were transformed (affine, that is, without warping) into MNI space using the Statistical Parametric Mapping software package (version SPM12) and a custom-made FP-CIT template (Fig. 1). Unilateral ROIs for caudate, putamen, and entire striatum (= union of caudate and putamen ROI) predefined in MNI space by the automatic anatomic labeling (AAL) atlas [26] available in the PickAtlas of the Wake Forest University were used (Fig. 1a) [27]. In addition, custom-made unilateral ROIs for anterior and posterior putamen manually predefined in MNI space were tested (Fig.1b). Count concentration within a ROI was characterized by the average intensity over all voxels within the ROIs. The 75th percentile of the count density in a reference region comprising the whole brain without striata, thalamus, and brain stem was used as estimate of non-displaceable count density (Fig. 1d) [28].
The SUSI was computed according to formula (3) with ROI analysis in MNI space. It was computed separately for unilateral caudate and unilateral putamen using large three-dimensional unilateral ROIs predefined in MNI space (Fig.1c). The union of large caudate and large pu-tamen ROI was used to compute the SUSI of the entire unilateral striatum. In the MONO setting, SUSI analysis was repeated in native patient space. For this purpose, the
FP-CIT template was stereotactically normalized into patient space (affine transformation). The resulting transformation was used to map the ROIs from MNI space to the patient’s FP-CIT SPECT.
Statistical analyses
SUSI and SBR were tested for identification of “ neurode-generative PS”in the MONO setting and for identification of PD patients in the MULTI setting using the minimum over both hemispheres for both semi-quantitative mea-sures. The area (AUC) under the receiver operating charac-teristic (ROC) curve was employed as performance measure. Total accuracy, sensitivity, and specificity were computed with the cut-off fixed by Youden’s criterion [29].
In order to test for potential impact of individual men size on the diagnostic performance of the puta-minal SUSI computed in patient space, the volume of the AAL putamen ROI after transformation into patient space was used as measure of individual putamen size (mean of both hemispheres). Putamen size was com-pared between true positive, true negative, false positive, and false negative cases as classified by the SUSI com-puted in patient space. Univariate analysis of variance was used for this purpose.
In order to test the secondary hypothesis, that is, the im-pact of the uncertainty of the estimate of non-displaceable count density by the 75th percentile of voxel intensities in the reference region on the diagnostic performance of SUSI and SBR, the interquartile range (IQR) of voxel in-tensities in the reference region relative to the 75th per-centile of voxel intensities in the reference region was used as uncertainty measure (relative IQR). First, relative IQR was compared between correctly classified scans (true positive or true negative) and incorrectly classified scans (false positive or false negative) using unpairedttests. This was done separately for SUSI and SBR. Second, SUSI and
SBR were compared with respect to the difference of the relative IQR between correctly classified scans and incor-rectly classified scans using univariate analysis of variance of relative IQR with both, correctness of the SUSI-based classification and correctness of the SBR-based classifica-tion as fixed factors. Cut-offs fixed by Youden’s criterion were used to categorize scans as correctly or incorrectly classified.
In quantitative terms, the primary hypothesis of the study (the diagnostic performance of the SUSI relative to the SBR is better in the MULTI setting than in the MONO setting) states that (AUCSUSI – AUCSBR)
(MULTI) > (AUCSUSI–AUCSBR) (MONO), where AUC-SUSI is the AUC of the putaminal SUSI and AUCSBR is
the AUC of the putaminal SBR. Bootstrapping with 100,000-fold resampling was used to estimate the distri-bution of (AUCSUSI – AUCSBR), separately for the
MULTI and the MONO setting. Then, the distribution of (AUCSUSI – AUCSBR) was compared between the
MULTI and the MONO setting by generating 10,000 random pairs of (AUCSUSI – AUCSBR) (MULTI) and
(AUCSUSI – AUCSBR) (MONO) from their respective
distributions and counting the number of random pairs that fulfilled the alternative hypothesis (AUCSUSI –
AUCSBR) (MULTI)≤(AUCSUSI–AUCSBR) (MONO).
Results
Fully automatic affine transformation of FP-CIT SPECT from patient space into the anatomical MNI template space or vice versa worked properly in all cases
according to visual inspection. Reliable spatial trans-formation is required for automatic semi-quantitative analysis with standard ROIs predefined in template space.
Mono-site/mono-camera setting
SUSI and SBR showed better diagnostic performance with the putamen as region of interest compared to caudate and whole striatum (Table 1). The AUC pro-vided by the putaminal measures was largest for the SBR of the posterior putamen (AUC = 0.981) followed by SBR of the whole putamen (AUC = 0.976). The putaminal SUSI showed slightly worse performance, particularly when computed in patient space (AUC = 0.961, DeLong test p= 0.036 compared to SBR of the whole putamen; Table 1, Fig. 2a). Stereotactical normalization prior to ROI analysis improved the performance of the putaminal SUSI from AUC = 0.961 to AUC = 0.969, but the differ-ence did not reach statistical significance (p= 0.129, Table 1). Classification of patients (as “ neurodegenera-tive PS”or“non-neurodegenerative PS”) was incorrect in 7 (5.7%), 12 (9.8%), and 8 (6.6%) of the 122 patients when based on putaminal SBR, putaminal SUSI com-puted in patient space, or putaminal SUSI comcom-puted in MNI space, respectively (Table1).
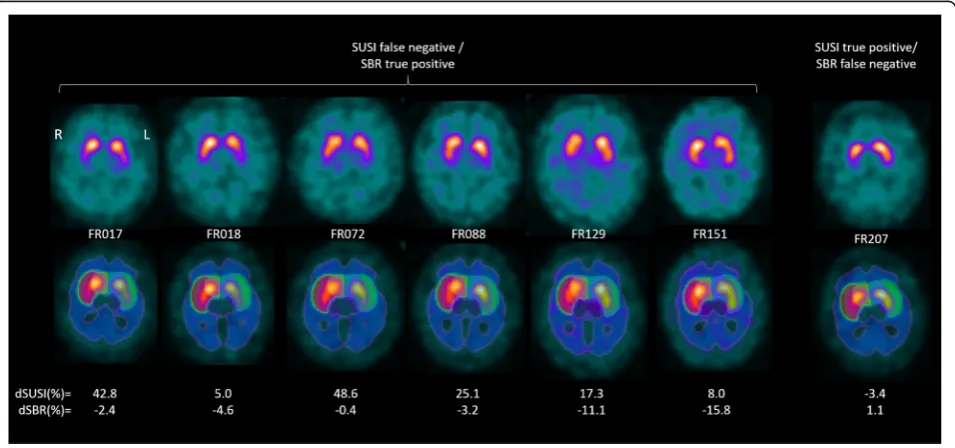
Classification based on putaminal SUSI computed in patient space or putaminal SBR was discrepant in seven patients (5.7%). All these discrepant cases had“ neurode-generative PS”and presented with borderline findings in FP-CIT SPECT (Fig. 3). Classification based on
Table 1Area (AUC) under the ROC curve, cut-off (based on Youden’s criterion), and resulting total accuracy, sensitivity, and specificity for identification of neurodegenerative etiology of parkinsonism (mono-site/mono-camera setting) or PD (multi-site/multi-camera setting). (Cau = caudate, Put = putamen, Str = striatum, ant = anterior, post = posterior)
SBR SUSI in MNI space SUSI in patient space
Cau Put ant Put post Put Str Cau Put Str Cau Put Str
Mono-camera
AUC (95% CI)
0.636bbb,ccc (0.526–0.746)
0.976c (0.954– 0.999) 0.935b (0.891– 0.980) 0.981c (0.960– 1.000) 0.925 (0.877– 0.973) 0.764aaa (0.673– 0.855) 0.969 (0.943– 0.996) 0.927 (0.881– 0.974) 0.765aaa (0.675– 0.855) 0.961a (0.930– 0.993) 0.924 (0.874– 0.974)
Cut-off 1.829 2.383 1.866 1.776 2.051 16.418 16.974 34.902 12.913 8.371 23.653
Accuracy 0.672 0.943 0.885 0.943 0.877 0.705 0.934 0.877 0.770 0.902 0.877
Sensitivity 0.762 0.940 0.857 0.917 0.881 0.643 0.929 0.869 0.821 0.881 0.881
Specificity 0.474 0.947 0.947 1.000 0.868 0.842 0.947 0.895 0.658 0.947 0.868
Multi-camera
AUC (95% CI)
0.884bbb (0.856–0.911)
0.991 (0.987– 0.996) 0.966bbb (0.954– 0.978) 0.998b (0.996– 1.000) 0.979 (0.971– 0.988) 0.920aaa (0.898– 0.942) 0.993 (0.989– 0.998) 0.978 (0.969– 0.987) – – –
Cut-off 1.781 2.068 1.776 1.597 1.960 21.229 14.799 39.171 – – –
Accuracy 0.780 0.953 0.898 0.980 0.930 0.839 0.964 0.933 – – –
Sensitivity 0.719 0.943 0.872 0.973 0.916 0.822 0.961 0.945 – – –
Specificity 0.908 0.976 0.952 0.995 0.961 0.874 0.971 0.908 – – –
Statistical testing was restricted to caudate versus caudate, putamen versus putamen, and striatum versus striatum
a/aa/aaa
DeLong testp< 0.05/0.01/0.005 compared to SBR
putaminal SUSI computed in patient space was correct (true positive) and SBR-based classification was incorrect (false negative) in one of these patients. Classification based on putaminal SUSI computed in patient space was incorrect (false negative) and SBR-based classification was correct (true positive) in the remaining six patients.
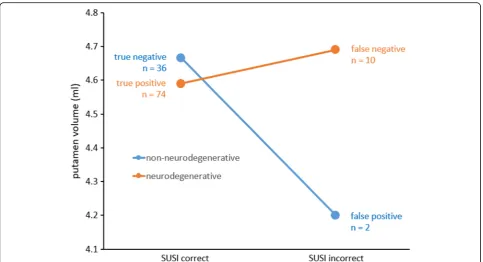
Putamen volume was smaller in the two false positive cases compared to the 36 true negative cases based on pu-taminal SUSI in patient space; it was larger in the ten false negative cases compared to the 74 true positive cases
(Fig. 4). However, neither of the two differences reached statistical significance according to analysis of variance with standard of truth (“neurodegenerative PS” versus “ non--neurodegenerative PS,” p= 0.314) and correctness of pa-tient space SUSI (true positive or true negative versus false positive or false negative,p= 0.372) as fixed factors (stand-ard of truth * correctness interactionp= 0.170).
The relative IQR of voxel intensities in the reference region was not different between the 12 patients with in-correct classification based on patient space SUSI Fig. 2ROC curves for identification of neurodegenerative etiology of parkinsonism (mono-site/mono-camera setting,a) or PD (multi-site/multi-camera setting,b)
compared to the remaining 110 patients (0.164 ± 0.012 versus 0.173 ± 0.024,ttestp= 0.199).
Harmonized multi-site/multi-camera setting
In the multi-site/multi-camera setting, the SUSI was com-puted in MNI space only, because the PPMI provides only preprocessed FP-CIT SPECT images in MNI space, the original FP-CIT images in patient space are not available. Thus, all SUSI results in the multi-site/multi-camera set-ting refer to the SUSI computed in MNI space.
In the harmonized MULTI setting, too, the putamen achieved the highest performance with both SUSI and SBR (Table1). The AUC of the SUSI increased to AUC = 0.993 when the putamen was used as region of interest from AUC = 0.978 for the whole striatum (p< 0.001).
The AUC provided by the putaminal measure was lar-gest for the SBR of the posterior putamen (AUC = 0.998), followed by the SUSI (AUC = 0.993) and the SBR of the whole putamen (AUC = 0.991) (Fig.2b). The AUC difference between SUSI and SBR of the whole putamen did not reach statistical significance (p= 0.207). Classifi-cation of subjects (as PD or HC) was incorrect in 30 (4.7%) and 23 (3.6%) of the 645 subjects when based on putaminal SBR or putaminal SUSI, respectively (Table1).
The relative IQR of voxel intensities in the reference region was higher in the 23 subjects with incorrect SUSI-based classification compared to the remaining 622
subjects with correct SUSI-based classification (0.15713 ± 0.03098 versus 0.14390 ± 0.02259,ttestp= 0.007). The same was true for the 30 subjects with incorrect SBR-based classi-fication compared to the remaining 615 subjects (0.15474 ± 0.02612 versus 0.14387 ± 0.02278,ttestp= 0.012).
Classification based on putaminal SUSI or on puta-minal SBR was discrepant in 23 of the 645 patients (3.6%). The relative IQR of voxel intensities in the refer-ence region was higher in the 23 subjects with discrepant classification compared to the remaining 622 subjects with concordant classification (0.154 ± 0.028 versus 0.144 ± 0.023,ttestp= 0.044). SUSI-based classification was cor-rect and SBR-based classification was incorcor-rect in two HC subjects and 13 PD patients. SUSI-based classification was incorrect and SBR-based classification was correct in three HC subjects and 5 PD patients. The difference of relative IQR between incorrectly classified scans and correctly classified scans based on the SUSI was larger for scans with correct SBR-based classification (0.157 ± 0.037,n= 8, versus 0.144 ± 0.023,n= 607) compared to scans with in-correct SBR-based classification (0.157 ± 0.029,n= 15, ver-sus 0.152 ± 0.024,n= 15) (Fig.5). However, the difference was not significant according to univariate analysis of vari-ance of relative IQR with correctness of the SUSI-based classification and the correctness of the SBR-based classi-fication as fixed factors (SUSI correctness * SBR correct-ness interactionp= 0.482).
SUSI versus SBR in harmonized multi-site versus mono-camera setting
The putaminal SUSI performed slightly worse than the putaminal SBR in the MONO setting (AUC = 0.969 ver-sus 0.976, p= 0.259) and slightly better in the MULTI setting (AUC = 0.993 versus 0.991,p= 0.207).
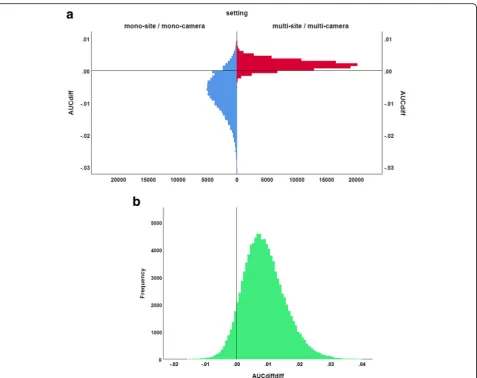
The distribution of the difference (AUCSUSI−AUCSBR)
in the MULTI setting and in the MONO setting esti-mated by bootstrapping is shown in Fig.6. Mean
(AUC-SUSI −AUCSBR) was 0.002 (95% CI -0.001–0.005) in the
MULTI setting and -0.007 (-0.021–0.004) in the MONO setting. The sign test revealed a trend toward larger (AUCSUSI–AUCSBR) in the MULTI setting compared to
the MONO setting (p= 0.073).
Discussion
SUSI and SBR showed better classification performance with the putamen as region of interest compared to the whole striatum. The difference was highly significant for both SUSI and SBR (e.g., multi-site/multi-camera setting: putaminal SUSI = 0.993, striatal SUSI = 0.978, p< 0.001, Table 1). The fraction of misclassified cases was almost twice as large for the SUSI of the whole striatum com-pared to the putaminal SUSI (6.7% versus 3.6% in the MULTI setting, Table1). Thus, the SUSI should be used with the putamen as striatal region of interest. This might appear in conflict with the rationale of the SUSI at first
Putamen volume was smaller in the two false positive cases compared to the 36 true negative cases based on putaminal SUSI in patient space; it was larger in the ten false negative cases compared to the 74 true positive cases (Fig.4). This is in line with the fact that the puta-minal SUSI increases with increasing putamen size so that the SUSI tends to overestimate putaminal DAT con-centration in patients with large putamen and to under-estimate putaminal DAT density in patients with small putamen. This can be avoided by scaling the putaminal SUSI to individual putamen size estimated from individ-ual high resolution MRI which, however, is not always available in clinical routine. Alternatively, inter-subject variability of putamen size can be reduced by concentration-preserving stereotactical normalization, that is, stereotactical normalization without modulation to account for the amount of local expansion/contrac-tion that typically is used in MRI-based morphometry to
guarantee that regional brain volume is the same in ana-tomical standard space as in the original image in pa-tient space. Based on the findings of this study, we recommend stereotactical normalization prior to SUSI analysis, although the effects of inter-subject variability of putamen size on diagnostic performance of the SUSI computed in patient space did not reach the level of statistical significance (possibly due to the rather small number of incorrectly classified cases).
Concerning the primary hypothesis put to test in this study (the classification performance of the SUSI relative to the SBR is better in the MULTI setting than in the MONO setting), the putaminal SUSI (computed in MNI space) performed slightly worse than the putaminal SBR in the MONO setting (AUC = 0.969 versus 0.976) and slightly better in the MULTI setting (AUC = 0.993 versus 0.991). This is in line with the primary hypothesis, al-though neither the difference in the MONO setting nor Fig. 6Distribution of the performance difference AUCdiff= (AUCSUSI–AUCSBR) between putaminal SUSI and putaminal SBR in the mono-site/
mono-camera (MONO) setting and in the multi-site/multi-camera (MULTI) setting (a), and distribution of the double difference AUCdiffdiff= AUCdiff
the difference in the MULTI setting reached statistical significance (p= 0.259 and 0.207, respectively). However, direct statistical comparison of the AUC difference be-tween the SUSI and the SBR bebe-tween the MULTI setting and the MONO setting showed a trend toward larger AUC difference in the MULTI setting compared to the MONO setting (p= 0.073, Fig. 6), supporting the pri-mary hypothesis. Thus, we recommend the use of the SUSI in multi-site settings and in mono-site settings with more than one SPECT camera.
The fact that the SUSI did not outperform the SBR more clearly in the MULTI setting might be explained by two factors. First, very successful harmonization of SPECT image quality (including spatial resolution) in the PPMI by careful adaption of the acquisition protocol for each single camera and central image reconstruction at a core imaging center. Second, the relative IQR of the voxel intensity in the reference region was significantly larger in cases that were incorrectly classified by the pu-taminal SUSI compared to those that were correctly classified. The same was observed for the putaminal SBR. This demonstrates that the diagnostic performance of both, SUSI and SBR, is affected by uncertainty of the estimate of non-displaceable striatal FP-CIT count dens-ity by the count densdens-ity in the reference region. The dif-ference of the relative IQR between cases that were incorrectly classified by the putaminal SUSI and those that were correctly classified by the putaminal SUSI was larger in cases correctly classified by the putamen SBR compared to those incorrectly classified by the putamen SBR (Fig. 5). This is in line with the hypothesis that the impact of uncertainty in the estimate of non-displaceable count density is larger for the SUSI than for the SBR. However, the difference did not reach statistical signifi-cance. The small number of incorrectly classified cases might have contributed to the lack of significance.
Goethals and co-workers compared the SUSI com-puted in patient space and SBR comcom-puted in template space for detection of nigrostriatal degeneration in a mono-camera setting very similar to the mono-camera setting in the present study [16]. The AUC under the ROC curve for identification of neurodegenerative PS was highest for the SUSI of the whole striatum (mini-mum over left and right hemisphere, AUC = 0.859, 95% CI 0.766–0.952). The highest AUC achieved among sev-eral variants of the SBR was for the minimum over bilat-eral caudate and bilatbilat-eral putamen SBR (AUC = 0.830, 95% CI 0.727–0.932). The minimum of putaminal SBR over both hemispheres was not considered in this study. The different ranking of SUSI and SBR in the study by Goethals and co-workers (striatal SUSI better than sub-regional SBR) compared to the present study (putaminal SBR better than striatal SUSI) most likely is due to meth-odological differences in the computation of the SBR.
The following limitations of the present study should be noted. First, the classification performance of SUSI and SBR in FP-CIT SPECT not only depends on the setting (mul-ti-site/multi-camera versus mono-site/mono-camera). Classi-fication performance of both semi-quantitative measures also depends on the subjects referred to FP-CIT SPECT.
The PPMI PD sample differs from the group of patients with neurodegenerative PS in the clinical mono-site/mono-camera sample in several respects, particularly by inclusion of patients with atypical neuro-degenerative PS (MSA, PSP, CBD) in the clinical mono-site/mono-camera sample and the exclusion of subjects without evidence of dopaminergic deficit (SWEDD) from the PPMI PD sample [25]. There is also a relevant difference between the PPMI group of healthy control subjects and the non-neurodegenerative sub-group of the clinical mono-site/mono-camera sample: the latter included etiologies (e.g., vascular parkinson-ism) that are associated with variable reduction of striatal DAT availability in a considerable fraction of pa-tients. The differences between the PPMI multi-site/ multi-camera research sample and the clinical mono-site/mono-camera sample most likely explain the fact that all tested semi-quantitative measures performed better in the PPMI sample than in the clinical sample despite the additional variability due to camera-specific effects in the PPMI sample.
Second, the excellent performance of both SUSI and SBR in the PPMI sample limits the power to detect per-formance differences (ceiling effect). Good diagnostic performance of FP-CIT SPECT independent of the ana-lysis method in general makes it difficult to demonstrate differences in the diagnostic performance between methods and to reliably identify factors that might affect performance [2].
Third, classification performance of semi-quantitative measures also depends on the SPECT cameras, the acqui-sition protocol (including radius of rotation and delay of acquisition after tracer administration), the reconstruction algorithm, and, in the multi-site/multi-camera setting, the extent of harmonization of acquisition protocol and re-construction algorithm. These factors not only affect the absolute classification performance of both SUSI and SBR, they also might affect the performance difference between SUSI and SBR. This may affect the generalizability of the results of the present study. In particular, it is to be ex-pected that the SUSI more clearly outperforms the SBR in multi-site/multi-camera settings with lower degree of harmonization than in the PPMI.
Conclusion
camera-specific effects increase inter-subject variability of spatial resolution. SPECT images should be stereotac-tically normalized prior to SUSI analysis in order to re-duce the impact of inter-subject variability of striatum size. The SUSI of the putamen provides better diagnostic performance than the SUSI of the whole striatum. In mono-camera settings without camera-specific inter-subject variability of spatial resolution, the specific bind-ing ratio (SBR) provides similar performance as the SUSI. Errors of the estimate of non-displaceable count density can cause misclassification by both, SUSI and SBR, particularly in borderline cases. We recommend to check for high uncertainty associated with high variabil-ity of voxel intensvariabil-ity in the reference ROI in addition to verification of proper placement of the ROI.
Abbreviations
AAL:Automatic anatomic labeling; AD: Alzheimer’s disease; APS: Atypical parkinsonian syndromes; AUC: Area under the ROC curve; BP: Binding potential; CBD: Corticobasal degeneration; CI: Confidence interval; DAT: Dopamine transporter; DLB: Dementia with Lewy bodies; FP-CIT: [I-123] N-ω-fluoropropyl-2β-carbomethoxy-3β-(4-iodophenyl)nortropane;
FWHM: Full-width-at-half-maximum; HC: Healthy control; IQR: Interquartile range; MNI: Montreal Neurological Institute; MONO: Mono-site/mono-camera; MSA: Multiple systems atrophy; MULTI: Multi-site/multi-camera; NPH: Normal pressure hydrocephalus; OSEM: Ordered subset expectation maximization; PD: Parkinson’s disease; PDD: Parkinson’s disease dementia; PPMI: Parkinson’s Progression Marker Initiative; PS: Parkinsonian syndrome; PSP: Progressive supranuclear palsy; ROC: Receiver operating characteristic; ROI: Region of interest; SBR: Specific binding ratio; SPECT: Single-photon emission computed tomography; SPM: Statistical Parametric Mapping; SUSI: Specific uptake size index; VaP: Vascular parkinsonism
Acknowledgements
PPMI—a public-private partnership—is funded by the Michael J. Fox Founda-tion for Parkinson’s Research and funding partners including Abbvie, Avid Ra-diopharmaceuticals, Biogen, BioLegend, Bristol-Myers Squibb, GE Healthcare, Genentech, GlaxoSmithKline, Lilly, Lundbeck, Merck, Meso Scale Discovery, Pfizer, Piramal, Roche, Sanofi Genzyme, Servier, Takeda, Teva, UCB. For up-to-date information about all of the PPMI funding partners, visit www.ppmi-info.org/fundingpartners.
The authors acknowledge support from the Open Access Publication Fund of Charité–Universitätsmedizin Berlin and German Research Foundation (DFG).
Funding
None.
Availability of data and materials
The datasets supporting the conclusions of this article can be made available on request.
Authors’contributions
RB: study concept and design, data analysis, interpretation of study results, and manuscript drafting. CL: data analysis, interpretation of study results, and manuscript drafting. TSS: data acquisition and substantial revision of manuscript. IA: interpretation of study results and substantial revision of manuscript. LF: data acquisition and substantial revision of manuscript. CJ: interpretation of study results and substantial revision of manuscript. PTM: study concept and design, data acquisition, interpretation of study results, and substantial revision of manuscript. SH: study concept and design, data acquisition, interpretation of study results, and substantial revision of manuscript. All authors read and approved the final manuscript.
Ethics approval and consent to participate
Waiver of ethics approval for this retrospective analysis was obtained from the ethics committee of the University Medical Center Freiburg. All patients had given written informed consent for scientific analysis of their data.
Consent for publication
Not applicable.
Competing interests
The authors declare that they have no competing interests.
Publisher’s Note
Springer Nature remains neutral with regard to jurisdictional claims in published maps and institutional affiliations.
Author details
1Department for Diagnostic and Interventional Radiology and Nuclear
Medicine, University Hospital Hamburg-Eppendorf, Martinistr. 52, 20246 Hamburg, Germany.2Department of Nuclear Medicine, Charité
-Universitätsmedizin Berlin, corporate member of Freie Universität Berlin, Humboldt-Universität zu Berlin, and Berlin Institute of Health, Augustenburger Platz 1, 13353 Berlin, Germany.3Department of Nuclear
Medicine, Medical Center - University of Freiburg, Faculty of Medicine, University of Freiburg, Freiburg, Germany.4Medical Radiation Physics and Nuclear Medicine, Imaging and Physiology, Karolinska University Hospital, Stockholm, Sweden.5Department of Psychiatry and Psychotherapy, Medical
Center - University of Freiburg, Faculty of Medicine, University of Freiburg, Freiburg, Germany.
Received: 25 January 2019 Accepted: 15 April 2019
References
1. Tatsch K, Poepperl G. Nigrostriatal dopamine terminal imaging with dopamine transporter SPECT: an update. J Nucl Med. 2013;54:1331–8. https://doi.org/10.2967/jnumed.112.105379.
2. Booij J, Dubroff J, Pryma D, Yu JQ, Agarwal R, Lakhani P, et al. Diagnostic performance of the visual reading of 123I-ioflupane SPECT images when assessed with or without quantification in patients with movement disorders or dementia. J Nucl Med. 2017;58:1821–6.https://doi.org/10.2967/ jnumed.116.189266.
3. Soderlund TA, Dickson JC, Prvulovich E, Ben-Haim S, Kemp P, Booij J, et al. Value of semiquantitative analysis for clinical reporting of 123I-2-beta-carbomethoxy-3beta-(4-iodophenyl)-N-(3-fluoropropyl)nortropane SPECT studies. J Nucl Med, Society of Nuclear Medicine. 2013;54:714–22.https:// doi.org/10.2967/jnumed.112.110106.
4. Mintun MA, Raichle ME, Kilbourn MR, Wooten GF, Welch MJ. A quantitative model for the in vivo assessment of drug binding sites with positron emission tomography. Ann Neurol. 1984;15:217–27.https://doi.org/10.1002/ ana.410150302.
5. Innis RB, Cunningham VJ, Delforge J, Fujita M, Gjedde A, Gunn RN, et al. Consensus nomenclature for in vivo imaging of reversibly binding radioligands. J Cereb Blood Flow Metab. 2007;27:1533–9.https://doi.org/10. 1038/sj.jcbfm.9600493.
6. Booij J, Hemelaar TG, Speelman JD, de Bruin K, Janssen AG, van Royen EA. One-day protocol for imaging of the nigrostriatal dopaminergic pathway in Parkinson's disease by [123I]FPCIT SPECT. J Nucl Med, Society of Nuclear Medicine. 1999;40:753–61.
7. Tossici-Bolt L, Hoffmann SM, Kemp PM, Mehta RL, Fleming JS. Quantification of [123I]FP-CIT SPECT brain images: an accurate technique for measurement of the specific binding ratio. Eur J Nucl Med Mol Imaging. 2006;33:1491–9. https://doi.org/10.1007/s00259-006-0155-x.
8. Badiavas K, Molyvda E, Iakovou I, Tsolaki M, Psarrakos K, Karatzas N. SPECT imaging evaluation in movement disorders: far beyond visual assessment. Eur J Nucl Med Mol Imaging. 2011;38:764–73.https://doi.org/10.1007/ s00259-010-1664-1.
9. Tatsch K, Poepperl G. Quantitative approaches to dopaminergic brain imaging. Q J Nucl Med Mol Imaging. 2012;56:27–38.
11. Crespo C, Gallego J, Cot A, Falcon C, Bullich S, Pareto D, et al. Quantification of dopaminergic neurotransmission SPECT studies with 123I-labelled radioligands. A comparison between different imaging systems and data acquisition protocols using Monte Carlo simulation. Eur J Nucl Med Mol Imaging. 2008;35:1334–42.https://doi.org/10.1007/s00259-007-0711-z. 12. Meyer PT, Sattler B, Lincke T, Seese A, Sabri O. Investigating dopaminergic
neurotransmission with 123I-FP-CIT SPECT: comparability of modern SPECT systems. J Nucl Med, Society of Nuclear Medicine. 2003;44:839–45. 13. Tossici-Bolt L, Dickson JC, Sera T, Booij J, Asenbaun-Nan S, Bagnara MC, et
al. [123I]FP-CIT ENC-DAT normal database: the impact of the reconstruction and quantification methods. EJNMMI Phys. 2017;4:8.https://doi.org/10.1186/ s40658-017-0175-6.
14. Dickson JC, Tossici-Bolt L, Sera T, Booij J, Ziebell M, Morbelli S, et al. The impact of reconstruction and scanner characterisation on the diagnostic capability of a normal database for [123I]FP-CIT SPECT imaging. EJNMMI Res. 2017;7:10.https://doi.org/10.1186/s13550-016-0253-0.
15. Fleming JS, Bolt L, Stratford JS, Kemp PM. The specific uptake size index for quantifying radiopharmaceutical uptake. Phys Med Biol. 2004;49:N227–34. 16. Goethals I, Dobbeleir A, Ham H, Santens P, D'Asseler Y. Validation of a
resolution-independent method for the quantification of 123I-FP-CIT SPECT scans. Nucl Med Commun. 2007;28:771–4.https://doi.org/10.1097/MNM. 0b013e32829152c9.
17. Tossici-Bolt L, Dickson JC, Sera T, de Nijs R, Bagnara MC, Jonsson C, et al. Calibration of gamma camera systems for a multicentre European (1)(2)(3)I-FP-CIT SPECT normal database. Eur J Nucl Med Mol Imaging. 2011;38:1529– 40.https://doi.org/10.1007/s00259-011-1801-5.
18. Varrone A, Dickson JC, Tossici-Bolt L, Sera T, Asenbaum S, Booij J, et al. European multicentre database of healthy controls for [123I]FP-CIT SPECT (ENC-DAT): age-related effects, gender differences and evaluation of different methods of analysis. Eur J Nucl Med Mol Imaging. 2013;40:213–27. https://doi.org/10.1007/s00259-012-2276-8.
19. Buchert R, Kluge A, Tossici-Bolt L, Dickson J, Bronzel M, Lange C, et al. Reduction in camera-specific variability in [(123)I]FP-CIT SPECT outcome measures by image reconstruction optimized for multisite settings: impact on age-dependence of the specific binding ratio in the ENC-DAT database of healthy controls. Eur J Nucl Med Mol Imaging. 2016;43:1323–36.https:// doi.org/10.1007/s00259-016-3309-5.
20. Koch W, Bartenstein P, la Fougere C. Radius dependence of FP-CIT quantification: a Monte Carlo-based simulation study. Ann Nucl Med. 2014; 28:103–11.https://doi.org/10.1007/s12149-013-0789-2.
21. Parkinson Progression Marker I. The Parkinson Progression Marker initiative (PPMI). Prog Neurobiol. 2011;95:629–35.https://doi.org/10.1016/j.pneurobio. 2011.09.005.
22. Darcourt J, Booij J, Tatsch K, Varrone A, Vander Borght T, Kapucu OL, et al. EANM procedure guidelines for brain neurotransmission SPECT using (123)I-labelled dopamine transporter ligands, version 2. Eur J Nucl Med Mol Imaging. 2010;37:443–50.https://doi.org/10.1007/s00259-009-1267-x. 23. Djang DS, Janssen MJ, Bohnen N, Booij J, Henderson TA, Herholz K, et al.
SNM practice guideline for dopamine transporter imaging with 123I-ioflupane SPECT 1.0. J Nucl Med. 2012;53:154–63.https://doi.org/10.2967/ jnumed.111.100784.
24. Winz OH, Hellwig S, Mix M, Weber WA, Mottaghy FM, Schafer WM, et al. Image quality and data quantification in dopamine transporter SPECT: advantage of 3-dimensional OSEM reconstruction? Clin Nucl Med. 2012;37: 866–71.https://doi.org/10.1097/RLU.0b013e318251e1b3.
25. Marek K, Chowdhury S, Siderowf A, Lasch S, Coffey CS, Caspell-Garcia C, et al. The Parkinson's progression markers initiative (PPMI)—establishing a PD biomarker cohort. Ann Clin Transl Neurol. 2018;5:1460–77.https://doi.org/10. 1002/acn3.644.
26. Tzourio-Mazoyer N, Landeau B, Papathanassiou D, Crivello F, Etard O, Delcroix N, et al. Automated anatomical labeling of activations in SPM using a macroscopic anatomical parcellation of the MNI MRI single-subject brain. Neuroimage. 2002;15:273–89.https://doi.org/10.1006/nimg.2001.0978. 27. Maldjian JA, Laurienti PJ, Kraft RA, Burdette JH. An automated method for
neuroanatomic and cytoarchitectonic atlas-based interrogation of fMRI data sets. Neuroimage. 2003;19:1233–9.
28. Kupitz D, Apostolova I, Lange C, Ulrich G, Amthauer H, Brenner W, et al. Global scaling for semi-quantitative analysis in FP-CIT SPECT. Nuklearmedizin. 2014;53: 234–41.https://doi.org/10.3413/Nukmed-0659-14-04.