R E S E A R C H A R T I C L E
Open Access
Intrarenal resistance index for the assessment of
acute renal injury in a rat liver transplantation
model
Hai-Ying Kong
1, Fen Chen
2, Yong He
2, Lin-Jiao Wu
3, Li-Qing Wang
1, Sheng-Mei Zhu
1and Shu-Sen Zheng
2*Abstract
Background:Acute kidney injury (AKI) is a common complication after liver transplantation (LT) and associated with a high mortality. The renal resistive index (RI) is used to assess early renal function impairment in critical care patients. However, limited data are available concerning changes of renal RI and the development of AKI early after reperfusion. We approached to investigate the changes of renal RI and AKI after reperfusion in a rat liver
transplantation model.
Methods:Rats were randomly divided into sham group or LT group. Ten rats in each group were used for the hemodynamic study and twenty for Doppler measurements during the procedure. Ten rats were sacrificed 30 min or 2 h after the reperfusion. We harvested kidneys, serum and urine for further analysis of the renal function. Results:The intrarenal RI increased significantly in the anhepatic stage and decreased significantly after the reperfusion in the LT group compared with sham group (P < 0.05). AKI was seen after the reperfusion in the LT group. No correlation was noted between the RI and renal function parameters 30 min after reperfusion.
Conclusions:The intrarenal RI increased significantly during the anhepatic stage, and decreased significantly early after the reperfusion. Intrarenal RI was unable to assess renal function in a rat liver transplantation model.
Keywords:Liver transplantation, Doppler sonography, Renal function, Resistive index, Cys, NGAL
Background
AKI is one of the most common complications after LT, especially in the early postoperative period [1-6]. Although the precise cause of the renal injury after LT remains elu-sive and is likely multifactor [2,5,7-9], renal vascular tone is one of the factors closely related to the effective renal perfusion and subsequent renal function [10-12]. In many cases, such as hemorrhagic shock, immediate elevations in renal RI have been reported and renal injury may occur as a functional disorder secondary to splanchnic pooling of blood, reduced effective arterial volume and compensatory activation of vasopressor systems leading to increased renal vascular tone [13]. The pathophysiology of human liver transplantation was more complex than hemorrhage shock, and there would be acute changes in intraoperative
hemodynamics resulting from suprarenal inferior vena cava (IVC) occlusion, secondary to ischemia-reperfusion injury in the liver in the procedure [3,6], and would induce major changes in renal vascular tone. However, limited data related to renal vascular tone and renal function dir-ectly after reperfusion existed during LT [11,12].
The Doppler waveform analysis of the kidneys, semi-quantified as the RI, has accumulated for both acute and chronic renal diseases [11,12,14,15]. It has also been thought to indirectly reflect the degree of resistance in the intrarenal vasculature [16] and is gaining growing at-tention as an important factor predicting the occurrence of AKI in critical care patients [14,17]. The patients with an elevated RI were at greater risk for development of AKI and overt hepatorenal syndrome [14]. Early identifi-cation of the renal vascular tone and development of AKI in this special patient population may be beneficial because clinical therapies may be modified to avoid other nephrotoxins and to improve against AKI.
* Correspondence:shusenzheng@zju.edu.cn
2Key Lab of combined Multi-organ Transplantation, Ministry of Public Health,
the First Affiliated Hospital, Zhejiang University School of Medicine, 79 Qingchun Road, Hangzhou 310003, PR China
Full list of author information is available at the end of the article
As serum Cystatin C(Cys), a more accurate predictive biomarker of glomerular filtration rate (GFR), and neu-trophil gelatinase-associated lipocalin (NGAL), an early predictive biomarker of AKI, have been successfully used in the liver diseases and LT studies [4,6,18-22], we approached to investigate the changes of renal RI values during anhepatic stage and early neohepatic stage as well as the Cys, NGAL after reperfusion in a rat liver transplantation model. This investigation might gene-rate new insights into the response of the kidney to potential harmful factors during the early reperfusion and raise the concern into the diagnostic value of RI measurements alone.
Methods
Animals
Male Sprague–Dawley rats, aged 8–10 wks, weighing
200–250 g, purchased from the Animal Resource Center
at Zhejiang University School of Medicine, were used as donors and recipients. All the animal research protocols used in this study were approved by the Animal Ethics Review Committees of Zhejiang University and accorded with the principles stated in the Guide for the Care and Use of Laboratory Animals (National Institutes of Health publication, 1985).
Experimental design and surgical procedure
The rats were randomly divided into two groups: sham operation group (Sham group; n = 50) and orthotopic LT group (LT group; n = 50). Ten recipients in each group were chosen for hemodynamic study; ten for examin-ation of Doppler ultrasound during the anhepatic stage and ten for examination after the reperfusion; and 30 min or 2 h after the reperfusion, ten recipients were sacrificed, and blood and kidney samples were collected for further analysis.
Orthotopic liver syngenic graft transplantations were performed with the two-cuff technique, which was first established by Kamada [23]. The rats were intraperito-neally injected with chloral hydrate anesthesia, 200 mg.kg-1 body weight or to effect. During the surgery, the rats were allowed to breathe oxygen on an electric heating pad under a warming light. The graft was stored in cold saline with a target cold ischemic time of 80 min; More than 90% of the rats survived this surgery. To compensate for insensible water loss and fasting period, each animal was given lactated Ringer’s 6 ml/kg per hour using a two-channel infusion pump (Anne; Abbott) during animal preparation and liver section. There was no administration of vaso-constrictors and calcinenrin inhibitor during the operation.
Hemodynamic study
Ten rats in each group were used for hemodynamic study. After induction of anesthesia, left cervical arteries
were cannulated by a catheter for measurement of mean arterial pressure (MAP). The catheter was connected via the pressure transducer (YPJ01 Pressure Transducer, physiological experiment system, Chengdu Instruments, Sichuan, China) to a multichannel data-recording unit (RM6240C, physiological experiment system, Chengdu Instruments) for continuous pressure monitoring and recording. MAP and HR were recorded before removing the liver, at the time of clamping and after the reperfusion. All data were analyzed using the physiological experiment software system (RM6240 physiological experiment sys-tem, Chengdu Instruments).
Doppler measurements
Colour-coded duplex sonography was performed using an
Esaote Mylab duplex device with a curved 2–5 MHz
transducer following a standardized protocol [24]. Base-line Doppler ultrasound examinations (Esaote Mylab90, XVISION, IOE323, Italy) and calculation of RI were performed on the right kidney. Three consecutive mea-surements at segmental and arcuate renal arteries on the right kidney were averaged. RI values were calculated automatically by the ultrasound machine using standard methodology (RI = [peak systolic velocity-peak diastolic velocity]/peak systolic velocity). RI assessments were made 10 min, 15 min after clamping of the portal vein and IVC; 5 min, 10 min, 15 min, 20 min, and 30 min after the reperfusion. RI assessments were also made at the above time points in the sham group. All Doppler examinations were done by one examiner (CF).
Assessment of liver and renal function after reperfusion
Blood samples were collected from the recipients 30 min and 2 h after the reperfusion (10 rats for sam-pling at each time point) and processed within 2 h after collection. Blood collected in serum separator tubes was allowed to clot for 15–20 min and then centrifuged for 12 min at 1000 g. Serum was collected and subsequently
frozen at −20°C until further analysis: 50 μl for the
measurement of alanine aminotransferase (ALT),
aspar-tate aminotransferase (AST), concentrations of Na+ and
serum creatinine activities, reported in units per liter (Hitachi 747 Automatic Analyzer; Boehringer Mannheim
GmbH, Mannheim, Germany); and 50 μl for NGAL
standard curves on respective enzyme-linked
immuno-sorbent assay plates. Standard curve R2 values ranged
from 0.9903 to 0.9987. And another 50 μl was used
for Cys immunoassay. Quantitative Cys levels were measured with a sandwich enzymelinked immunosorbent assay (R&D Systems, Minneapolis, Minn., USA) according to the manufacturer’s instructions. Urine samples were collected during the reperfusion period, and the volume of urine produced was recorded. Urine concentrations of Na
+
and creatinine were measured (Vetlab Services) and the
FENa was calculated as [(urine sodium/ plasma sodium)/
(urine creatinine/plasma creatinine)] × 100.
Histology and Quantification of Renal Injury
The kidney sections were stained with hematoxylin–eosin and periodic-acid Schiff. Samples were analyzed for tubu-lar cell necrosis, tubutubu-lar dilation, intratubutubu-lar detachment (×20), and evaluated in a blinded manner by a nephrolo-gist. Abnormalities were graded by a semiquantitative score (0 to 4+): 0, no abnormalities; 1+,changes affecting < 25% of the tubules; 2+, 25% to 50%;3+, 50% to 75%; 4+, >75%.
Statistical analysis
All data were presented as mean ± standard deviations (SD), and statistical analyses were performed using SAS release 6.12 (SAS Institute, Cary, NC). Data between ex-perimental groups were compared using a 2-tailed
un-paired t test. Correlation of RI values,Cys and NGAL
was tested by linear regression. Significance was defined as P < 0.05.
Results
Hemodynamic changed during liver transplantation
In the LT group, MAP decreased slightly while HR increased significantly during the anhepatic stage. After a compensatory increase of MAP and decrease of HR during the initial reperfusion stage, the MAP, HR changed gradually toward the value recorded at baseline after the reperfusion in the LT recipients (Table 1). In the sham group, the MAP and HR are stable during the operation.
Renal resistive index and arterial velocity
Renal resistive index and arterial velocity changed signifi-cantly during the procedure (Figure 1). The right intra-renal RI values increased significantly 10 min, 15 min after clamping IVC and portal vein, but decreased significantly 5 min, 10 min, 15 min, 20 min after reperfusion compared with sham group (Figure 1); The median peak arterial velocity increased significantly in the anhepatic stage and decreased significantly after the reperfusion compared with sham group (Figure 1).
Table 1 Hemodynamic variables of the two groups during the different phases of liver transplantation
Parameters BL C5 R5 R15 R30 R120
MAP(mmHg)
Sham group 80 ± 6.3 79 ± 6 82 ± 6.4 81 ± 6.1 80 ± 6.2 83 ± 6
LT group 83 ± 6.5 54 ± 4.8* 64 ± 5.2* 66 ± 5.5* 68 ± 6.3* 76 ± 7.1
HR(bpm)
Sham group 80 ± 7.5 82 ± 9.3 84 ± 9.0 82 ± 8.1 80 ± 8.7 81 ± 9.5
LT group 81 ± 6.3 114 ± 11.2* 98 ± 10.6* 94 ± 9.8* 90 ± 8.5* 93 ± 9.6*
Values are expressed as mean ± SD. *:P< 0.05, vs. sham group.
Sham: sham operating; LT: liver transplantation. BL: baseline; C5: 5 min after portal vein clamping; R5, R15, R30, R120: 5 min, 15 min, 30 min, 120 min after reperfusion.
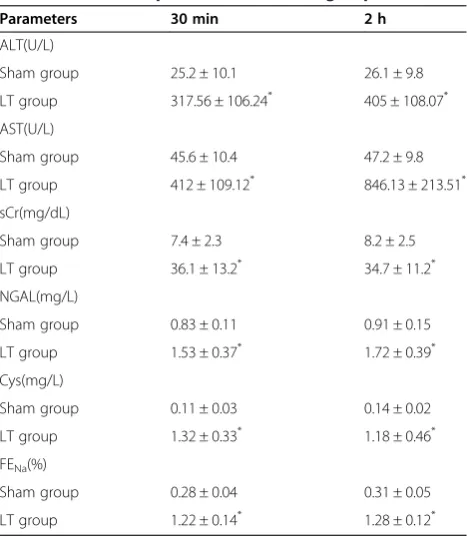
Table 2 Comparison of liver function and renal function 30 min, 2 h after reperfusion in the two groups
Parameters 30 min 2 h
ALT(U/L)
Sham group 25.2 ± 10.1 26.1 ± 9.8
LT group 317.56 ± 106.24* 405 ± 108.07*
AST(U/L)
Sham group 45.6 ± 10.4 47.2 ± 9.8
LT group 412 ± 109.12* 846.13 ± 213.51*
sCr(mg/dL)
Sham group 7.4 ± 2.3 8.2 ± 2.5
LT group 36.1 ± 13.2* 34.7 ± 11.2*
NGAL(mg/L)
Sham group 0.83 ± 0.11 0.91 ± 0.15
LT group 1.53 ± 0.37* 1.72 ± 0.39*
Cys(mg/L)
Sham group 0.11 ± 0.03 0.14 ± 0.02
LT group 1.32 ± 0.33* 1.18 ± 0.46*
FENa(%)
Sham group 0.28 ± 0.04 0.31 ± 0.05
LT group 1.22 ± 0.14* 1.28 ± 0.12*
Liver function and Renal function after the reperfusion
The ALT and AST 30 min and 2 h after the reperfusion (Table 2) were significantly increased compared with sham group (P< 0.05). We measured plasma creatinine, Cys, NGAL 30 min and 2 h after the reperfusion. The serum levels of the three markers were increased 30 min, 2 h after the reperfusion significantly compared with sham group (Table 2). To better describe the behavior of diu-resis and fractional sodium excretion, we also measured FENa30 min, 2 h after the reperfusion. The FENaincreased
significantly compared with sham group (Table 2). There was no significant correlation between the RI and renal function parameters (sCr, Cys, NGAL) 30 min after the reperfusion (P > 0.05).
Renal Histology
In the renal sections, we demonstrated multifocal acute tubular injury as evidenced by loss of brush border, flattening and loss of tubular epithelium, hyaline casts,
medullary congestion, and hemorrhage. The tubular in-jury in the LT group was presented while the renal morphology of sham rats was near normal (Figure 2).
Discussion
LT patients run the risk of developing AKI and subse-quent chronic kidney disease, affecting morbidity and mortality [1-3]. Ischemia is the most common cause of AKI; ischemic-induced renal tissue hypoxia is thought to be a major component in the development of AKI in promoting the initial tubular damage [25]. Ensuring the adequate perfusion and oxygenation of the kidney is central in the prevention of AKI [13].
This study provided information on the physiology of renal blood flow during the LT. The most striking findings were the increased renal RI in the anhepatic stage and decreased renal RI early after the reperfusion in a rat liver transplantation model. These results were different from the reports from Platt [26] and Pompili [12], which showed that the increased RI before LT can revert to normal a week after transplantation. RI measured at the different points can partially explain this apparent discrepancy, the RI values were initially measured on the first day after the operation but not im-mediately after the reperfusion, and the renal vasocon-striction due to the administration of cyclosponine (CSA) after operation can increase renal RI. The admin-istration of CSA was associated with alterations in ad-renergic tone and activation of the renin-angiotensin system [27].
The high renal RI values and arterial velocities in the anhepatic stage may be due to the acute changes in intraoperative hemodynamics secondary to the clamping of the vena cava. Clamping of the vena cava can result in the decreased cardiac preload and subsequent pronounced reduction in blood pressure; it also can increase caval and renal vein pressures and subsequently decrease the renal perfusion pressure (mean arterial pressure minus renal vein pressure) [3]. The high RI values suggested that the renal response to acute changes in hemodynamics during the anhepatic stage is similar to that in hemorrhage shock, relative hypovolemia may result in vasoconstriction and increased vascular resistance [13]. Substantial maldistribu-tion of blood flow to the kidney might be present during the anhepatic stage.
reperfusion compared with baseline was a novel finding [12,26]. The factors influencing the RI include HR, arterial stenosis, vein thrombosis and renal edema [12]. In this study, HR 5 min after clamping the portal vein and IVC was increased compared with that recorded 5 min after the reperfusion, thus the effect of the HR on the RI can be neglected. Although the mechanical renal artery stenosis can’t occur as no intervention involving renal artery in LT, an increased number of thrombotic or inflammatory can obstruct capillaries in the corticomedullary junction and influence the vascular resistance [28]. The increased MPO activity in the renal tissue, suggested the leukocyte activa-tion and infiltraactiva-tion occurred in renal tissue during LT [29]. In addition, the elevated NGAL after the reperfusion suggested that acute renal tubular injury occurred after the reperfusion. Furthermore, renal edema can also de-velop due to secondary to ischemia-reperfusion injury and venous ischemia [28]. Hence, the renal RI was expected to elevate after the reperfusion due to the changes in the renal parenchyma.
Thus, the declined renal RI values early after the re-perfusion might be ascribed to the reduction of tone within renal arterioles, resulting from the imbalance be-tween vasoconstrictive and vasodilative factors. During LT, on the reperfusion of the implanted liver, the graft itself can release substances such as proinflammatory cytokines [3,30,31] and nitric oxide [32], which can lead to the im-balance between vasoconstrictive and vasodilative factors and subsequently disturbance the adapt capacity of vascu-lar resistance and renal vascuvascu-lar dilates [31,33]. Further-more, this reduction of tone within renal might overwhelm the elevated renal RI values related to leukocyte activation and infiltration, renal tubular injury and renal edema.
Usually, reduced renal vascular tone would also imply increased renal blood flow and improve renal function [12,17]. However, the impaired renal function including decreased GFR and renal tubule injury was presented immediately after the reperfusion in this rat liver trans-plantation model. The increased Cys suggested that the GFR might decrease significantly after the reperfusion. We also showed marked renal tubule injury including
increased NGAL and FENa. FENa has been used in the
diagnosis of acute renal failure (ARF) to distinguish be-tween the two main causes of ARF, prerenal state and acute tubular necrosis (ATN) [34,35]. The activation of neurohumoral systems (angiotensin, endothelin, and catecholamines) induced by the hemodynamic changes in portal hypertention-induced arterial vascular underfilling in liver cirrhosis can increase sodium reabsorption [36],
and result in FENa <1%. Our data showed that FENa
increased after the reperfusion and levels > 1%, indicating the presence of ATN after the reperfusion. The histologic evidence of tubule injury seen in the rats after the reperfusion also suggested that rats suffered AKI after the
reperfusion. Similar findings were also reported before [29,37]. Postreperfusion syndrome [8] and surgical tech-nique [6] have been pointed as risk factors related to AKI after reperfusion. The activated inflammatory response was seen in the liver tissue as well as renal tissue after reperfusion [37]. The graft ischemia/reperfusion injury induced the infiltration of leukocytes and liver cell injury. Proinflammatory cytokines released from the reperfused liver graft can act on the kidney tissue. IL-6 and TNF-a
will trigger leukocyte–endothelium interactions and
microcirculatory dysfunction, and alter renal microvascu-lar O2distribution and promote organ damage [25,38]. In
addition, the venous warm ischemia from suprarenal IVC occlusion can also activate inflammatory response in renal tissue and aggravate kidney injury [39]. Macrophage acti-vation and neutrophilic infiltration appear to be exagge-rated during venous occlusion and increase severity of renal injury [39]. Thus, the renal microcirculation might be finally affected after reperfusion and estimation of renal perfusion is significantly limited [40]. The finding that no correlation between the RI values and the sCr and Cys and NGAL levels after reperfusion might suggested that Doppler ultrasound of renal arteries is not helpful in diag-nosing renal function impairment post-LT.
Our study has several limitations. We focused on the short-term changes of renal RI and renal function after reperfusion, some important factors related to RI and renal function in human LT are not included in our study. We did not use inotropic agents, vasoconstrictors, im-munosuppressive anti-rejection drugs. Second, we did not
measure the FENa during the anhepatic phase because of
the insufficient urinary volume for analysis. In addition, the operation was carried out between the rats with nor-mal preoperative liver function, some patients with chronic liver failure have hepatorenal syndrome, increased RI and impaired renal function before the operation.
Conclusion
In conclusion, there were major changes in renal RI during operation in liver transplantation rat model. RI increased significantly in the anhepatic stage but decreased drastically after early reperfusion of graft compared with baseline. Intrarenal RI was unable to assess renal function in a rat liver transplantation model.
Competing interests
The authors declare that they have no competing interests.
Authors’contributions
Acknowledgements
This work was supported by National Natural Science Foundation of China (81100320).
Author details
1
Department of Anesthesiology, the First Affiliated Hospital, Zhejiang University School of Medicine, Hangzhou 310003, PR China.2Key Lab of combined Multi-organ Transplantation, Ministry of Public Health, the First Affiliated Hospital, Zhejiang University School of Medicine, 79 Qingchun Road, Hangzhou 310003, PR China.3State Key Laboratory for Diagnosis and Treatment of Infectious Diseases; Key Laboratory of Infectious Diseases, Zhejiang Province; Department of Infectious Diseases, First Affiliated Hospital, Zhejiang University School of Medicine, Hangzhou 310003, PR China.
Received: 4 July 2012 Accepted: 26 February 2013 Published: 2 March 2013
References
1. Smith JO, Shiffman ML, Behnke M, Stravitz RT, Luketic VA, Sanyal AJ, Heuman DM, Fisher RA, Cotterell AH, Maluf DG, Posner MP, Sterling RK:Incidence of prolonged length of stay after orthotopic liver transplantation and its influence on outcomes.Liver Transpl2009,15:273–279.
2. Barri YM, Sanchez EQ, Jennings LW, Melton LB, Hays S, Levy MF, Klintmalm GB:Acute kidney injury following liver transplantation: definition and outcome.Liver Transpl2009,15:475–483.
3. Velidedeoglu E, Bloom RD, Crawford MD, Desai NM, Campos L, Abt PL, Markmann JW, Mange KC, Olthoff KM, Shaked A, Markmann JF:Early kidney dysfunction post liver transplantation predicts late chronic kidney disease.Transplantation2004,77:553–556.
4. Wagener G, Minhaz M, Mattis FA, Kim M, Emond JC, Lee HT:Urinary neutrophil gelatinase-associated lipocalin as a marker of acute kidney injury after orthotopic liver transplantation.Nephrol Dial Transplant2011, 26:1717–1723.
5. Saner FH, Cicinnati VR, Sotiropoulos G, Beckebaum S:Strategies to prevent or reduce acute and chronic kidney injury in liver transplantation.Liver Int2012,32:179–188.
6. Portal AJ, McPhail MJ, Bruce M, Coltart I, Slack A, Sherwood R, Heaton ND, Shawcross D, Wendon JA, Heneghan MA:Neutrophil gelatinase– associated lipocalin predicts acute kidney injury in patients undergoing liver transplantation.Liver Transpl2010,16:1257–1266.
7. Tinti F, Umbro I, Meçule A, Rossi M, Merli M, Nofroni I, Corradini SG, Poli L, Pugliese F, Ruberto F, Berloco PB, Mitterhofer AP:RIFLE criteria and hepatic function in the assessment of acute renal failure in liver transplantation.
Transplant Proc2010,42:1233–1236.
8. Cabezuelo JB, Ramírez P, Ríos A, Acosta F, Torres D, Sansano T, Pons JA, Bru M, Montoya M, Bueno FS, Robles R, Parrilla P:Risk factors of acute renal failure after liver transplantation.Kidney Int2006,69:1073–1080. 9. Paugam-Burtz C, Kavafyan J, Merckx P, Dahmani S, Sommacale D, Ramsay
M, Belghiti J, Mantz J:Postreperfusion syndrome during liver
transplantation for cirrhosis: outcome and predictors.Liver Transpl2009, 15:522–529.
10. Dewitte A, Coquin J, Meyssignac B, Joannès-Boyau O, Fleureau C, Roze H, Ripoche J, Janvier G, Combe C, Ouattara A:Doppler resistive index to reflect regulation of renal vascular tone during sepsis and acute kidney injury.Crit Care2012,16:R165.
11. Stell D, Downey D, Marotta P, Solano E, Khakhar A, Quan D, Ghent C, McAlister V, Wall W:Prospective evaluation of the role of quantitative Doppler ultrasound surveillance in liver transplantation.Liver Transpl 2004,10:1183–1188.
12. Pompili M, Rapaccini GL, De Luca F, Agnes S, Avolio AW, Covino M, Trombino C, Castagneto M, Gasbarrini G:Doppler ultrasonographic evaluation of the early changes in renal resistive index in cirrhotic patients undergoing liver transplantation.J Ultrasound Med1999, 18:497–502.
13. Corradi F, Brusasco C, Vezzani A, Palermo S, Altomonte F, Moscatelli P, Pelosi P:Hemorrhagic shock in polytrauma patients: early detection with renal Doppler resistive index measurements.Radiology2011,260:112–118. 14. Götzberger M, Kaiser C, Landauer N, Dieterle C, Heldwein W, Schiemann U:
Intrarenal resistance index for the assessment of early renal function impairment in patients with liver cirrhosis.Eur J Med Res2008, 13:383–387.
15. Darmon M, Schortgen F, Vargas F, Liazydi A, Schlemmer B, Brun-Buisson C, Brochard L:Diagnostic accuracy of Doppler renal resistive index for reversibility of acute kidney injury in critically ill patients.Intensive Care Med2011,37:68–76.
16. Kirkpatrick AW, Colistro R, Laupland KB, Fox DL, Konkin DE, Kock V, Mayo JR, Nicolaou S:Renal arterial resistive index response to intraabdominal hypertension in a porcine model.Crit Care Med2007,35:207–213. 17. Aschwanden M, Mayr M, Imfeld S, Steiger J, Jaeger KA, Thalhammer C:
Rapid adaptation of the intrarenal resistance index after living donor kidney transplantation.Nephrol Dial Transplant2009,24:1331–1334. 18. Ling Q, Xu X, Li JJ, Chen J, Shen JW, Zheng SS:Alternative definition of
acute kidney injury following liver transplantation: Based on serum creatinine and Cystatin C levels.Transplant Proc2007,39:3257–3260. 19. Orlando R, Mussap M, Plebani M, Piccoli P, De Martin S, Floreani M, Padrini
R, Palatini P:Diagnostic value of plasma cystatin C as a glomerular filtration marker in decompensated liver cirrhosis.Clin Chem2002, 48:850–858.
20. Song S, Meyer M, Türk TR, Wilde B, Feldkamp T, Assert R, Wu K, Kribben A, Witzke O:Serum cystatin C in mouse models: a reliable and precise marker for renal function and superior to serum creatinine.Nephrol Dial Transplant2009,24:1157–1161.
21. Parikh CR, Devarajan P:New biomarkers of acute kidney injury.Crit Care Med2008,36:S159–S165.
22. Mori K, Nakao K:Neutrophil gelatinase-associated lipocalin as the real-time indicator of active kidney damage.Kidney Int2007,71:967–970. 23. Kamada N, Calne RY:Orthotopic liver transplantation in the rat.
Technique using cuff for portal vein anastomosis and biliary drainage.
Transplantation1979,28:47–50.
24. Thalhammer C, Aschwanden M, Mayr M, Koller M, Steiger J, Jaeger KA:Duplex sonography after living donor kidney transplantation: new insights in the early postoperative phase.Ultraschall Med2006,27:141–145.
25. Legrand M, Mik EG, Johannes T, Payen D, Ince C:Renal hypoxia and dysoxia after reperfusion of the ischemic kidney.Mol Med2008, 14:502–516.
26. Platt JF, Marn CS, Baliga PK, Ellis JH, Rubin JM, Merion RM:Renal dysfunction in hepatic disease: early identification with renal duplex Doppler US in patients who undergo liver transplantation.Radiology 1992,183:801–806.
27. Kon V, Sugiura M, Inagami T, Harvie BR, Ichikawa I, Hoover RL:Role of endothelin in cyclosporine-induced glomerular dysfunction.Kidney Int 1990,37:1487–1491.
28. Akgul A, Ibis A, Sezer S, Basaran C, Usluogullari A, Ozdemir FN, Arat Z, Haberal M:Early assessment of renal resistance index and long-term renal function in renal transplant recipients.Ren Fail2009,31:18–24. 29. Kong HY, Zhu SM, Wang LQ, He Y, Xie HY, Zheng SS:Sevoflurane protects
against acute kidney injury in a small-size liver transplantation model.
Am J Nephrol2010,32:347–355.
30. Bellamy MC, Galley HF, Webster NR:Changes in inflammatory mediators during orthotopic liver transplantation.Br J Anaesth1997,79:338–341. 31. Bezinover D, Kadry Z, McCullough P, McQuillan PM, Uemura T, Welker K,
Mastro AM, Janicki PK:Release of cytokines and hemodynamic instability during the reperfusion of a liver graft.Liver Transpl2011,17:324–330. 32. Koelzow H, Gedney JA, Baumann J, Snook NJ, Bellamy MC:The effect of
methylene blue on the hemodynamic changes during ischemia reperfusion injury in orthotopic liver transplantation.Anesth Analg2002, 94:824–829.
33. Hetz H, Bauer M, Lahner D, Faybik P, Winning J, Ankersmit HJ, Bacher A, Krenn CG:Endothelin activation and postoperative renal failure after human liver transplantation.Liver Transpl2005,11:1201–1206.
34. Zarich S, Fang LS, Diamond JR:Fractional excretion of sodium. Exceptions to its diagnostic value.Arch Int Med1985,145:108–112.
35. Carvounis CP, Nisar S, Guro-Razuman S:Significance of the fractional excretion of urea in the differential diagnosis of acute renal failure.
Kidney Int2002,62:2223–2229.
36. Umgelter A, Reindl W, Franzen M, Lenhardt C, Huber W, Schmid RM:Renal resistive index and renal function before and after paracentesis in patients with hepatorenal syndrome and tense ascites.Intensive Care Med 2009,35:152–156.
38. Le Dorze M, Legrand M, Payen D, Ince C:The role of the microcirculation in acute kidney injury.Curr Opin Crit Care2009,15:503–508.
39. Park Y, Hirose R, Dang K, Xu F, Behrends M, Tan V, Roberts JP, Niemann CU: Increased severity of renal ischemia reperfusion injury with venous clamping compared to arterial clamping in a rat model.Surgery2008, 143:243–251.
40. Benes J, Chvojka J, Sykora R, Radej J, Krouzecky A, Novak I, Matejovic M: Searching for mechanisms that matter in early septic acute kidney injury: an experimental study.Crit Care2011,15:R256.
doi:10.1186/1471-2369-14-55
Cite this article as:Konget al.:Intrarenal resistance index for the assessment of acute renal injury in a rat liver transplantation model. BMC Nephrology201314:55.
Submit your next manuscript to BioMed Central and take full advantage of:
• Convenient online submission
• Thorough peer review
• No space constraints or color figure charges
• Immediate publication on acceptance
• Inclusion in PubMed, CAS, Scopus and Google Scholar
• Research which is freely available for redistribution