R E S E A R C H A R T I C L E
Open Access
Evaluation of the Propensity score methods for
estimating marginal odds ratios in case of small
sample size
Romain Pirracchio
1,2, Matthieu Resche-Rigon
1and Sylvie Chevret
1*Abstract
Background:Propensity score (PS) methods are increasingly used, even when sample sizes are small or treatments are seldom used. However, the relative performance of the two mainly recommended PS methods, namely PS-matching or inverse probability of treatment weighting (IPTW), have not been studied in the context of small sample sizes. Methods:We conducted a series of Monte Carlo simulations to evaluate the influence of sample size, prevalence of treatment exposure, and strength of the association between the variables and the outcome and/or the treatment exposure, on the performance of these two methods.
Results:Decreasing the sample size from 1,000 to 40 subjects did not substantially alter the Type I error rate, and led to relative biases below 10%. The IPTW method performed better than the PS-matching down to 60 subjects. When N was set at 40, the PS matching estimators were either similarly or even less biased than the IPTW estimators. Including variables unrelated to the exposure but related to the outcome in the PS model decreased the bias and the variance as compared to models omitting such variables. Excluding the true confounder from the PS model resulted, whatever the method used, in a significantly biased estimation of treatment effect. These results were illustrated in a real dataset. Conclusion:Even in case of small study samples or low prevalence of treatment, PS-matching and IPTW can yield correct estimations of treatment effect unless the true confounders and the variables related only to the outcome are not included in the PS model.
Keywords:Propensity scores, Propensity score matching, Inverse probability weighting, Small sample size, Simulation
Background
In non-randomized studies, any estimated association between treatment and outcome can be biased because of the imbalance in baseline covariates that may affect the outcome. In this context, propensity score methods (PS) [1] are increasingly used to estimate marginal causal treatment effect. The propensity score, as defined by Rosenbaum and Rubin [1] is the individual probability of receiving the treatment of interest conditional on the observed baseline covariates. It has been demonstrated that, within the strata of subjects matched on the propen-sity score, distributions of these covariates tend to be simi-lar between treated and untreated [1]. Therefore,
conditioning on the propensity score allows to draw unbiased marginal estimates of treatment effects [1].
Four methods of using the propensity score have been so far described: stratification [1,2], adjustment [1,2], matching [1-4] and more recently inverse probability of treatment weighting (IPTW) [3,5-9]. Using an empirical case study and Monte Carlo simulations, several authors [8,10] recently showed that the PS-matching and the IPTW more efficiently reduced the imbalance in baseline covariates than the two other methods did. However, these methods were evaluated using large simulated data-sets of about 10,000 observations, and roughly balanced treatment groups [10]. From a practical point of view, if propensity scores have usually been applied to large obser-vational cohorts [11-13], they have been also used in the setting of small samples [14,15] or with important imbal-ances in the treatment allocation, as observed, for
* Correspondence:[email protected]
1Service de Biostatistique et Information Médicale, Hôpital Saint-Louis,
UMR-S717 Inserm ; Sorbonne Paris Cité, Université Paris Diderot, 1 avenue Claude Vellefaux, Paris 75010, France
Full list of author information is available at the end of the article
instance, when estimating the benefit of intensive care unit (ICU) admission [16].
Although PS-matching and IPTW have not been evalu-ated in the context of small sample sizes, such a situation raises specific questions. First, because the propensity score is used to balance baseline covariates more than to predict treatment assignment, it has been recommended [17-19] to include in the PS model all the potential con-founders and to avoid any selection procedure based on the goodness-of-fit [19,20]. However, the limited sample size restricts the number of variables to be included in the PS regression model to limit modelover parameterization. Moreover, in case of small sample sizes, it is not clear whether one PS method, i.e. PS matching or IPTW, out-performs the other or not, considering, on one hand, that matching without replacement might lead to a further de-crease in the sample size (and thus, in the statistical power of outcome comparisons), and, on the other hand, that IPTW might give an excessive weight to some observa-tions that could dramatically influence the results. All these points could be similarly addressed in case of im-portant imbalances in the size of the treatment arms. Therefore, our goal was to explore such specific situations in order to provide some warnings concerning the use of PS methods, for analysts, but also for readers.
Actually, we assessed the performance of PS-matching and IPTW in the particular context of small samples, when the odds ratio (OR) is used as the measure of treatment effect. We present the results of Monte Carlo simulations in which we studied the influence of the sample size, the prevalence of treated patients, and the strength of the association between the variables and the outcome and/or the treatment exposure, in order the as-sess the accuracy of PS methods in terms of bias, vari-ance estimation and Type I error rates in the estimation of treatment effect. Finally, some illustration is provided from a real observational dataset, assessing the benefit of allogeneic stem cell transplantation in a small sample of patients with multiple myeloma.
Methods
Monte carlo simulation study
Monte Carlo simulations were used to evaluate the per-formance of PS-matching and IPTW to estimate the mar-ginal OR of treatment effect in the context of small sample sizes and/ or low prevalence of the treated population. They consisted in (1) randomly generated N independent data-sets in several settings defined by sample size, treatment ef-fect and covariates efef-fect on both treatment and outcome; (2) applying the PS-matching and IPTW approaches to analyze the data, separately. In each setting, the perform-ance of each approach was assessed by computing the bias, the mean squared error (MSE) and the variance of the
estimated OR from the N replications of the dataset. Type I and Type II error rates, as defined by the frequency of rejecting the null or alternative hypothesis under the null or the alternative, respectively, were also estimated.
Data-generating process
Let Z be the variable defining treatment allocation (Z = 1 for the treated, 0 otherwise), Y be the outcome of interest (Y = 1 for those subject who experienced the outcome, 0 otherwise) and X a set of 4 independent and identically distributed baseline covariates Xj;j¼1;. . .;4
.
The probability of allocated treatment and that of experiencing the outcome were described by the two fol-lowing logistic models, respectively:
logit P Zð ð i¼1jXiÞÞ ¼α0þα1Xi1þ. . .þα4Xi4 ð1Þ
logit P Yð ð i¼1jZi;XiÞÞ ¼β0þβTZiþβ1Xi1þ. . .
þβ4Xi4 ð2Þ
where Zi was the treatment assignment for subject i,
α0;. . .;α4
ð Þand β0;βT;. . .;β4 the sets of correspond-ing slope and regression coefficients. Regression
coeffi-cients allowed considering different situations of
covariate association with the treatment and the out-come: X1 did not affect any of them (α1=β1= 0), X2was
associated only with the outcome (α2= 0,β2= b),X3 only
with the treatment (α3= a,β3= 0), andX4 with both as a
true confounder (α4= a,β4= b).
The value of the intercept α0 was successively set at 0
and −1.38 to guarantee a marginal probability of treat-ment allocation of 0.50 and 0.2, respectively. For each set of values of (βT, a, b), the value ofβ0was determined
by a minimization algorithm from a sample of 1,000,000 in order to guarantee the outcome to occur in 50 per cent of subjects, approximately.
For each subject, treatment allocation and outcome were randomly generated from Bernoulli distributions with subject-specific probability of treatment assignment derived from equation (1) or equation (2), as the success probability, respectively. Each covariate was randomly generated from a Normal distribution N(μ= 0,σ= 0.5).
Several situations were examined, that differed in terms of:
– Sample size, ranging from 1,000 down to 40 (1000, 900, 800, 700, 600, 500, 400, 300, 200, 180, 160, 140, 120, 100, 80, 60, 40)
– Treatment effectβT, successively fixed at 0 (null hypothesis), 0.41 and 0.92 (alternative hypotheses of moderate or strong treatment effect) corresponding to conditional ORs fixed at 1, 1.5 and 2.5, respectively – Strength of the association between the covariates
b fixed at 0.41 and 0.92, corresponding to moderate and strong association, respectively.
Analysis of simulated data sets
Propensity score models
The propensity score models the probability that a given patient would be exposed to the experimental treatment, conditionally to his(her) baseline covariates [1]:
logit P Zð ð ¼1jVÞÞ ¼β^V ð3Þ
where^βis the maximum likelihood estimator of the base-line covariate effects, and V is the vector of covariates included in the model. Eight models were examined according to the vector V: 3 univariable models with either one of the covariates X2, X3, X4 (models 1, 2, 3,
respectively), 3 bivariate models (X2,X3), (X2,X4) and (X3, X4) (models 4, 5, 6, respectively), one 3-covariate model
with X2, X3, X4(model 7) and finally the full model with X1, X2, X3, X4(model 8).
The propensity score (PSi) of the patient i was then
estimated from the predicted probability of treatment given his(her) covariates as obtained by logistic regres-sion. The PS-matching method was used because it has been proposed as a reference method when using pro-pensity score [10]. However, because it has been demon-strated that this approach may not be strictly unbiased to estimate a marginal OR [21], we also applied the IPTW approach which has been shown to be unbiased for estimating marginal ORs [22].
Propensity score based matching
Different types of matching algorithms have been pro-posed [23,24]. We used 1–1 matching without replace-ment. Each treated subject was randomly selected and then matched to the nearest untreated subject based on calipers of width of 0.2 of the standard deviation of the logit of the PS, as previously recommended [23,24].
Inverse-probability-of-treatment weighting
Each subject was weighted in the likelihood using the inverse estimated probability of treatment actually admi-nistered,zi, as follows [6]:
IPTWi¼
zi
PSiþ
1zi
1PSi ð
4Þ
Note that, for treated subjects (zi= 1),IPTWi¼PS1i ,
while for untreated (zi= 0),IPTWi¼11PSi.
Treatment effect estimates
In each simulated dataset, the benefit of treatment on the outcome was first estimated by fitting a logistic model applied to the PS-matched dataset using general-ized estimating equations with robust variance estimator
(package gee for R, Vincent J Carey, Thomas Lumley
and Brian Ripley). Then, a weighted logistic model using a generalized linear model adapted to data from a com-plex survey design, with inverse-probability weighting and design-based standard errors applied (package
svyGLMfor R, Thomas Lumley).
Model performance criteria
A total of 7,300 independent datasets – generated as described above – was required to detect a difference in type I error of at least 0.005 as compared to 0.05 with a power of 95%. The performance of each of the 8 PS models was evaluated from those 7,300 simulated sets using the following criteria: type I error, statistical power, absolute and relative biases from the marginal OR (%) and mean square error (MSE). Type I error and statistical power were estimated by the proportions of true and false null hypoth-eses that were rejected, respectively. MSE was computed by the average of the squares of the differences between the estimate and the true value fixed by simulation.
All simulations and statistical analyses were performed using R software version 1.10.1 (http://www.R-project. org) running on a Linux platform.
Results
Simulation results
Full fitted models
To evaluate the impact of small sample sizes on estima-tion, we first fitted a non-parsimonious PS model, including all the four baseline covariates (model 8).
When using the PS-matching approach, the mean number of pairs ranged from 21.2 to 22.6 (i.e., from 53.0 to 56.5% of the sample) for 40 patients and increased up to 370.0 - 421.2 (74.0-84.2%) for 500 patients.
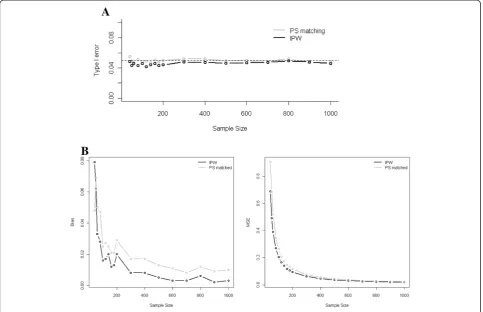
Under the null hypothesis, no substantial increase in the Type I error rate was observed as the sample size decreased from 1,000 down to 40 subjects. As shown in Figure 1 (Panel A), for a treatment effect and a strength of the association between the covariates and the outcome both set at a strong level, and a marginal prevalence of the treatment at 0.5, the Type I error rate ranged from 0.039 to 0.052 for PS matching, and from 0.036 to 0.047 for IPTW. The Type I error rate was not markedly affected by the strength of the association between the covariates and the treatment/outcome (Table 1), nor by treatment preva-lence, decreasing from 0.5 down to 0.2 (data not shown).
IPTW estimations were systematically less biased and MSE smaller than those reached by PS-matching. Similar results were found in case of low prevalence of the treatment.
When the strength of the association between the cov-ariates and the treatment/outcome decreased, IPTW estimators remained similarly or even less biased than PS-matching estimators, down to 60 subjects (Table 1). However, when the sample size was set at 40, the PS-matching estimators outperformed better than the IPTW estimators.
Whatever the method, the reduction of treatment ef-fect (with OR decreasing from 2.5 to 1.5) was associated with a global decrease in the bias and the MSE, but with similar relative bias (data not shown). In this situation, the largest bias was observed for both methods when the number of subjects decreased to less than 60 (IPTW: relative bias: 8.1%, MSE: 0.675; PS-matching: relative bias: 7.6%, MSE: 0.933).
As expected, the variance in the estimation of treatment effect increased monotonically while the sample size decreased. The variances of the IPTW estimators were
systematically smaller than the variances of the PS estima-tors. For both methods and whatever the treatment effect, the smallest variance was observed when baseline covari-ates were strongly associated to the outcome, but moder-ately to treatment.
Selected fitted models
When the simulations were fitted using PS-models that included at least X4, no substantial increase in the Type
I error rate was observed as the sample size decreased from 1,000 to 40 subjects whatever the strength of the association between the covariates, the treatment and the outcome. However, when removing the true con-founder from the PS model, the Type I error rate sub-stantially increased to a maximum obtained for the IPTW method, in case of strong association between the two remaining covariates, the treatment and the out-come (Table 2). Moreover, the IPTW method seems always more conservative than the PS-matching.
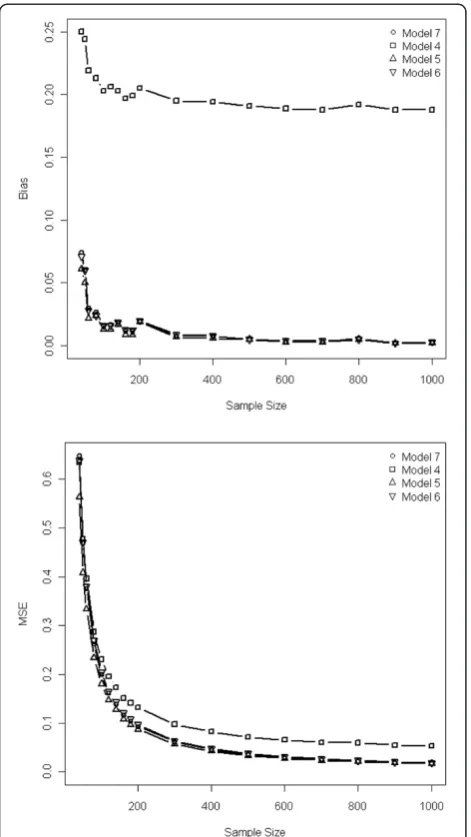
In case of strong treatment effect, variables included in the PS model affected the bias and the MSE:
inclusion of the true confounder systematically implied a bias larger than 10%; moreover the inclusion of variables unrelated to the treatment allocation but related to the outcome allowed to achieve less biased results than that of variables related to treatment but unrelated to the out-come (Table 2 & Figure 2). Such impact on bias was more important with IPTW than with PS-matching (Table 2), and when the covariates and the treatment/outcome were strongly rather than moderately associated. The bias, var-iances and MSE of the IPTW estimators were systematic-ally smaller than those of the PS estimators. Similar trends were found when the treatment effect was moderate, but the absolute values of both biases and MSE were smaller than those observed with a strong treatment effect.
The variance of the estimated treatment effect decreased when the true confounder or covariate unrelated to the treatment but related to the outcome were included in the PS, especially with the IPTW method (Table 2). Adding to model 5 (including true confounder + variable related to the outcome) a variable related to treatment allocation
(model 7) did not reduce the bias, but increased the variance of the estimation. Moreover, adding to the PS model a variable related neither to the treatment nor to the outcome (model 8), did not further improve the precision of the estimation, but increased the variance, especially when the sample size decreased below 100.
Similar results than those observed using a non-parsimonious PS model, were found when the marginal prevalence of the treatment decreased from 0.5 to 0.2.
For both IPTW and PS-matching methods, the min-imally biased estimation was obtained by incorporating in the PS model, as well as true confounders, variables strongly associated to the outcome but moderately asso-ciated to the treatment.
Illustration to a real observational dataset
To illustrate these results, we then applied the PS methods described above in a real situation, where we aimed at evaluating the benefit of sequential autologous-allogeneic tandem approach in Multiple Myeloma (MM), using a
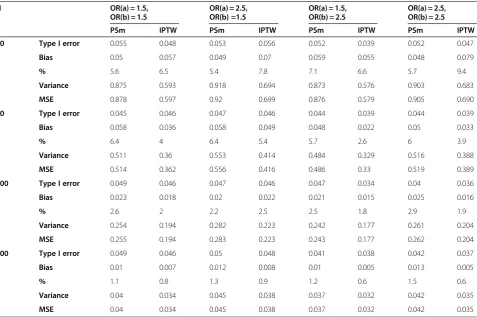
Table 1 Type I errors, Bias and Mean Square Error (MSE) for non parsimonious PS model according to the method used (PS matching (PSm) or IPTW) and to the strength of the association between baseline covariates, treatment/ outcome
N OR(a) = 1.5,
OR(b) = 1.5
OR(a) = 2.5, OR(b) =1.5
OR(a) = 1.5, OR(b) = 2.5
OR(a) = 2.5, OR(b) = 2.5
PSm IPTW PSm IPTW PSm IPTW PSm IPTW
40 Type I error 0.055 0.048 0.053 0.056 0.052 0.039 0.052 0.047
Bias 0.05 0.057 0.049 0.07 0.059 0.055 0.048 0.079
% 5.6 6.5 5.4 7.8 7.1 6.6 5.7 9.4
Variance 0.875 0.593 0.918 0.694 0.873 0.576 0.903 0.683
MSE 0.878 0.597 0.92 0.699 0.876 0.579 0.905 0.690
60 Type I error 0.045 0.046 0.047 0.046 0.044 0.039 0.044 0.039
Bias 0.058 0.036 0.058 0.049 0.048 0.022 0.05 0.033
% 6.4 4 6.4 5.4 5.7 2.6 6 3.9
Variance 0.511 0.36 0.553 0.414 0.484 0.329 0.516 0.388
MSE 0.514 0.362 0.556 0.416 0.486 0.33 0.519 0.389
100 Type I error 0.049 0.046 0.047 0.046 0.047 0.034 0.04 0.036
Bias 0.023 0.018 0.02 0.022 0.021 0.015 0.025 0.016
% 2.6 2 2.2 2.5 2.5 1.8 2.9 1.9
Variance 0.254 0.194 0.282 0.223 0.242 0.177 0.261 0.204
MSE 0.255 0.194 0.283 0.223 0.243 0.177 0.262 0.204
500 Type I error 0.049 0.046 0.05 0.048 0.041 0.038 0.042 0.037
Bias 0.01 0.007 0.012 0.008 0.01 0.005 0.013 0.005
% 1.1 0.8 1.3 0.9 1.2 0.6 1.5 0.6
Variance 0.04 0.034 0.045 0.038 0.037 0.032 0.042 0.035
MSE 0.04 0.034 0.045 0.038 0.037 0.032 0.042 0.035
small observational dataset [15]. Twenty-three patients (median age 48 years, range 26–59 years) with relapsed multiple myeloma (MM) who received the treatment under study were compared to a control group of 142 MM relaps-ing patients free of such a treatment (median age 51.5 years, range 25–65 years). Hence, this dataset combined the two situations of relatively small sample size (n = 165) and very low prevalence of treatment (23/165, 14%). We used the survival status at 24 months as the outcome measure, with benefit of treatment measured on ORs.
Three baseline variables, related to treatment allocation, to the outcome or to both of them, were available at base-line: 1) age at diagnosis, only associated with treatment allocation (with untreated patients more likely to be older than treated; p = 0.05), 2) beta2 microglobulin level≥3.5, only moderately associated with the outcome OR = 1.8 (95%CI 0.9;3.5 , p = 0.10), and 3) time elapsed since the first line treatment at relapse, strongly associated with both the treatment allocation OR = 0.4 (95%CI 0.2;0.8 , p = 0.01) and to the outcome OR = 0.4 (95%CI 0.2;0.7 , p = 0.002). Of note, log time was considered instead of the time to insure the validity of logistic models.
In this situation, we applied the matched and PS-weighted (IPTW) approaches, when PS incorporated the baseline information separately. Results are summarized in Table 3. As expected by the simulation results, the choice of the variable included in the PS model heavily impacted the estimation of treatment effect, and this was even more pronounced when using the IPTW-weighted estimator than the PS-matched estimator. In-deed, consistently with the simulation findings, including only the variable related to the treatment, e.g. age at diagnosis, yielded estimates different than that obtained
by including only the true confounder, namely time
elapsed since the first line treatment at relapse.
If we assumed from the former simulation results that the model including the variable related to the outcome and the true confounder (namely, the beta2 microglobu-lin level and the time elapsed since the first line treat-ment at relapse) was the optimal model, results were concordant with those obtained by simulation. Hence, the results obtained by including only the true confoun-der were very close to the former in terms of estimates and variance. Omitting from the PS model either the
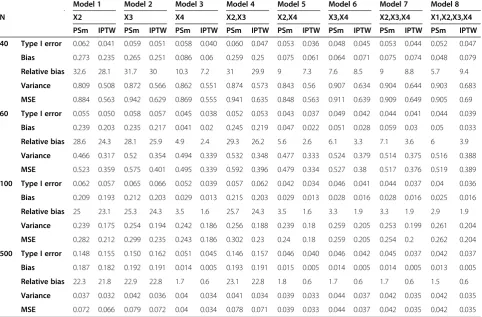
Table 2 Bias and variance of the estimated treatment effect for the different selected PS models and according to the method used (PS matching or IPTW)
Model 1 Model 2 Model 3 Model 4 Model 5 Model 6 Model 7 Model 8
N X2 X3 X4 X2,X3 X2,X4 X3,X4 X2,X3,X4 X1,X2,X3,X4
PSm IPTW PSm IPTW PSm IPTW PSm IPTW PSm IPTW PSm IPTW PSm IPTW PSm IPTW
40 Type I error 0.062 0.041 0.059 0.051 0.058 0.040 0.060 0.047 0.053 0.036 0.048 0.045 0.053 0.044 0.052 0.047
Bias 0.273 0.235 0.265 0.251 0.086 0.06 0.259 0.25 0.075 0.061 0.064 0.071 0.075 0.074 0.048 0.079
Relative bias 32.6 28.1 31.7 30 10.3 7.2 31 29.9 9 7.3 7.6 8.5 9 8.8 5.7 9.4
Variance 0.809 0.508 0.872 0.566 0.862 0.551 0.874 0.573 0.843 0.56 0.907 0.634 0.904 0.644 0.903 0.683
MSE 0.884 0.563 0.942 0.629 0.869 0.555 0.941 0.635 0.848 0.563 0.911 0.639 0.909 0.649 0.905 0.69
60 Type I error 0.055 0.050 0.058 0.057 0.045 0.038 0.052 0.053 0.043 0.037 0.049 0.042 0.044 0.041 0.044 0.039
Bias 0.239 0.203 0.235 0.217 0.041 0.02 0.245 0.219 0.047 0.022 0.051 0.028 0.059 0.03 0.05 0.033
Relative bias 28.6 24.3 28.1 25.9 4.9 2.4 29.3 26.2 5.6 2.6 6.1 3.3 7.1 3.6 6 3.9
Variance 0.466 0.317 0.52 0.354 0.494 0.339 0.532 0.348 0.477 0.333 0.524 0.379 0.514 0.375 0.516 0.388
MSE 0.523 0.359 0.575 0.401 0.495 0.339 0.592 0.396 0.479 0.334 0.527 0.38 0.517 0.376 0.519 0.389
100 Type I error 0.062 0.057 0.065 0.066 0.052 0.039 0.057 0.062 0.042 0.034 0.046 0.041 0.044 0.037 0.04 0.036
Bias 0.209 0.193 0.212 0.203 0.029 0.013 0.215 0.203 0.029 0.013 0.028 0.016 0.028 0.016 0.025 0.016
Relative bias 25 23.1 25.3 24.3 3.5 1.6 25.7 24.3 3.5 1.6 3.3 1.9 3.3 1.9 2.9 1.9
Variance 0.239 0.175 0.254 0.194 0.242 0.186 0.256 0.188 0.239 0.18 0.259 0.205 0.253 0.199 0.261 0.204
MSE 0.282 0.212 0.299 0.235 0.243 0.186 0.302 0.23 0.24 0.18 0.259 0.205 0.254 0.2 0.262 0.204
500 Type I error 0.148 0.155 0.150 0.162 0.051 0.045 0.146 0.157 0.046 0.040 0.046 0.042 0.045 0.037 0.042 0.037
Bias 0.187 0.182 0.192 0.191 0.014 0.005 0.193 0.191 0.015 0.005 0.014 0.005 0.014 0.005 0.013 0.005
Relative bias 22.3 21.8 22.9 22.8 1.7 0.6 23.1 22.8 1.8 0.6 1.7 0.6 1.7 0.6 1.5 0.6
Variance 0.037 0.032 0.042 0.036 0.04 0.034 0.041 0.034 0.039 0.033 0.044 0.037 0.042 0.035 0.042 0.035
MSE 0.072 0.066 0.079 0.072 0.04 0.034 0.078 0.071 0.039 0.033 0.044 0.037 0.042 0.035 0.042 0.035
true confounder or the variable related to the outcome substantially modified the estimation of treatment effect.
Moreover, as demonstrated in the simulation study, adding to the PS model variables only related to the treatment allocation (that is, models with age, beta2 microglobulin level and time to relapse) led to a larger variance in the estimation of the treatment effect, espe-cially when using a PS-matching approach.
Finally, if considering the recommended strategy defined above, that is, only using covariates strongly associated with the outcome in the PS, the conclusion was somewhat concordant whatever the approach.
Discussion
Propensity score methods have been widely studied to analyze very large datasets [11-13]. However, although originally developed in epidemiological settings with large sample sizes, they are increasingly being used to estimate causal treatment effects in clinical settings, where sample sizes are rather limited as compared to the former settings. Actually, while the former epidemio-logical settings deal with thousands of patients, the clin-ical setting usually have to deal with at most several hundred patients, or even less than 50 [14,15]. However, only a few publications have addressed the issue of PS properties in such a situation [25]. Thus, the aim of this study was to get further insights into their performances when either the sample sizes or the prevalence of expos-ure are rather low, and to address the question of the variables to include in the PS model in such situations.
To answer those questions, we used the 2 main recom-mended PS approaches [11-13], namely the PS-matching and IPTW. The large use of PS matching was confirmed by a PubMed search (performed on October, 2010) that selected 521 references dealing with PS matching from a whole set of 2,045 PS references. By contrast, only 64 references dealt with IPTW or PS-weighted approaches, and this could be explained because they have been more recently promoted, and appear more complex to use than PS-matching. Other PS approaches have been developed
Table 3 Estimated odds ratios (OR) of death and 95% confidence interval using naive, propensity score matching, or IPTW approaches
Model Adjustment in the original set PS-matched sample IPT-Weighted sample
Covariates OR (95%CI) p-value No pairs OR (95%CI) p-value Sum of weights OR (95%CI) p-value
X1 = age 0.44 (0.14;1.42) p = 0.17 22 0.27 (0.06;1.23) p = 0.091 327.5 0.39 (0.11;1.32) p = 0.13
X2 = beta2micro 0.47 (0.15;1.47) p = 0.19 23 0.27 (0.05;1.41) p = 0.12 330.0 0.48 (0.14;1.65) p = 0.25
X3 = time to relapse 0.24 (0.07;0.84) p = 0.026 23 0.19 (0.05;0.65) p = 0.0088 349.1 0.27 (0.08;0.92) p = 0.039
X1 + X2 0.49 (0.15;1.57) p = 0.23 22 0.48 (0.09;2.58) p = 0.39 317.9 0.41 (0.12;1.36) p = 0.15
X1 + X3 0.22 (0.06;0.85) p = 0.028 18 0.20 (0.03;1.17) p = 0.073 456.0 0.23 (0.05;1.00) p = 0.052
X2 + X3 0.26 (0.07;0.93) p = 0.039 23 0.19 (0.05;0.68) p = 0.011 340.8 0.26 (0.08;0.86) p = 0.028
X1 + X2 + X3 0.24 (0.06;0.93) p = 0.040 20 0.41 (0.08;2.1) p = 0.28 432.1 0.21 (0.05;0.86) p = 0.031
such as PS adjustment [1,2] or PS-quintile stratification [1,2] but they have been shown of less performance in large samples. Thus, it appeared unlikely that they would perform better in the context of small sample size or low prevalence of exposure.
Based on a simulation study, we showed that no sub-stantial increase in the Type I error rate was observed as the sample size decreased from 1,000 to 40 subjects, but that small sample sizes lead to biased estimations of the
marginal treatment effect. However, relative bias
remained inferior to 10%, even with small sample down to 40 patients. Of note, in case of small sample sizes down to 60 subjects, IPTW method seems to perform always better than the PS-matching. Such results could have been expected as IPTW method preserves the sam-ple size all along the analysis process and maximizes the available amount of information as compared to PS-matching. On the contrary, 1:1, without replacement matching procedures are associated with a reduction in the sample size, as all treated usually cannot find a non-treated to be matched with. Hence, because the weighted dataset is generally larger than the matched dataset, the variance and the confidence intervals associated with the IPTW estimations are expected to be smaller. However, when N was set at 40, the PS-matching estimators were either similarly or even less biased than the IPTW esti-mators. One possible explanation is that, in case of very small samples, the weighting resulted in a significant dis-tortion of the population, with excessive weights given to marginal subjects. This was illustrated in the real dataset where the sum of weights was sometimes far above the actual sample size. However, this could be addressed by using stabilized weights, as previously reported [26]. We thus reran the analyses using such sta-bilized weights, but in our case, stabilization did not affect the results (data not shown).
The second question addressed in this study was the selection of the covariates to be included in the PS model, in case of small sample sizes. Previous simulation studies have addressed different questions concerning the choice of the variables to be included in the PS model, such as the effect of omitting confounding variables when using quintile-stratified propensity adjustment in longitudinal studies [27], or the relative performances of PS models when including variables related to treatment allocation, variables related to outcome or all variables related to either outcome or treatment or neither [28]. However, data concerning appropriate PS models when dealing with limited sample sizes are still lacking. Indeed, while it is usually recommended [17-19] to include in the PS model all the potential confounders, this could lead toover para-meterizedPS models when the number of treated is lim-ited. On the other hand, it has been previously reported that PS model misspecification could highly influence the
estimation [25,27]. Therefore, in the context of small sam-ple sizes, one might consider preferable to apply some variable selection procedure, but it seems crucial to adequately choose those variables to be included in the PS model. To do so, it has previously been shown that, because the goal of a PS model is to efficiently control confounding, but not to predict treatment or exposure, the use of selection procedure based on the goodness-of-fit cannot be recommended [19,20,25]. As previously reported [17,25], we found that the inclusion in the PS model of variables unrelated to the exposure but related to the outcome is mandatory. Indeed, consistently with the results published by Brookhart et al. [25], we found that the inclusion of such variables decreased both the bias and the variance of the estimated treatment effect. We also found that excluding the true confounder from the PS model resulted, whatever the method used, in a signifi-cantly biased estimation of treatment effect. These results are not in line with the advices provided by Brookhart et al. [25]. Indeed, the latter authors suggested that includ-ing in the PS model a true confounder that is only weakly related to the outcome, but very strongly related to the exposure might result in a loss in efficiency that is not off-set by a large enough decrease in bias. Our different results might be otherwise explained by the fact that our simulation study did not explore a situation where the true confounder is very strongly related to the exposure but only very weakly to the outcome.
We measured the performance of each approach using type I error, power, bias and MSE estimated from inde-pendent replicates of simulated datasets. However, in practice, the accurate way to evaluate the performance of a PS procedure relies on the assessment of its ability to reach conditional exchangeability between groups, as recommended by Austin [4,29]. Balance is commonly measured on standardized differences, though permuta-tion tests have been also reported as an interesting alter-nate way of evaluation. Indeed, such tests tend reject when bias due to inexact propensity matching is enough to undermine causal inferences, and tend not to reject when that bias is small enough to be ignored, could be used instead [30].
been and compared to the former methods in the context of small sample sizes. Further simulation studies should be performed to compare the performances of the 4 meth-ods in the context of small sample size.
For the PS matching, we used a classical pair matching procedure, based on a caliper defined as 0.2SD of the logit of the PS. This was chosen as the mostly used matching method in clinical settings [31], while that caliper width was recommended on the basis of simulation results [23,32]. However, several other matching procedures could have been proposed that may offer interesting advantages over the former, notably in the context of small sample sizes [33]. Otherwise,data-adaptive algorithms such as ridge matching have been also reported to perform better than
“classical” pair matching [34]. Nevertheless, evaluating the matching algorithm was not the goal of this paper, though its importance deserves to be the focus of a specific simula-tion study. This should be the framework of further studies. We did not consider other model misspecifications but those regarding the PS model. Indeed, in the class of IPW estimators, it is well known that the weighted mators are consistent provided that the model for esti-mating the PS is correctly specified. Otherwise, to relax this restriction, so-called doubly-robust estimators have been proposed [8], that also require the specification of the outcome regression model. Misspecifications may consist in choosing the wrong link function, or selecting a linear instead of a non-linear predictor. In case of model misspecification, the mean square error of esti-mate has been shown to be reduced by using the match-ing estimator, both for small-to-moderate sample sizes [35]. Further work in this topic may be of interest.
The choice of the odds ratio as a measure of treatment effect has been debated. Indeed, the choice of the appro-priate PS based estimators for conditional and marginal non-linear treatment effects has been thoroughly dis-cussed in the recent literature [21,36-38]. Actually, the problem with OR, usually described as non-collapsibility, refers to the fact that conditional and marginal effects might differ unless the true effect is null [21,39,40]. More-over, Austin et al. [23] have previously shown that PS-matching, as compared to PS-stratification or -adjustment, offers substantially less biased estimates of both tional and marginal OR. The choice to control the condi-tional treatment effect rather than the marginal as proposed by Austin [23] was driven by our wish to achieve a probability of 0.50 of experiencing the outcome and to maximize the statistical power considering the small sam-ple size. The resulting marginal treatment effect was thereafter estimated using a second simulation study of sample size 1,000,000 that confirmed that conditional and marginal treatment effects were in the same range. Other-wise, previous simulations studies support the use of IPTW estimators as approximately unbiased estimators of
marginal odds ratios [22,38]. The choice of a binary out-come and the use of an adapted and largely applied regres-sion model were motivated by our will to overcome a biostatistical issue that has been raised by one of our clin-ical question.
Finally, the choice of an event rate of 0.5 could be debated. Indeed, the prevalence of event may be far from 0.5 in clinical situations. However, we chose a prevalence of 0.5 because our goal was to assess the effects of decreasing the sample size. Then, when dealing with sam-ple size of 40–60 patients, an even rate of 0.1-0.2 would have been associated with a very small number of events, and a high risk of model misspecification. To confirm this assumption, we reran the simulation using an event rate fixed at 0.2. As expected, decreasing the event rate down to 0.2 was associated for both methods with unacceptable increases in variance and MSE, when the sample size was ≤100 (variance ranging from 1.294 to 177.4; MSE ranging from 1.309 to 177.4).
Conclusions
In conclusion, this simulation study revealed that, even in case of small study samples or low prevalence of treat-ment, both propensity score matching and inverse prob-ability of treatment weighting can yield unbiased estimations of treatment effect. However, in such situa-tions, a particular attention should be paid to the choice of the variables to be included in the PS model. The opti-mal model seems to be that including the true confounder and the variable related only to the outcome, although reporting several models as a sensitivity analysis may ap-pear a good way of arguing for or against the robustness of the estimated effects. Future work in this area should aim at providing for the clinicians: (1) formal rules to choose the best approach between matching and weight-ing accordweight-ing to the population characteristics, (2) prac-tical strategies to select the variables for inclusion in a propensity score model in case of small study samples or low treatment prevalence.
Abbreviations
PS: propensity score; IPTW: inverse probability of treatment weighting; MSE: mean squared error; GMM: Generalized methods of moments; OR: odds ratio; MM: multiple myeloma; 95CI: 95% Confidence interval.
Competing interests
The authors declare that they have no competing interests.
Authors’contribution
RP and MRR performed the analysis and wrote the manuscript, SC supervised the analysis and the elaboration of the manuscript. All authors read and approved the final manuscript.
Author details 1
Received: 7 September 2011 Accepted: 21 April 2012 Published: 30 May 2012
References
1. Rosenbaum P, Rubin D:The central role of the propensity score in observational studies for causal effects.Biometrika1983,70:41–45. 2. Rosenbaum P, Rubin D:Reducing bias in observational studies using
sub-classification on the propensity score.J Am Stat Assoc1984,79:516–524. 3. D'Agostino RB Jr:Propensity score methods for bias reduction in the
comparison of a treatment to a non-randomized control group.Stat Med
1998,17(19):2265–2281.
4. Austin PC:A critical appraisal of propensity-score matching in the medical literature between 1996 and 2003.Stat Med2008,27(12):2037–2049. 5. Rosenbaum P:Model-Based Direct Adjustement.J Am Stat Assoc1987,82
(398):387.
6. Robins JM, Hernan MA, Brumback B:Marginal structural models and causal inference in epidemiology.Epidemiology2000,11(5):550–560. 7. Joffe MM, Ten Have TR, Feldman HI, Kimmel SE:Model selection,
confounder control, and marginal structural models: review and new applications.The American Statistician2004,58:272–279.
8. Lunceford JK, Davidian M:Stratification and weighting via the propensity score in estimation of causal treatment effects: a comparative study.Stat Med2004,23(19):2937–2960.
9. Kurth T, Walker AM, Glynn RJ, Chan KA, Gaziano JM, Berger K, Robins JM: Results of multivariable logistic regression, propensity matching, propensity adjustment, and propensity-based weighting under conditions of nonuniform effect.Am J Epidemiol2006,163(3):262–270. 10. Austin PC:The relative ability of different propensity score methods to
balance measured covariates between treated and untreated subjects in observational studies.Med Decis Making2009,29(6):661–677.
11. Rubin DB:Estimating causal effects from large data sets using propensity scores.Ann Intern Med1997,127(8 Pt 2):757–763.
12. Wijeysundera DN, Beattie WS, Austin PC, Hux JE, Laupacis A:Epidural anaesthesia and survival after intermediate-to-high risk non-cardiac surgery: a population-based cohort study.Lancet2008,372(9638):562–569. 13. Park DW, Seung KB, Kim YH, Lee JY, Kim WJ, Kang SJ, Lee SW, Lee CW, Park SW,
Yun SC,et al:Long-term safety and efficacy of stenting versus coronary artery bypass grafting for unprotected left main coronary artery disease: 5-year results from the MAIN-COMPARE (Revascularization for Unprotected Left Main Coronary Artery Stenosis: Comparison of Percutaneous Coronary Angioplasty Versus Surgical Revascularization) registry.J Am Coll Cardiol
2010,56(2):117–124.
14. Fernandez-Nebro A, Olive A, Castro MC, Varela AH, Riera E, Irigoyen MV: Garcia de Yebenes MJ, Garcia-Vicuna R: Long-term TNF-alpha blockade in patients with amyloid A amyloidosis complicating rheumatic diseases.
Am J Med2010,123(5):454–461.
15. Karlin L, Arnulf B, Chevret S, Ades L, Robin M, De Latour RP, Malphettes M, Kabbara N, Asli B, Rocha V,et al:Tandem autologous non-myeloablative allogeneic transplantation in patients with multiple myeloma relapsing after a first high dose therapy.Bone Marrow Transplant2011,46(2):250–6. 16. Iapichino G, Corbella D, Minelli C, Mills GH, Artigas A, Edbooke DL, Pezzi A, Kesecioglu J, Patroniti N, Baras M,et al:Reasons for refusal of admission to intensive care and impact on mortality.Intensive Care Med2010,36 (10):1772–1779.
17. Rubin DB, Thomas N:Matching using estimated propensity scores: relating theory to practice.Biometrics1996,52(1):249–264. 18. Perkins SM, Tu W, Underhill MG, Zhou XH, Murray MD:The use of
propensity scores in pharmacoepidemiologic research.
Pharmacoepidemiol Drug Saf2000,9(2):93–101.
19. Austin PC:Goodness-of-fit diagnostics for the propensity score model when estimating treatment effects using covariate adjustment with the propensity score.Pharmacoepidemiol Drug Saf2008,17(12):1202–1217. 20. Weitzen S, Lapane KL, Toledano AY, Hume AL, Mor V:Weaknesses of
goodness-of-fit tests for evaluating propensity score models: the case of the omitted confounder.Pharmacoepidemiol Drug Saf2005,14(4):227–238. 21. Austin PC:The performance of different propensity score methods for
estimating marginal odds ratios.Stat Med2007,26(16):3078–3094. 22. Forbes A, Shortreed S:Inverse probability weighted estimation of the
marginal odds ratio: correspondence regarding 'The performance of different propensity score methods for estimating marginal odds ratios'.
Stat Med2008,27(26):5556–5559.author reply 5560–5553.
23. Austin PC:Some methods of propensity-score matching had superior performance to others: results of an empirical investigation and Monte Carlo simulations.Biom J2009,51(1):171–184.
24. Rosenbaum P:Observational Studies. 2ndEdition. New York, Inc: Springer-Verlag; 2002.
25. Brookhart MA, Schneeweiss S, Rothman KJ, Glynn RJ, Avorn J, Sturmer T: Variable selection for propensity score models.Am J Epidemiol2006, 163(12):1149–1156.
26. Cole SR, Hernan MA:Constructing inverse probability weights for marginal structural models.Am J Epidemiol2008,168(6):656–664. 27. Leon AC, Hedeker D:Quantile Stratification Based on a Misspecified
Propensity Score in Longitudinal Treatment Effectiveness Analyses of Ordinal Doses.Comput Stat Data Anal2007,51(12):6114–6122. 28. Austin PC, Grootendorst P, Anderson GM:A comparison of the ability of
different propensity score models to balance measured variables between treated and untreated subjects: a Monte Carlo study.Stat Med
2007,26(4):734–753.
29. Austin PC:Balance diagnostics for comparing the distribution of baseline covariates between treatment groups in propensity-score matched samples.Stat Med2009,28(25):3083–3107.
30. Hansen BB:The essential role of balance tests in propensity-matched observational studies: comments on 'A critical appraisal of propensity-score matching in the medical literature between 1996 and 2003' by Peter Austin, Statistics in Medicine.Stat Med2008,27(12):2050–2054. discussion 2066–2059.
31. Gayat E, Pirracchio R, Resche-Rigon M, Mebazaa A, Mary JY, Porcher R: Propensity scores in intensive care and anaesthesiology literature: a systematic review.Intensive Care Med2010,36(12):1993–2003. 32. Austin PC:Optimal caliper widths for propensity-score matching when
estimating differences in means and differences in proportions in observational studies.Pharm Stat2011,10(2):150–161.
33. Dehija RH, Wahba S:Propensity Score-Matching Methods for Nonexperimental Causal Studies.Rev Econ Stat2002,84(1):151–161. 34. Frölich M:Finite-Sample Properties of Propensity-Score Matching and
Weighting Estimators.Rev Econ Stat2004,86(1):77–90.
35. Waernbaum I:Model misspecification and robustness in causal inference: comparing matching with doubly robust estimation.Stat Med2012, doi: 10.1002/sim.4496. [Epub ahead of print].
36. Austin PC, Grootendorst P, Normand SL, Anderson GM:Conditioning on the propensity score can result in biased estimation of common measures of treatment effect: a Monte Carlo study.Stat Med2007, 26(4):754–768.
37. Martens EP, Pestman WR, Klungel OH:Conditioning on the propensity score can result in biased estimation of common measures of treatment effect: a Monte Carlo study (p n/a) by Peter C. Austin, Paul Grootendorst, Sharon-Lise T. Normand, Geoffrey M. Anderson.Stat Med2007, 26(16):3208–3210. Author reply 3210–3202. Published Online: 16 June 2006. DOI: 10.1002/sim.2618.
38. Stampf S, Graf E, Schmoor C, Schumacher M:Estimators and confidence intervals for the marginal odds ratio using logistic regression and propensity score stratification.Stat Med2010,29(7–8):760–769. 39. Gail M, Wieand S, Piantadosi S:Biased estimates of treatment effect in
randomized experiments with nonlinear regressions and omitted covariates.Biometrika1984,71(3):431–444.
40. Greenland S:Interpretation and choice of effect measures in epidemiologic analyses.Am J Epidemiol1987,125(5):761–768.
doi:10.1186/1471-2288-12-70