show abnormal microstructural organization in
Asperger syndrome
Roine
et al.
R E S E A R C H
Open Access
Constrained spherical deconvolution-based
tractography and tract-based spatial statistics
show abnormal microstructural organization in
Asperger syndrome
Ulrika Roine
1*, Juha Salmi
1, Timo Roine
2, Taina Nieminen-von Wendt
3, Sami Leppämäki
4,5, Pertti Rintahaka
4,
Pekka Tani
4, Alexander Leemans
6and Mikko Sams
1,7Abstract
Background:The aim of this study was to investigate potential differences in neural structure in individuals with Asperger syndrome (AS), high-functioning individuals with autism spectrum disorder (ASD). The main symptoms of AS are severe impairments in social interactions and restricted or repetitive patterns of behaviors, interests or activities.
Methods:Diffusion weighted magnetic resonance imaging data were acquired for 14 adult males with AS and 19 age, sex and IQ-matched controls. Voxelwise group differences in fractional anisotropy (FA) were studied with tract-based spatial statistics (TBSS). Based on the results of TBSS, a tract-level comparison was performed with constrained spherical deconvolution (CSD)-based tractography, which is able to detect complex (for example, crossing) fiber configurations. In addition, to investigate the relationship between the microstructural changes and the severity of symptoms, we looked for correlations between FA and the Autism Spectrum Quotient (AQ), Empathy Quotient and Systemizing Quotient.
Results:TBSS revealed widely distributed local increases in FA bilaterally in individuals with AS, most prominent in the temporal part of the superior longitudinal fasciculus, corticospinal tract, splenium of corpus callosum, anterior thalamic radiation, inferior fronto-occipital fasciculus (IFO), posterior thalamic radiation, uncinate fasciculus and inferior longitudinal fasciculus (ILF). CSD-based tractography also showed increases in the FA in multiple tracts. However, only the difference in the left ILF was significant after a Bonferroni correction. These results were not explained by the complexity of microstructural organization, measured using the planar diffusion coefficient. In addition, we found a correlation between AQ and FA in the right IFO in the whole group.
Conclusions:Our results suggest that there are local and tract-level abnormalities in white matter (WM) microstructure in our homogenous and carefully characterized group of adults with AS, most prominent in the left ILF.
Keywords:autism spectrum disorder, diffusion magnetic resonance imaging, fractional anisotropy, white matter tract, inferior longitudinal fasciculus
* Correspondence:[email protected]
1Brain and Mind Laboratory, Department of Biomedical Engineering and Computational Science, Aalto University, Rakentajanaukio 2 C, FI-02150 Espoo, Finland
Full list of author information is available at the end of the article
Background
Asperger syndrome (AS) is a neurodevelopmental aut-ism spectrum disorder (ASD), which affects 0.6 to 0.7% of the population [1]. The main symptoms of AS are se-vere impairments in social interactions and restricted, repetitive patterns of behaviors, interests, and activities. Although the heritability of ASD has been estimated to be as high as 90% [2], no single autism locus has been implicated. Rather, autism seems to be a behavioral manifestation of multiple underlying genetic disorders [3]. This heterogeneity, the diversity of symptoms, and the variation in the degree of their severity among indi-viduals, also suggest that the neurobiological background is very complex with multiple brain areas being involved. It has been suggested that there are widely distributed abnormalities in brain connectivity in individuals with ASD [4-6].
Functional imaging studies have shown that there is reduced long-distance and increased short-distance con-nectivity in ASD [4-6]. Recently, diffusion-weighted (DW) magnetic resonance imaging (MRI) has enabled also the in vivo investigation of anatomical brain con-nectivity [7-10]. In white matter (WM) tracts, the diffu-sion of water molecules is hindered more by the cell walls of the axons than along the main orientation of the axons, and thus, diffusion is likely to be anisotropic in WM. Fractional anisotropy (FA) is the most commonly used index to describe the degree of anisotropy and can be used to quantify the microstructural coherence or organization of WM tracts [11]. Mean diffusivity (MD) represents the average diffusion rate in all directions and with the planar diffusion coefficient (CP), the degree of fiber complexity can be quantified [12]. In particular, a higher CP describes a more disc-shaped diffusion, typic-ally caused by‘crossing fibers’[13-15].
The findings of diffusion MRI studies in ASD are not consistent. Both decreased and increased FA values have been reported in many WM tracts in ASD, compared to typically developing control subjects [16,17]. Most of the studies have been performed in either children or ado-lescents with ASD [17]. In adults, mainly decreased FA values in ASD subjects have been reported [18-23]. Bloe-men and coworkers [20] used a voxelwise method to analyze the FA values of the WM in 13 adult males with AS and 13 age and IQ-matched male controls and mainly found regions with decreased FA in adults with AS. The discrepancy across studies could be partly due to the use of different image acquisition parameters or analysis approaches [17,24-26], but also the variation in age and cognitive profile of the subjects across the differ-ent studies may play a role in this context.
The aim of our study was to investigate potential dif-ferences in FA and MD in adults with ASD. To narrow down the variation in the cognitive profile of the
subjects, we only investigated high-functioning individ-uals with AS. Individindivid-uals with AS and autism share the same core symptoms, but according to DSM-IV, subjects with AS do not have a clinically significant delay in speech and cognitive development, although in DSM-5, autism and AS (among others) were placed on the same spectrum of autistic disorders.
As different analytic approaches may also contribute to the varying results in DWI studies in ASD, we have chosen to use multiple approaches to confirm that the results support each other. In our previous histogram-based study, we used a dual approach, a skeletonized white matter histogram and a whole-brain tractography histogram, and found a global increase of FA values in adult males with AS compared to age-, sex- and IQ-matched controls, suggesting a more coherent neural tract organization in the individuals with AS [27]. This raised a question about the location of the differences. Thus, in the current study, the aim was to find out if the differences would be widely distributed or if they could be pointed more specifically to certain locations or white matter tracts. We chose again a dual approach and used both tract-based spatial statistics (TBSS) [28] and tracto-graphy to investigate both voxelwise differences and tract-level differences. Furthermore, as diffusion tensor imaging (DTI) is unable to correctly characterize cross-ing fiber configurations, which are present in up to 90% of the WM tissue [29], we used constrained spherical de-convolution (CSD)-based tractography [30,31]. In CSD, multiple fibers passing through a voxel with distinct ori-entations can be reliably estimated. So far, CSD-based tractography has only been used in two studies in ASD [32,33], and only a few tracts have been investigated.
Methods Participants
included in the study. Both individuals with AS and con-trols had a full psychiatric evaluation before inclusion in the study. Diagnostic process for the AS group included full developmental history, acquired using multiple sources of information (for example, all previous medical records, par-ental interviews when possible). Benton Facial Recognition Test (FRT) [34] and Reading the Mind in the Eyes Test (Eyes Test) [35] were carried out for all subjects. In addition, all subjects completed Autism Spectrum Quotient (AQ) [36], Empathy Quotient (EQ) [37] and Systemizing Quotient (SQ) [38] questionnaires, which had been trans-lated into Finnish, and the translation was confirmed by a back-translation. A two-tailed t-test was used to test for group differences. There were no significant differences in total IQ, verbal IQ, performance IQ, FRT, Eyes test or SQ, whereas individuals with AS had significantly higher AQ scores (P= 0.0000001) and significantly lower EQ scores than controls (P= 0.0017) (see Table one in Roine et al. [27]). Control subjects were paid for their attendance in the study and for individuals with AS the expenses and the loss of income were compensated. The Ethics Committee of the Hospital District of Helsinki and Uusimaa approved the research protocol, and all participants signed a written informed consent form before participating in the study.
Image acquisition
The MR images were acquired with a Signa VH/i 3.0 T scanner with HDxt upgrade (General Electric, Milwaukee, WI, USA). A quadrature receiving eight-channel high-resolution brain array coil was used (MRI Devices Corporation, FL). The maximum field gradient ampli-tude of the MRI system was 40 mT/m with a slew rate of 150 T/m/s. A high-order shimming with 24-cm field of view (FOV) was applied prior to DW imaging. A spin echo pulsed sequence of 60 unique gradient orientations arranged on the unit sphere was used. Eight nondiffusion weighted B0-images were acquired and all of the 60 orientations were imaged twice, resulting in 120 diffusion-weighted images in total. The b-value, which controls the diffusion weighting, was 1000 s/mm2. Echo time (TE) was set to the mini-mum (approximately 98 ms). Repetition time (TR) was 10 s, and the number of excitations (NEX) was one. The imaging area covered the whole brain with 53 contiguous axial slices. The acquired in-plane reso-lution of the slices was 1.875 mm × 1.875 mm, and the thickness of the slices was 3.0 mm. The matrix size was 128 × 128.
The DW acquisitions of the two groups were tested for possible differences in subject motion using a two-tailedt-test. All of the parameters of the affine transform (12 degrees of freedom) were tested both for absolute and relative differences [39]. No group differences were found (P< 0.05) in any of the parameters.
Voxelwise analysis with tract-based spatial statistics The voxelwise statistical analysis of the diffusion data was carried out using TBSS [28], which belongs to the Functional MRI of the Brain (FMRIB) Software Library (FSL) tools [40]. FMRIB’s Diffusion Toolbox (FDT) was used for the preprocessing of the data. DW images were corrected for subject motion and eddy-current-induced distortions, and the nonbrain tissue was removed. Diffu-sion tensors were fitted resulting in FA and MD images in addition to the images containing eigenvalues of the diffusion tensor. As differences in FA could result from changes in the fiber complexity [29,41], CP images were calculated from the eigenvalues [12]. FA images were transformed into standard space by nonlinear registra-tion based on free-form deformaregistra-tions and B-splines [42], after which a mean FA image of all subjects was calcu-lated and thinned, resulting in a mean FA skeleton image. Then FA data of all subjects were projected onto the mean FA skeleton by selecting the highest FA values perpendicular to the FA skeleton. For MD and CP, the same nonlinear warps and projection vectors as used for FA images were used. ‘Randomise’, a permutation pro-gram that enables modeling and inference using stand-ard general linear model design setup, was used for statistical testing of the voxelwise differences between the two groups. Threshold-free cluster enhancement (TFCE) was used to enhance cluster-like structures in the data [43]. Permutation-based non-parametric testing was used to correct for multiple comparisons across space. The TBSS results were also transformed back to native space of each subject to confirm that a given point in the skeleton was derived from the correct anatomically corresponding region. We tested for differ-ences in FA, MD and CP values between subjects with AS and controls. In addition, we correlated AQ, SQ and EQ with FA for the whole group including individuals with AS and controls. Analyses were controlled for age and IQ.
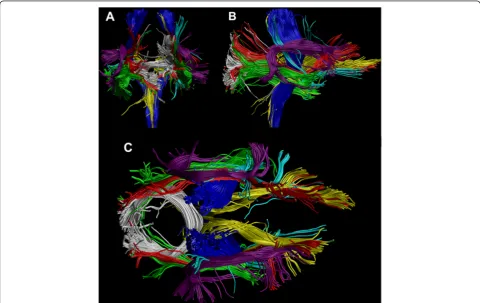
interests (ROIs) were defined based on a priori infor-mation of tract location [49]. The tracts of interest were chosen based on the results in TBSS, and identi-fied with the JHU ICBM-DTI-81 White-Matter Labels Atlas in FSL. A semi-automated method was used to extract 13 tracts, shown in Figure 1, in 33 individuals [50]. The semi-automated method has been validated to produce similar results as manually drawn ROIs and without an increase in the variability of the results [50]. The investigated tracts were splenium of corpus callosum (SCC) and six bilateral tracts: corticospinal tract (CST), anterior thalamic radiation (ATR), inferior fronto-occipital fasciculus (IFO), uncinate fasciculus (UNC), inferior longitudinal fasciculus (ILF), and su-perior longitudinal fasciculus (SLF). In this procedure, the ROIs for all tracts were selected manually on a color map of one subject, and then transformed to the other subjects’ brains taking into account intersubject variability. In addition, a laterality index (LI) was calcu-lated for all bilateral tracts as follows: LI = (left-right)/ (left + right). Two-sample t-tests, assuming unequal vari-ances, were performed to test for group differences in FA, MD, CP and LI between the two groups. Based on earlier
results [27] and the results of the TBSS analyses, we used an alternative hypothesis for FA being higher in individ-uals with AS than in controls. For MD, CP and LI, no prior hypothesis was used. Bonferroni correction for mul-tiple comparisons was used in the tract-level analyses. Correlations between FA and AQ, EQ and SQ scores were calculated both for the whole sample and separately for in-dividuals with AS and controls.
Results and discussion
A voxelwise comparison of FA, MD and CP values be-tween individuals with AS and age, sex and IQ-matched controls was performed with TBSS, and the findings were confirmed by CSD-based tractography.
Voxelwise analysis with tract-based spatial statistics Voxelwise comparison with TBSS revealed local bilateral increases in FA in individuals with AS (correctedP<0.05) in the following tracts (shown in Figure 2): temporal part of SLF, CST, SCC, ATR, IFO, UNC, ILF and posterior thal-amic radiation (PTR). No significant changes were found in MD or CP between the two groups, and no significant correlations were found between AQ, EQ or SQ and FA.
As TBSS is designed for investigation of voxelwise dif-ferences in WM tracts, and only the voxels with the highest FA value in the cross-section of the WM tracts are analyzed, the analyses are restricted to WM. This way, the partial volume effect (PVE) is minimized in terms of adverse contributions of GM or cerebrospinal fluid to WM voxels. Furthermore, no smoothing is needed. However, abnormalities in the WM might re-duce the FA value of a tract locally, and it is possible that the voxel chosen to the skeleton is not actually in the center of the tract. Therefore, we transformed the TBSS results back to native space of each subject to confirm that a given point in the skeleton was derived from the correct anatomically corresponding region. A limitation of TBSS is that by studying only the voxels on the skel-eton with the highest FA, a large part of WM remains uninvestigated. The tract-level analysis with the CSD-based tractography method complements the more local TBSS approach, as it is not limited to the voxels with the highest FA in the cross-section of the tract.
Tract-level analysis with constrained spherical deconvolution tractography
CSD-based tractography showed an increased FA in the right IFO, left ILF, right and left SLF and left UNC in
individuals with AS compared to controls, as shown in Table 1, but only the difference in the left ILF was sig-nificant after the Bonferroni correction (corrected P value = 0.02633). However, Bonferroni correction for multiple comparisons is very conservative and does not account for the correlation between the FA values of dif-ferent tracts. Thus, in regard to the previous global find-ing and the results of TBSS, it is possible that true increases in FA may be present in also other tracts than left ILF. No significant changes were found in MD, CP or LI in any of the tracts between the two groups.
To see if the findings in FA correlated with a specific area such as empathy or systemizing skills, we per-formed a correlation analysis of AQ, EQ and SQ with FA. Results are shown in Table 2 (no correction for mul-tiple comparison was applied). In the whole sample, a positive correlation of AQ and FA was found in the right IFO. However, the finding could be explained by the highly significant between-group difference in AQ, as no significant correlation was found when the groups were tested separately. A negative correlation of EQ and FA was found in the left ATR, which was supported by a trend of negative correlation in the control subjects (corr = -0.4328, P= 0.06417). No correlation was found between SQ and FA in any of the WM tracts.
Possible causes for increased fractional anisotropy Anisotropic diffusion is primarily caused by dense pack-ing of axons and their cell membranes [11]. Other tissue properties such as myelination can also affect the degree of anisotropy [15,51]. However, one of the most import-ant factors affecting the FA is the complexity of the underlying WM fiber structure [29,41]: less crossing fiber configurations in individuals with AS could be a
cause for the increased FA. However, no between-group differences were observed in CP with either TBSS or with CSD-based tractography. Thus, the higher FA in subjects with AS was not explained by a lower degree of crossing fibers [51]. In addition, it has been recently re-ported that differences in subject motion may affect DW-MRI metrics in ASD [52,53]. However, in our sam-ple, there were no differences in subject motion between Table 1 Fractional anisotropy (FA) values in individuals with Asperger syndrome (AS) and controls in the white matter (WM) tracts reconstructed with tractography
WMatract FAa(ASasubjects)b FAa(controls)b
Pvaluec Corrected
Pvaluec
ATRaL 0.3416 ± 0.0381 0.3335 ± 0.0330 0.2629 3.418
ATRaR 0.3511 ± 0.0399 0.3453 ± 0.0332 0.3330 4.329
SCCa 0.4521 ± 0.0225 0.4401 ± 0.0553 0.1995 2.593
CSTaL 0.4957 ± 0.0254 0.4848 ± 0.0405 0.1757 2.284
CSTaR 0.4915 ± 0.0278 0.4713 ± 0.0420 0.05339 0.6941
IFOaL 0.4381 ± 0.0336 0.4129 ± 0.0523 0.05162 0.6710
IFOaR 0.4365 ± 0.0261 0.4112 ± 0.0342 0.01095 0.1423
ILFaL 0.3864 ± 0.0277 0.3521 ± 0.0358 0.002026 0.02633
ILFaR 0.3697 ± 0.0258 0.3511 ± 0.0380 0.05233 0.6803
SLFaL 0.4266 ± 0.0154 0.3978 ± 0.0433 0.006523 0.08480
SLFaR 0.3899 ± 0.0255 0.3620 ± 0.0434 0.01405 0.1826
UNCaL 0.3426 ± 0.0368 0.3109 ± 0.0424 0.01470 0.1911
UNCaR 0.3353 ± 0.0373 0.3143 ± 0.0408 0.06743 0.8766
a
FA, fractional anisotropy; AS, Asperger syndrome; WM, white matter; ATR, anterior thalamic radiation; SCC, splenium of corpus callosum; CST, corticospinal tract; IFO, inferior fronto-occipital fasciculus; ILF, inferior longitudinal fasciculus; SLF, superior longitudinal fasciculus; UNC, uncinate fasciculus.
b
Mean and standard deviations are presented for both groups. c
Both uncorrected and Bonferroni-correctedPvalues from two-sample t-tests are presented. A significantPvalue (correctedP<0.05) is highlighted in bold.
Table 2 Correlation of autism spectrum quotient (AQ), empathy quotient (EQ) and systemizing quotient (SQ) with fractional anisotropy of the white matter tracts
WMa
tracts
AQaand FAa EQaand FAa SQaand FAa
Correlationb Pvaluec Correlationb Pvaluec Correlationb Pvaluec
ATRaL 0.3010 0.08871 −0.3551 0.04255 0.07749 0.6682
ATRaR 0.1772 0.3239 −0.2403 0.1779 0.1201 0.5055
SCCa 0.09482 0.5997 −0.06295 0.7278 0.01877 0.9174
CSTaL 0.1720 0.3385 0.1040 0.5648 −0.004599 0.9797
CSTaR 0.2603 0.1435 0.05810 0.7481 0.07059 0.6963
IFOaL 0.2675 0.1323 −0.3043 0.08511 0.04044 0.8232
IFOaR 0.3869 0.02613 −0.3213 0.06829 0.1149 0.5242
ILFaL 0.2861 0.1065 −0.2277 0.2026 0.1736 0.3339
ILFaR 0.3160 0.07321 −0.2515 0.1580 0.1161 0.5199
SLFaL 0.3189 0.07049 −0.1911 0.2866 0.1285 0.4759
SLFaR 0.2730 0.1242 −0.1050 0.5608 0.04742 0.7933
UNCaL 0.2994 0.09054 −0.07811 0.6657 0.1500 0.4047
UNCaR 0.1613 0.3700 −0.08445 0.6403 0.09923 0.5827
a
AQ, Autism spectrum quotient; EQ, Empathy quotient; SQ, Systemizing quotient; WM, white matter; FA, fractional anisotropy; ATR, anterior thalamic radiation; SCC, splenium of corpus callosum; CST, corticospinal tract; IFO, inferior fronto-occipital fasciculus; ILF, inferior longitudinal fasciculus; SLF, superior longitudinal fasciculus; UNC, uncinate fasciculus.
b
The correlations were calculated for all subjects. c
the groups. Thus, subject motion does not confound our results. FA can increase or decrease without changes in MD. For instance, if axial diffusivity increases and radial diffusivity decreases, FA can increase without changes in MD.
Increased FA indicates that the coherence of the WM tracts in subjects with AS may be higher than in controls [54]. However, it has been suggested that individuals with ASD have difficulties in differentiating signal from noise, and thus, strong physical connectivity does not necessarily equal high computational connectivity [4]. Interestingly, asynchronous brain activity during film watching in individuals with AS was reported in a partly overlapping sample [55]. It is also possible that more intensive training of the social and communication (or other lacking) skills may lead to increased FA values in adults with AS, as in two studies with healthy subjects it has been shown that training can induce an increase in FA [56,57]. In addition, Pardini and coworkers found an increase in FA in individuals with ASD who highly adhered to therapy, compared to those who adhered to it only moderately [58].
Comparison to the previous findings
Although most of the previous studies in adults with ASD have reported decreased FA values [18-23], in-creased FA values have also been found [19,20]. In addition, a recent study reported a positive correlation between FA and autistic traits in subjects with ADHD most prominent in socio-communicative skills, which are impaired in AS [59]. In some studies in adults with ASD, no group differences in FA related measures were reported [60,61]. A voxel-based meta-analysis showed increased WM volume in the right arcuate, left inferior fronto-occipital and uncinate fasciculi in individuals with ASD [62]. In studies performed in children and adoles-cents, more increases in FA have been found than in adults [63-68]. However, the methods and also regions of interest vary a lot between different studies.
CSD-based tractography has been previously used in only two studies in ASD [32,33]. McGrath and co-workers investigated the WM integrity of the arcuate fasciculus (AF) and IFO, and found a decrease in FA in the right IFO in individuals with ASD [32]. We did not perform tractography of the AF, as it did not appear in the TBSS results, and the FA of the right IFO was in-creased in our subjects with AS compared to controls in TBSS. At the tract-level, the difference in the right IFO did not endure the correction for multiple comparisons. However, the difference of the absolute values is bigger in our study than in McGrath and coworkers’ study. The samples also differ, as the patients in our study are older (28.6 ± 5.7 versus 17.28 ± 2.87), and have a higher IQ (125.1 ± 14.5 versus 106.84 ± 14.54). McGrath
and coworkers also investigated WM microstructure based on the results of functional connectivity and found reduced FA in the WM connecting the left Brodmann area 19 to the left caudate head and to the left thalamus in in-dividuals with ASD [33].
The inconsistent findings in the previous studies may be partly due to the use of different methods, but also to the heterogeneity of the samples, as in ASD, the diversity of symptoms is large and variation in the degree of their severity among individuals varies a lot. Differences in age and IQ between the different samples may also affect the results, as it has been shown that FA values correlate with IQ [69] and that FA changes with age [53,70]. Lan-gen and coworkers have hypothesized that there might be an earlier peak in the WM maturation and an earlier onset of an age-related decrease in FA in autism [22]. In our study, we have chosen a homogeneous sample of subjects with ASD, as subjects with AS do not have a clinically significant delay in speech and cognitive development (International Classification of Disease; World Health Organization; 1993). In addition, our subjects with AS are high-functioning, with a mean IQ of 125.1 ± 14.5.
Advantages of the chosen methodology
The large amount of different analysis methods makes it more difficult to compare different studies with each other, as each of the methods has its limitations [24,25,71,72]. Because of the inconsistency in the results of the previous studies, we have used two different tech-niques to reliably detect the possible WM changes in male adults with AS. In TBSS, the FA of the WM is in-vestigated at a more local level than in the tractography-based analysis, where the mean FA is calculated for the whole tract. Therefore, possible differences in some part of the WM tract seen in TBSS may not be seen in the mean FA of the whole tract. In that sense, the TBSS analysis might be more sensitive, but the tractography-based analysis might be more robust. Furthermore, in the tractography approach we have used CSD-based tractography instead of DTI-based tractography. Unlike in DTI, with CSD it is possible to reliably investigate crossing fibers, which are present in up to 90% of the WM tissue [29].
Thus, TBSS and CSD-based tractography complement each other, and both indicate increased FA in individuals with AS. Furthermore, these results are supported by our earlier findings of globally increased FA in subjects with AS [27], but provide more information concerning the location of the differences.
Limitations
multiple comparisons and thus, can be considered ro-bust. Finland is an isolated and genetically homogeneous country [73], which can be beneficial as it has been suggested that heritable factors play a strong role in WM organization [69]. Another limitation concerns the Autism Diagnostic Interview-Revised (ADI-R) and Autism Diagnostic Observation Schedule (ADOS). They are standard instruments in the diagnostics of ASD in many countries, but were not in use in Finland at the time of the study. Therefore, we do not have this information for our subjects. However, we used AQ, EQ and SQ questionnaires specifically designed for high-functioning individuals with ASD, and in addition, all subjects were thoroughly screened to exclude other psychiatric disorders. In addition, the DW-MRI acquisition was suboptimal for CSD-based tractography [48], as the diffusion-weighting was rela-tively low and the voxel size was anisotropic. Never-theless, fiber crossings, present in 60 to 90% of the WM voxels [29], can reliably be identified with CSD [48,74,75], and thus, using CSD is highly beneficial in comparison to DTI, where fiber crossings cannot be identified. Finally, we used a semi-automated tract segmentation method to extract the 13 fiber tracts in 33 subjects [50]. While this approach has been suc-cessfully applied for DTI-based tractography using a single representative subject [50,76], performance characteristics for CSD-based tractography, combined with the use of more advanced population-specific atlas templates [77,78], remain to be determined.
Conclusions
We investigated local microstructural differences in the WM of individuals with AS by comparing their FA, MD and CP values to those of age-, sex- and IQ-matched controls. We used a dual approach and performed first a more local voxelwise analysis, TBSS, and then confirmed the findings with a tract-level analysis approach, CSD-based tractography. Our results suggest that there are widely distributed abnormalities in the WM tracts of adults with AS, and that these are most pronounced in the left ILF. The changes were not explained by differences in the complexity of the microstructural organization of the WM. Furthermore, these results are in line with our earlier findings of globally increased FA in subjects with AS [27].
Our study was restricted to adult males with AS. In the future, longitudinal studies beginning in the childhood and following the diagnosis and possible rehabilitation should be performed to more thoroughly understand the neural deficits and the effects of age and IQ in ASD. Fur-thermore, as ASD is a very broad and heterogeneous disorder, the study samples should be as homogeneous as possible, and different symptom domains should be investigated separately. Finally, the WM tracts could
be segmented and thus, short parts of the tracts could be investigated separately in addition to looking at the mean FA of the whole tract.
Abbreviations
ADI-R:Autism Diagnostic Interview–revised; ADOS: Autism Diagnostic Observation Schedule; AF: arcuate fasciculus; AQ: autism spectrum quotient; AS: Asperger syndrome; ASD: autism spectrum disorder; ATR: anterior thalamic radiation; CP: planar diffusion coefficient; CSD: constrained spherical deconvolution; CST: corticospinal tract; DTI: diffusion tensor imaging; DW: diffusion weighted; EQ: empathy quotient; Eyes Test: Reading the Mind in the Eyes Test; FA: fractional anisotropy; FDT: FMRIB’s diffusion toolbox; FMRIB: Functional MRI of the Brain; FOD: fiber orientation distribution; FOV: field of view; FRT: Benton Facial Recognition Test; FSL: FMRIB software library; GM: gray matter; IFO: inferior fronto-occipital fasciculus; ILF: inferior longitudinal fasciculus; LI: laterality index; MD: mean diffusivity; MRI: magnetic resonance imaging; NEX: number of excitations; PTR: posterior thalamic radiation; PVE: partial volume effect; SCC: splenium of corpus callosum; SLF: superior longitudinal fasciculus; SQ: systemizing quotient; TBSS: tract-based spatial statistics; TE: echo time; TFCE: threshold-free cluster enhancement; TR: repetition time; UNC: uncinate fasciculus; WM: white matter.
Competing interests
The authors declare that they have no competing interests.
Authors’contributions
UR contributed to the design of the study, acquisition, analysis and interpretation of the data and writing the manuscript. JS contributed to the design of the study and acquisition and interpretation of the data and revised the manuscript. TR contributed to the design of the study, analysis and interpretation of the data and writing of the manuscript. TNvW contributed to the design of the study and acquisition and interpretation of the data and revised the manuscript. SL contributed to the design of the study and acquisition and interpretation of the data and revised the manuscript. PR contributed to the design of the study and acquisition and interpretation of the data and revised the manuscript. PT contributed to the design of the study and acquisition and interpretation of the data and revised the manuscript. AL contributed to the design of the study and interpretation of the data and revised the manuscript. MS contributed to the design of the study and acquisition and interpretation of the data and revised the manuscript. All authors read and approved the manuscript.
Authors’information
disorders and chronobiology. PR is an MD and a PhD. He has two specialties regarding neuropsychiatric disorders: he is a pediatric neurologist and an adolescent psychiatrist. In addition, he has five years of brain imaging experience with neuropsychiatric disorders at UCLA PET-Center and Neuropsychiatric Center. In Finland, he has clinical work experience with neuropsychiatric disorders including Asperger syndrome and other ASD, and he works at the Helsinki University Central Hospital Adolescent Psychiatry Clinic. His main field is evaluating neuropsychiatric patients and their comorbid conditions in addition to medical treatment and rehabilitation. PT is an adjunct professor of psychiatry at the University of Helsinki. He has more than ten years of experience on developmental neuropsychiatric disorders and is especially interested in clinical manifestation of ASD in adulthood. In addition, he has done research in forensic psychiatry. AL is a physicist who received his PhD in 2006 at the University of Antwerp, Belgium. From 2007 to 2009, he worked as a postdoctoral researcher at the Cardiff University Brain Research Imaging Center (CUBRIC), Cardiff University, Wales, United Kingdom. In 2009, he joined the Image Sciences Institute (ISI), University Medical Center Utrecht, the Netherlands, where he currently holds a tenured faculty position as Associate Professor. His current research interests include modeling, processing, visualizing and analyzing diffusion MRI data for investigating microstructural and architectural tissue organization. He heads the PROVIDI Lab and is the developer of the software ExploreDTI. MS is a professor of cognitive neuroscience in Aalto University. He is very experienced in noninvasive study of neural basis of cognitive functions such as attention, speech perception, auditory perception and multisensory integration. Now his research is focused on studying brain activity in naturalistic conditions.
Acknowledgements
The authors would like to thank the radiographer Marita Kattelus from the Advanced Magnetic Imaging Centre of the Aalto University. The study was supported by the Academy of Finland (National Centres of Excellence program 2006-2011, grants #129670, #130412, #138145, #259752, #259952), and the aivoAALTO project grant from the Aalto University. The work of TR was supported by the Fund for Scientific Research-Flanders (FWO), and by the Interuniversity Attraction Poles Program (P7/11) initiated by the Belgian Science Policy Office. The research of AL is supported by Vidi Grant 639.072.411 from the Netherlands Organisation for Scientific Research (NWO). We gratefully acknowledge the DTI sequence and recon code from Drs Roland Bammer, Michael Moseley and Gary Glover, supported by the NIH NCRR grant ‘Stanford Center for Advanced Magnetic Resonance Technology’, P41 RR09784 (PI: G. Glover).
Author details
1
Brain and Mind Laboratory, Department of Biomedical Engineering and Computational Science, Aalto University, Rakentajanaukio 2 C, FI-02150 Espoo, Finland.2iMinds-Vision Lab, Department of Physics, University of Antwerp, Universiteitsplein 1, B-2610 Wilrijk, Antwerp, Belgium. 3
Neuropsychiatric Rehabilitation and Medical Centre Neuromental, Kaupintie 11 A, FI-00440 Helsinki, Finland.4Department of Psychiatry, Clinic for Neuropsychiatry, Helsinki University Central Hospital, Tukholmankatu 8 F, FI-00290 Helsinki, Finland.5Finnish Institute of Occupational Health, Topeliuksenkatu 41, FI-00290 Helsinki, Finland.6Image Sciences Institute, University Medical Center Utrecht, Heidelberglaan 100, 3584 CX Utrecht, The Netherlands.7Advanced Magnetic Imaging Centre, Aalto University, Otakaari 5, FI-02150 Espoo, Finland.
Received: 20 May 2014 Accepted: 11 December 2014 Published: 16 January 2015
References
1. Fombonne E. Epidemiology of pervasive developmental disorders. Pediatr Res. 2009;65:591–8.
2. Folstein SE, Rosen-Sheidley B. Genetics of autism: complex aetiology for a heterogeneous disorder. Nat Rev Genet. 2001;2:943–55.
3. Betancur C. Etiological heterogeneity in autism spectrum disorders: more than 100 genetic and genomic disorders and still counting. Brain Res. 2011;1380:42–77.
4. Belmonte MK, Allen G, Beckel-Mitchener A, Boulanger LM, Carper RA, Webb SJ. Autism and abnormal development of brain connectivity. J Neurosci. 2004;24:9228–31.
5. Wass S. Distortions and disconnections: disrupted brain connectivity in autism. Brain Cogn. 2011;75:18–28.
6. Schipul SE, Keller TA, Just MA. Inter-regional brain communication and its disturbance in autism. Front Syst Neurosci. 2011;22:5–10.
7. Basser PJ, Mattiello J, LeBihan D. MR diffusion tensor spectroscopy and imaging. Biophys J. 1994;66:259–67.
8. Jones DK, Knösche TR, Turner R. White matter integrity, fiber count, and other fallacies: the do’s and don’ts of diffusion MRI. NeuroImage. 2013;73:239–54.
9. Jones DK, Leemans A. Diffusion tensor imaging. Methods Mol Biol. 2011;711:127–44.
10. Tournier JD, Mori S, Leemans A. Diffusion tensor imaging and beyond. Magnet Reson Med. 2011;65:1532–56.
11. Beaulieu C. The basis of anisotropic water diffusion in the nervous system -a technic-al review. NMR Biomed. 2002;15:435–55.
12. Westin CF, Maier SE, Mamata H, Nabavi A, Jolesz FA, Kikinis R. Processing and visualization for diffusion tensor MRI. Med Image Anal. 2002;6:93–108. 13. Wiegell MR, Larsson HB, Wedeen VJ. Fiber crossing in human brain depicted
with diffusion tensor MR imaging. Radiology. 2000;217:897–903. 14. Ennis DB, Kindlmann G. Orthogonal tensor invariants and the analysis of
diffusion tensor magnetic resonance images. Magn Reson Med. 2006;55:136–46.
15. Vos SB, Jones DK, Jeurissen B, Viergever MA, Leemans A. The influence of complex white matter architecture on the mean diffusivity in diffusion tensor MRI of the human brain. NeuroImage. 2012;59:2208–16.
16. Pina-Camacho L, Villero S, Fraguas D, Boada L, Janssen J, Navas-Sánchez FJ, et al. Autism spectrum disorder: does neuroimaging support the DSM-5 proposal for a symptom dyad? A systematic review of functional magnetic resonance imaging and diffusion tensor imaging studies. J Autism Dev Disord. 2012;42:1326–41.
17. Travers BG, Adluru N, Ennis C, Tromp DPM, Destiche D, Doran S, et al. Diffusion tensor imaging in autism spectrum disorder: a review. Autism Res. 2012;5:289–313.
18. Catani M, Jones DK, Daly E, Embiricos N, Deeley Q, Pugliese L, et al. Altered cerebellar feedback projections in Asperger syndrome. NeuroImage. 2008;41:1184–91.
19. Thakkar KN, Polli FE, Joseph RM, Tuch DS, Hadjikhani N, Barton JJ, et al. Response monitoring, repetitive behaviour and anterior cingulate abnormalities in autism spectrum disorders (ASD). Brain. 2008;131:2464–78. 20. Bloemen OJN, Deeley Q, Sundram F, Daly EM, Barker GJ, Jones DK, et al.
White matter integrity in asperger syndrome: a preliminary diffusion tensor magnetic resonance imaging study in adults. Autism Res. 2010;3:203–13. 21. Kleinhans NM, Pauley G, Richards T, Neuhaus E, Martin N, Corrigan NM, et al.
Age-related abnormalities in white matter microstructure in autism spectrum disorders. Brain Res. 2012;1479:1–16.
22. Langen M, Leemans A, Johnston P, Ecker C, Daly E, Murphy CM, et al. Fronto-striatal circuitry and inhibitory control in autism: findings from diffusion tensor imaging tractography. Cortex. 2012;48:183–93. 23. Gibbard CR, Ren J, Seunarine KK, Clayden JD, Skuse DH, Clark CA. White
matter microstructure correlates with autism trait severity in a combined clinical–control sample of high-functioning adults. NeuroImage. 2013;3:106–14.
24. Cercignani M. Strategies for patient-control comparison of diffusion MRI data. In: Jones DK, editor. Diffusion MRI: theory, methods, and applications. Oxford: Oxford University Press; 2010. p. 485–99.
25. Jones DK, Cercignani M. Twenty-five pitfalls in the analysis of diffusion MRI data. NMR Biomed. 2010;23:803–20.
26. Deprez S, Billiet T, Sunaert S, Leemans A. Diffusion tensor MRI of chemotherapy-induced cognitive impairment in non-CNS cancer patients: a review. Brain Imaging Behav. 2013;7:409–35.
27. Roine U, Roine T, Salmi J, Nieminen-Von Wendt T, Leppämäki S, Rintahaka P, et al. Increased coherence of white matter fiber tract organization in adults with Asperger syndrome: a diffusion tensor imaging study. Autism Res. 2013;6:642–50.
28. Smith SM, Jenkinson M, Johansen-Berg H, Rueckert D, Nichols TE, Mackay CE, et al. Tract-based spatial statistics: voxelwise analysis of multi-subject diffusion data. NeuroImage. 2006;31:1487–505.
30. Tournier JD, Calamante F, Gadian DG, Connelly A. Direct estimation of the fiber orientation density function from diffusion-weighted MRI data using spherical deconvolution. NeuroImage. 2004;23:1176–85.
31. Tournier JD, Calamante F, Connelly A. Robust determination of the fibre orientation distribution in diffusion MRI: non-negativity constrained super-resolved spherical deconvolution. NeuroImage. 2007;35:1459–72.
32. McGrath J, Johnson K, O'Hanlon E, Garavan H, Gallagher L, Leemans A. White matter and visuospatial processing in autism: a constrained spherical deconvolution tractography study. Autism Res. 2013;6:307–19.
33. McGrath J, Johnson K, O'Hanlon E, Garavan H, Leemans A, Gallagher L. Abnormal functional connectivity during visuospatial processing is associated with disrupted organisation of white matter in autism. Front Hum Neurosci. 2013;7:434.
34. Benton AL, Sivan AB, Hamsher K, Vareny NR, Spreen O. Facial recognition: stimulus and multiple choice pictures. In: Benton AL, Sivan AB, Hamsher KDS, Varney NR, Speen O, editors. Contributions to neuropsychological assessment. New York: Oxford University Press; 1983. p. 30–40. 35. Baron-Cohen S, Wheelwright S, Hill J, Raste Y, Plumb I. The "reading the
mind in the eyes" test revised version: a study with normal adults, and adults with Asperger syndrome or high-functioning autism. J Child Psychol Psychiatry. 2001;42:241–51.
36. Baron-Cohen S, Wheelwright S, Skinner R, Martin J, Clubley E. The autism-spectrum quotient (AQ): evidence from Asperger syndrome/ high-functioning autism, males and females, scientists and mathematicians. J Autism Dev Disord. 2001;31:5–17.
37. Baron-Cohen S, Wheelwright S. The empathy quotient: an investigation of adults with Asperger syndrome or high functioning autism, and normal sex differences. J Autism Dev Disord. 2004;34:163–75.
38. Baron-Cohen S, Richler J, Bisarya D, Gurunathan N, Wheelwright S. The systemizing quotient: an investigation of adults with Asperger syndrome or high-functioning autism, and normal sex differences. Philos Trans R Soc Lond B Biol Sci. 2003;358:361–74.
39. Franco AR, Ling J, Cañive JM. Assessment and quantification of head motion in neuropsychiatric functional imaging research as applied to schizophrenia. J Int Neuropsychol Soc. 2007;13:839–45.
40. Smith SM, Jenkinson M, Woolrich MW, Beckmann CF, Behrens TE, Johansen-Berg H, et al. Advances in functional and structural MR image analysis and implementation as FSL. NeuroImage. 2004;23:208–S219. 41. Wedeen VJ, Rosene DL, Wang R, Dai G, Mortazavi F, Hagmann P, et al. The
geometric structure of the brain fiber pathways. Science. 2012;335:1628–34. 42. Rueckert D, Sonoda LI, Hayes C, Hill DLG, Leach MO, Hawkes DJ. Non-rigid
registration using free-form deformations: application to breast MR images. IEEE Trans Med Imaging. 1999;18:712–21.
43. Smith SM, Nichols TE. Threshold-free cluster enhancement: addressing problems of smoothing, threshold dependence and localisation in cluster inference. NeuroImage. 2009;44:83–98.
44. Leemans A, Jeurissen B, Sijbers J, Jones DK. ExploreDTI: a graphical toolbox for processing, analyzing, and visualizing diffusion MR data. In: Proceedings of the 17th Annual Meeting of International Society for Magnetic Resonance in Medicine. Hawaii: Curran Associates Inc; 2009. p. 3537. 45. Jeurissen B, Leemans A, Jones DK, Tournier JD, Sijbers J. Probabilistic fiber
tracking using the residual bootstrap with constrained spherical deconvolution. Hum Brain Mapp. 2011;32:461–79.
46. Leemans A, Jones DK. The B‐matrix must be rotated when correcting for subject motion in DTI data. Magn Reson Med. 2009;61:1336–49. 47. Veraart J, Rajan J, Peeters RR, Leemans A, Sunaert S, Sijbers J.
Comprehensive framework for accurate diffusion MRI parameter estimation. Magn Reson Med. 2013;70:972–84.
48. Tournier JD, Yeh CH, Calamante F, Cho KH, Connelly A, Lin CP. Resolving crossing fibres using constrained spherical deconvolution: validation using diffusion-weighted imaging phantom data. NeuroImage. 2008;42:617–25.
49. Wakana S, Caprihan A, Panzenboeck MM, Fallon JH, Perry M, Gollub RL, et al. Reproducibility of quantitative tractography methods applied to cerebral white matter. NeuroImage. 2007;36:630–44.
50. Lebel C, Walker L, Leemans A, Phillips L, Beaulieu C. Microstructural maturation of the human brain from childhood to adulthood. NeuroImage. 2008;40:1044–55.
51. Vos SB, Jones DK, Viergever MA, Leemans A. Partial volume effect as a hidden covariate in DTI analyses. NeuroImage. 2011;55:1566–76.
52. Yendiki A, Koldewyn K, Kakunoori S, Kanwisher N, Fischl B. Spurious group differences due to head motion in a diffusion MRI study. NeuroImage. 2014;88:79–90.
53. Koldewyn K, Yendiki A, Weigelt S, Gweon H, Julian J, Richardson H, et al. Differences in the right inferior longitudinal fasciculus but no general disruption of white matter tracts in children with autism spectrum disorder. Proc Natl Acad Sci U S A. 2014;111:1981–6.
54. Choe AS, Stepniewska I, Colvin D, Ding Z, Anderson AW. Validation of diffusion tensor MRI in the central nervous system using light microscopy: quantitative comparison of fiber properties. NMR Biomed. 2012;25:900–8. 55. Salmi J, Roine U, Glerean E, Lahnakoski J, Nieminen-von Wendt T, Tani P, et al. The brains of high functioning autistic individuals do not synchronize with those of others. NeuroImage. 2013;3:489–97.
56. Scholz J, Klein MC, Behrens TE, Johansen-Berg H. Training induces changes in white-matter architecture. Nat Neurosci. 2009;12:1370–1.
57. Schlegel AA, Rudelson JJ, Tse PU. White matter structure changes as adults learn a second language. J Cogn Neurosci. 2012;24:1664–70.
58. Pardini M, Elia M, Garaci FG, Guida S, Coniglione F, Krueger F, et al. Long-term cognitive and behavioral therapies, combined with augmentative communication, are related to uncinate fasciculus integrity in autism. J Autism Dev Disord. 2012;42:585–92.
59. Cooper M, Thapar A, Jones DK. White matter microstructure predicts autistic traits in attention-deficit/hyperactivity disorder. J Autism Dev Disord. 2014. Epub Ahead of Print, doi: 10.1007/s10803-014-2131-9.
60. Conturo TE, Williams DL, Smith CD, Gultepe E, Akbudak E, Minshew NJ. Neuronal fiber pathway abnormalities in autism: an initial MRI diffusion tensor tracking study of hippocampo-fusiform and amygdalo-fusiform pathways. J Int Neuropsychol Soc. 2008;14:933–46.
61. Thomas C, Humphreys K, Jung KJ, Minshew N, Behrmann M. The anatomy of the callosal and visual-association pathways in high-functioning autism: a DTI tractography study. Cortex. 2011;47:863–73.
62. Radua J, Via E, Catani M, Mataix-Cols D. Voxel-based meta-analysis of regional white-matter volume differences in autism spectrum disorder versus healthy controls. Psychol Med. 2011;41:1539.
63. Ben Bashat D, Kronfeld-Duenias V, Zachor DA, Ekstein PM, Hendler T, Tarrasch R, et al. Accelerated maturation of white matter in young children with autism: a high b value DWI study. NeuroImage. 2007;37:40–7. 64. Cheung C, Chua SE, Cheung V, Khong PL, Tai KS, Wong TK, et al. White
matter fractional anisotrophy differences and correlates of diagnostic symptoms in autism. J Child Psychol Psychiatry. 2009;50:1102–12. 65. Cheng Y, Chou KH, Chen IY, Fan YT, Decety J, Lin CP. Atypical development
of white matter microstructure in adolescents with autism spectrum disorders. NeuroImage. 2010;50:873–82.
66. Sahyoun CP, Belliveau JW, Mody M. White matter integrity and pictorial reasoning in high-functioning children with autism. Brain Cogn. 2010;73:180. 67. Bode MK, Mattila ML, Kiviniemi V, Rahko J, Moilanen I, Ebeling H, et al.
White matter in autism spectrum disorders - evidence of impaired fiber formation. Acta Radiol. 2011;52:1169–74.
68. Weinstein M, Ben-Sira L, Levy Y, Zachor DA, Itzhak EB, Artzi M, et al. Abnormal white matter integrity in young children with autism. Hum Brain Mapp. 2011;32:534–43.
69. Chiang MC, Barysheva M, Shattuck DW, Lee AD, Madsen SK, Avedissian C, et al. Genetics of brain fiber architecture and intellectual performance. J Neurosci. 2009;29:2212–24.
70. Salat DH, Tuch DS, Greve DN, van der Kouwe AJ, Hevelone ND, Zaleta AK, et al. Age-related alterations in white matter microstructure measured by diffusion tensor imaging. Neurobiol Aging. 2005;26:1215–27.
71. Bach M, Laun FB, Leemans A, Tax CM, Biessels GJ, Stieltjes B, et al. Methodological considerations on tract-based spatial statistics (TBSS). NeuroImage. 2014;100:358–69.
72. Roine T, Jeurissen B, Perrone D, Aelterman J, Leemans A, Philips W, et al. Isotropic non-white matter partial volume effects in constrained spherical deconvolution. Front Neuroinform. 2014;8:28.
73. Peltonen L, Jalanko A, Varilo T. Molecular genetics of the Finnish disease heritage. Hum Mol Genet. 1999;8:1913–23.
74. Farquharson S, Tournier JD, Calamante F, Fabinyi G, Schneider-Kolsky M, Jackson GD, et al. White matter fiber tractography: why we need to move beyond DTI. J Neurosurg. 2013;118:1367–77.
76. Aarnink SH, Vos SB, Leemans A, Jernigan TL, Madsen KS, Baaré WF. Automated longitudinal intra-subject analysis (ALISA) for diffusion MRI tractography. NeuroImage. 2014;86:404–16.
77. Van Hecke W, Sijbers J, D'Agostino E, Maes F, De Backer S, Vandervliet E, et al. On the construction of an inter-subject diffusion tensor magnetic resonance atlas of the healthy human brain. NeuroImage. 2008;43:69–80. 78. Van Hecke W, Leemans A, Sage CA, Emsell L, Veraart J, Sijbers J, et al. The
effect of template selection on diffusion tensor voxel-based analysis results. NeuroImage. 2011;55:566–73.
doi:10.1186/2040-2392-6-4
Cite this article as:Roineet al.:Constrained spherical deconvolution-based tractography and tract-deconvolution-based spatial statistics show abnormal microstructural organization in Asperger syndrome.Molecular Autism
20156:4.
Submit your next manuscript to BioMed Central and take full advantage of:
• Convenient online submission
• Thorough peer review
• No space constraints or color figure charges
• Immediate publication on acceptance
• Inclusion in PubMed, CAS, Scopus and Google Scholar
• Research which is freely available for redistribution