ANALYSIS OF THE QUALITY OF SERVICES
FOR CHECKOUT OPERATION IN ICA
SUPERMARKET USING QUEUING THEORY
by
Azmat Nafees
Liwen Liang
A ‘C level’ essay in Statistics submitted in partial
fulfillment of the requirements for the degree of
M. Sc.
Department of Economics and Society
ABSTRACT
ANALYSIS OF THE QUALITY OF SERVICES FOR CHECKOUT OPERATION IN ICA
SUPERMARKET USING QUEUING THEORY
by Azmat Nafees and Liwen Liang
Member of the Supervisory Committee: Professor Richard Stridbek Department of Statistics
This paper describes a queuing model for a single server process. This model is developed for a checkout sales operation in ICA supermarket, Borlange. The model contains one server which is checkout sales counter area. This server consists of a series of Queues. In any service system, a queue forms whenever current demand exceeds the existing capacity to serve. This occurs when the checkout operation unit is too busy to serve the arriving costumers, immediately. After the office hours, in which arrivals of customers occur at varying times hence the service times also vary accordingly, the chances of number of customers may increase.
This paper contains the analysis of Quality service of supermarket account service unit. One of the expected gains from studying queuing systems is to make the services more efficient in terms of resources utilization, hence eliminating the queues so customers will not have to wait when servers are too busy. In other words, trying to detect the variability in service and time, and eliminate that variability to improve the quality of the services where required, is the aim of our research paper.
This study requires an empirical data which may include the variables like, Arrival Time in the checkout operating unit, Departure Time, etc. A questionnaire is developed to collect the data for such variables and the reaction of the ICA Supermarket from the customers separately.
TABLE OF CONTENTS
Acknowledgments... ii
Objectives of study ...iii
C h a p t e r 1 ...1
Introduction...1
C h a p t e r 2 ...3
background...3
Delimitations in improving Quality of Service by customer’s perceptions: ...4
C h a p t e r 3 ...5
Methodology...5
Queuing Theory...5
Queuing Model (Multiple Queue, Single Stage (facility) Model) ...5
Assumptions ...6
Characteristics of Queuing Model...7
Basic Queuing Process...7
Parameters in Queuing Models (Single Server, Single Phase Model) ...8
Other Notations & their Description assuming the system is in steady-state condition ...8
C h a p t e r 4 ...9
Analysis of checkout sales operation Service in ICA...9
Analysis for Weekends...9
Results...9
Interpretation of results...10
Analysis for Weekdays ...10
Results...10
Interpretation of results...11
Results for Weekends with Multiple server ...11
Interpretation of results...12
Discussion ...13
Appendix ...14
Questionnaire...14
Spreadsheet ...14
ACKNOWLEDGMENTS
We would like to thank the staff of ICA. We are extremely grateful to our project advisor Mr. Richard Stridbeck who assisted us from the beginning to the end of the project report and gave guidance and a sense of direction to us. We are very grateful to a choco-bar staff in ICA, who let us sit in their bar to work for the data collection for our project.
OBJECTIVES OF STUDY
The purpose of this study is to evaluate the quality of the service using the observed data and to develop a mathematical model to analyze the performance of checking out sales service unit of ICA Supermarket. The main idea in the application of a mathematical model is to measure the service rate provided to the customers while checking out, and to measure the gaps between the arrivals of each customer per hour. The other important factor analyzed is about the perspective of the customers regarding the quality of service using questionnaire.
C h a p t e r 1
INTRODUCTION
Customer’s perception of the quality of the service is an important part of a business for any organization. This paper is about the analysis of quality service of supermarket account service unit by using queuing theory to describe a model. The research object of the model is ICA Supermarket Borlange.
ICA AB is a Swedish corporate group in the retail business, which started in1938 and operated 1,668 stores as of 2003. The stores have different profiles, depending on location, range of products and size:
1. ICA Nara (“ICA Near-by”, convenience-type stores for daily retail needs);
2. ICA Supermarket (Mid-size supermarkets, located near where customers dwell or work carrying a wide range of products);
3. ICA Kvantum (Superstores for large, planned, purchases. Large spaces allocated for traffic and parking. Typically located outside of the cities);
4. MAXI ICA Stormarknad (these are Hypermarkets with a full range of groceries as well as fashions, home wares, entertainment and electrical. Smaller stores do not offer the fashion and electrical ranges while the largest stores also have a DIY and Garden department).
Each store is owned and operated separately, but operations are coordinated within the group. All feature ICA brand products.
There are two ICA Supermarkets in Borlange, the bigger one was chosen to be the research object and to collect data from.
customer per hour. In order to get an overall perspective of the customer’s quality of service, the questionnaires which indicate the result in percentages, are also used to get the evaluation from the customers directly.
There are seven counters in ICA Borlange at one place, which means consisting of one server (single service facility) by the Queuing Theory. A queue forms whenever current demand exceeds the existing capacity to serve when each counter is so busy that arriving customers cannot receive immediate service facility. So one-server process queuing model works in this situation.
The data used in the Queuing Theory is collected for various arrival times of each customer in two days by the questionnaire form. The observations for number of customers in a queue, their arrival-time and departure-arrival-time were taken without distracting the employees. The whole procedure of the service unit each day was observed and recorded using a time-watch during the same time period for each day. In addition, the questionnaires are conducted at the same timings for each day.
The aim of studying queuing system is trying to detect the variability in service and time, and find the ways to eliminate it to improve the quality of the services where required. The results obtained from ICA Supermarket using queuing model suggest that sales checkout operating unit is rather busy each day of a week but the service is satisfactory.
C h a p t e r 2
BACKGROUND
Quality of Service is defined as the perception of the customers about the service they avail. The customer’s perception of the quality of the service being delivered will determine whether or not they are satisfied with that service and whether or not they shall want to continue to work with that service provider. There may be the temptation to consider the adoption of a customer’s perspective to be biased and possibly even one-sided. The most important point is that the customer is concerned with the business functionality, that is, customers need to be able to use the checking out service in ICA to perform as a business function.
The concerns of the customers can be classified into three broad categories: Availability, Performance and Accuracy. Whereas, the Affordable cost of the service is a concern of ICA.
Availability focuses upon the question whether the services are available to the customer when the
customer wishes to use them, that is, whether the salesman is available or all of the required components are available at the cash counter (checkout operation unit.)
Performance can hold various meanings for different people. The main factor of performance is time,
the service should be provided sufficiently in acceptable time. For instance, the checkout operation unit of ICA provides sufficient information and service to the customers for purchasing the items.
Accuracy is concerned with the question of whether or not the service performs accurately. If the
services do not accurately perform their functions, then high availability and high performance are worthless, that is, all the required functions from scanning item’s price to taking money from the customer (in form of cash, credit card payment, or by a maestro card) should be completed accurately by the employee.
Affordable, the cost of the service cannot be ignored from the list of the components of the quality of
provided, as well as the timeliness of the service function. Cost is not directly part of quality of service being delivered; it is a limiting factor and cannot be ignored.
ICA supermarket in Borlange is emphasizing on all of these above categories. To analyze the three main concerns of customer: availability, performance and accuracy, regarding checkout sales service, the main service unit is chosen as a server of Queuing model that is the sales checkout operating unit.
Delimitations in improving Quality of Service by customer’s perceptions:
The major factors that determine a customer’s expectations and perceptions concerning service quality, and three gaps that can lead to dissatisfaction with service delivery
Gap between the customers’ expectations and the marketers perceptions
Managers do not always have an accurate understanding of what customers want or how they will evaluate firms’ service efforts. The first step is providing a good service, then, is to collect information through customer surveys, evaluations of customer complaints, or other methods, to determine which service attributes customers consider important.
Gap between management perceptions and service quality specifications
Even when management has a clear understanding of customer’s want, that understanding might not get translated into effective operating standards. The policies concerning customer service may be unclear or poorly communicated to employees. Unless the employees know what the company’s service policies are and believe that management is seriously committed to those standards, their performance is likely to fall short of desired levels.
Gap between perceived service and expected service
C h a p t e r 3
METHODOLOGY
Queuing Theory
Delays and queuing problems are most common features not only in our daily-life situations such as at a bank or postal office, at a ticketing office, in public transportation or in a traffic jam but also in more technical environments, such as in manufacturing, computer networking and telecommunications. They play an essential role for business process re-engineering purposes in administrative tasks.
Whenever customers arrive at a service facility, some of them have to wait before they receive the desired service. It means that the customer has to wait for his/her turn, may be in a line. Queuing theory usesmathematics to calculate how to provide services that will minimize the waiting time of the customers.
Sometimes, insufficiencies in services also occur due to an undue wait in service may be because of new employee. Delays in service jobs beyond their due time may result in losing future business opportunities. Queuing theory is the study of waiting in all these various situations. It uses queuing models to represent the various types of queuing systems that arise in practice. The models enable finding an appropriate balance between the cost of service and the amount of waiting.
Queuing Model (Multiple Queue, Single Stage (facility) Model)
Assumptions
a) Arrivals follow a Poisson distribution
1.The number of the customers that come to the account during time period [t, t+s) only depends on the length of the time period ‘s’ but no relationship with the start time ‘t’ 2.The number of the customers that come to the account during time period [t, t+s) is
independent with the coming of customers that before time t
3.If s is small enough, there will be at most one customer come to the account during time period [t, t+s)
So, the number of customers that come to the counter is a Poisson process and the arrivals follow a Poisson distribution.
b) Service times are exponentially distributed
The arrivals follow a Poisson distribution, so the length of the time between two arrivals should follow exponential distribution. And according to our observation, the supermarket is so busy that all the accounts work continuously. That means the length of the time between two arrivals is just the length of the service time. So the service times are exponentially distributed.
Q-Q plot is used to check whether the service time is exponentially distributed:
Exponential Q-Q Plot of Service Time
Observed Value 5 4 3 2 1 0 Exp ec te d Ex po ne nt ia l V al ue 5 4 3 2 1 0
d) No customer leaves the queue without being served e) Infinite population
f) FIFO (First In First Out)+
g) The arrival rate is smaller than the combined service rate
Characteristics of Queuing Model
Time: neither continuous nor in equidistant discrete steps, but proceeding from event to event;
Object: at least three different kinds of objects namely customer (dynamic object), queue and a server (static object)
Stochastic: arrival and serving times are in-deterministic (or uncertain)
Dynamic: states of servers, queues, and customers depend on past states
Basic Queuing Process
Customers requiring service are generated over time by an input source. The required service is then performed for the customer by the service mechanism, after which the customer leaves the queuing system.
In this model, three various sub-processes may be distinguished:
• Arrival Process: includes finite/infinite number of customers arriving, one/several types of customers, one/several types of customer demands, deterministic or stochastic arrival distance, and arrival intensity.
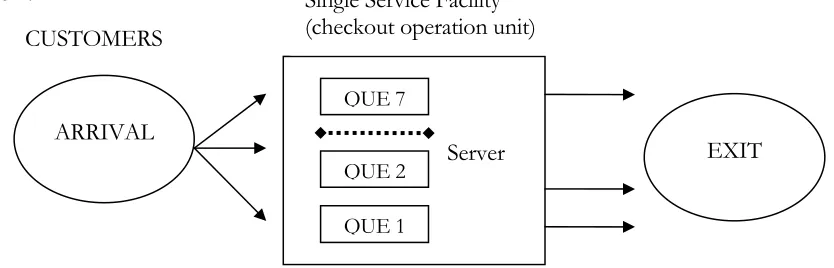
• Waiting Process: includes length of queue, server order (First In First Out/Last In First Out) Fig. 1: Single Stage Queuing Model with Multiple Queues in Single
Server of Sales Checkout Operation in ICA supermarket CUSTOMERS
Single Service Facility (checkout operation unit)
QUE 7
QUE 2
QUE 1
ARRIVAL
• Server Process: includes a type of a server, serving rate and serving time
Parameters in Queuing Models (Single Server, Single Phase Model) S number of servers (Checkout sales operation units in ICA)
λ arrival rate (Average number of customers arriving in each queue at a server in one hour) µ serving rate (Average number of customers being served in a system per hour)
ρ System intensity or load, utilization factor (= λ/(sμ) ) (the expected factor of time the server is busy, that is service capability being utilized on the average arriving customers)
The Queuing model is commonly labeled as M/M/s/K, where first M represents Markovian exponential distribution of inter-arrival times, second M represents Markovian exponential distribution of service times, s (a positive integer) represents the number of servers, and K is the specified number of customers in a queuing system. This general model contains only limited number of K customers in the system. However, if there are unlimited number of customers exist, which means K = ∞, then our model will be labeled as M/M/s (Hillier & Lieberman, 2001.)
Other Notations & their Description assuming the system is in steady-state condition
Pn Probability of exactly n customers in the system
P0 Probability of no (or zero) customers in the system (= Probability that the system is idle)
L Average number of customers in the system (waiting to be served) =
∑
∞
=0
n n
nP
Lq Average number of customers in the waiting line (queue) =
∑
∞ = − s n n P s n ) (
W Average waiting time a customer spends in the system including the service time (Average
waiting time for each customer for waiting and being served) = λ
L
where
∑
∞= = 0 n n nP λ λ
Wq Average waiting time a customer spends waiting in line excluding the service time =
λ q L
C h a p t e r 4
ANALYSIS OF CHECKOUT SALES OPERATION SERVICE IN ICA
A sales checkout service has 7 waiting lines in a form of parallel cash counters (see fig.1 in the last chapter). Customers are served on a first-come, first-served (FIFO) basis as a salesman of checkout operation unit becomes free. The data has been collected for two different days, which is Wednesday (weekday) and Friday (weekend). It was assumed that the customers crowd in more, on average, on weekends rather than the weekdays.
Analysis for Weekends
On Friday, customers arrive at an average of 82 customers per hour (Poisson-distributed), and an average of 97 customers can be served per hour by a salesperson (Poisson distributed).
Results
The parameters and corresponding characteristics in Queuing Model M/M/1, assuming system is in steady-state condition, are (for a weekend):
S number of servers = 1
λ arrival rate = 82 per hour
µ serving rate = 87 per server per hour
Μs Queue Capacity (maximum waiting space) = 7 M Customer population = M
sμ (1) (87) = 87 (average service time)
ρ = λ/(sμ) = 82 / 87 = 0.9425
Overall system utilization = ρ = 94.2529 %
Average number of customers in the system (L) =
∑
= ρ/(1 − ρ) = 16.4 (where Pn = ρn(1 − ρ))∞
=0
n n
nP
Average number of customers in the queue (Lq) =
∑
= ρ2/(1 − ρ) = 15.4575∞ = − 1 ) 1 ( n n P n
The probability that all servers are idle (Po) = (1 − ρ) = 5.7471 %
Interpretation of results
The performance of the checkout service is very good. On Friday, the waiting time (Wq = 11.31 min) is a bit long, whereas on average 16 customers per hour has to wait in a queue. Although the sales checkout unit has 7 parallel counters (each of them has an individual salesman to deal with the customers in a queue), it is possible that some of the checkout units are idle.
Analysis for Weekdays
On Wednesday, customers arrive at an average of 118 customers per hour (Poisson-distributed), and an average of 125 customers can be served per hour by a salesperson (Poisson distributed).
Results
The parameters and corresponding characteristics in Queuing Model M/M/1, assuming system is in steady-state condition, are (for a weekday):
S number of servers = 1
λ arrival rate = 118 per hour
µ serving rate = 125 per server per hour
Μs Queue Capacity (maximum waiting space) = 7 M Customer population = M
sμ (1) (125) = 125 (average service time)
ρ = λ/(sμ) = 118 / 125 = 0.9440
Overall system utilization = ρ = 94.40 %
Average number of customers in the system (L) =
∑
= ρ/(1 − ρ) = 16.8571 (where Pn = ρn(1 − ρ))∞
=0
n n
nP
Average number of customers in the queue (Lq) =
∑
= ρ2/(1 − ρ) = 15.9131∞ = − 1 ) 1 ( n n P n
Interpretation of results
The performance of the service is very good. On Wednesday, the waiting time (Wq = 8 min) is not that long; whereas on average (Lq) 16 customers per hour has to wait in a queue. Since the sales checkout unit has 7 parallel counters each of them has an individual salesman to deal with the customers in a queue, so it reduces the waiting time of the customers to be served.
If we consider each salesperson in sales checkout unit as a server then it may reduce waiting time approximately zero. That is, our model will be changed as Multiple Queues, Multiple Servers, Single Stage (checkout facility) Model (Sheu, C., Babbar S. (Jun 1996)).
Fig. 2: Single Stage Queuing Model with Multiple Queues and Multiple Servers of Sales Checkout Operation in ICA supermarket
CUSTOMERS
Queue 7
Queue 2
Queue 1
EXIT ARRIVAL
Single Service Facility (checkout operation unit)
Server 7
Server 2
Server 1
In that case, we can take the results for Friday’s data as an example:
Results for Weekends
The parameters and corresponding characteristics in Queuing Model M/M/7, assuming system in a steady-state condition, are (for a weekend):
S number of servers = 7
λ arrival rate = 82 per hour
µ serving rate = 87 per server per hour
Μs Queue Capacity (maximum waiting space) = 1 M Customer population = M
sμ (7) (87) = 609 (average service time)
Overall system utilization = ρ = 13.4647 %
Average number of customers in the system (L) = 0.9425 Average number of customers in the queue (Lq) = 0
Interpretation of results
DISCUSSION
The insight gained from studying queuing systems is that they may not be very efficient in terms of resources utilization. Queues form and customers wait even though servers may be idle much of the time. The fault is not in the model or underlying assumptions. It is a direct consequence of the variability of the arrival and service processes. If variability could be eliminated, system could be designed economically so that there would be little or no waiting, and hence no need for queuing models.
With the increasing number of customers coming to ICA for shopping, either for usual grocery or for some house wares, there is a trained employee serving at each service unit. Sales checkout service has sufficient number of employees (Queues) which is helpful during the peak hours of weekends or weekdays. Other than these hours, there is no need of various Queues in a model. Increasing more than sufficient number of servers may not be the solution to increase the efficiency of the service by each service unit. Considering salespersons in a server as an individual server, contradicts the queuing system; that is, no queue is formed in a server in that situation. In other words, the entire sales checkout units are functional unnecessarily whereas numbers of customers are limited.
APPENDIX
Questionnaire
This questionnaire is only for Employees serving at Sales checkout unit of ICA supermarket. Therefore, all information is intended specifically to the Service Unit.
Service provided to the customer at the spot (Quality of Service) Please mark √ into
□
and fill into the following questions:1. At what time the customer arrived at the sales checkout unit? __________________
2. Is there any other customer waiting for his turn, while the service unit is already serving another customer?
□
No□
Yes3. If yes, then how many?
□
1□
2□
3□
4□
5□
6 or more 4. Mode of payment for purchase of items at checkout unit:□
Cash□
Credit card5. The checking out operation service given to the customer for sales item was _____________ for the customer.
□
Sufficient□
Moderately Sufficient□
Insufficient / IncompleteSpreadsheet
REFERENCES
Bhatti, S. A., Bhatti, N. A. (1998), Operations Research – An Introduction, Department of Computer Science, Quad-e-Azam University, p.315–356
Hillier, F. S., Lieberman, G. J. (2001), Introduction to Operations Research, McGraw-Hill higher education, 7th edition, p834–8
Jensen, Paul A. (2004), “Queuing models,” Operations Research Models and Methods, www.me.utexas.edu/~jensen/ORMM/models/unit/queue/index.html
Jensen, Paul A. (2004), “Queuing models’ terminology,” Operations Research Models and Methods, www.me.utexas.edu/~jensen/ORMM/models/unit/queue/subunits/terminology/index.html
Jensen, Paul A. (2004), “Queuing models’ simulation,” Operations Research Models and Methods, www.me.utexas.edu/~jensen/ORMM/models/unit/simulate/index.html
Keith G. Calkins (May 2005), “Queuing theory and Poisson distribution,” Statistical Probabilities and Distributions, Ch. 10, www.Andrews.edu/~calkins/math/webtexts/prod10.html
Sheu, C., Babbar S. (Jun 1996), “A managerial assessment of the waiting-time performance for alternative service process designs,” Omega, Int. J. Mgmt Sci. Vol. 24, No. 6, pp. 689-703
Tsuei, Thin-Fong; Yamamoto, W., “A Processing queuing simulation model for multiprocessor system performance analysis,” Sun Microsystems, Inc.
_______, Operations Management – Focusing on Quality & competitiveness, EW University, Ch. 16