AP Chemistry #9 – Weak Acid-Base and Strong Acid-Base Titration
Curves
Context for this Investigation:
A titration is a process used to determine the volume of a solution that is needed to react with a given amount of another substance. In this experiment, your goal is to determine the molar concentration of two acid solutions by conducting titrations with a base of known concentration. You will be testing a strong acid, HCl, solution and a weak acid, HC2H3O2, solution. You will use the sodium hydroxide, NaOH, solution as your base of known concentration. The stoichiometry of the two reactions is identical; thus, your calculations will be straightforward. However, you will observe a significant difference in how the two acid solutions react with NaOH.
You will use a computer to monitor pH as you titrate. The region of most rapid pH change will then be used to determine the equivalence point. The volume of NaOH titrant used at the equivalence point will be used to determine the molarity of the HCl solution. While performing these titrations, you will be able to view the titration curves on the screen of the computer, and you will print out these curves after all of the data has been collected. One of the objectives of this lab is to examine the features of a strong acid-strong base titration curve and a weak acid-acid-strong base titration curve. You will also learn how to estimate the pKa and the Ka for a weak acid from its titration curve.
Equations and Explanations:
In an acid-base neutralization reaction, an acid reacts with a base to produce a salt and water: HA(aq) + MOH(aq) à MA(aq) + H2O(l) Equation 1
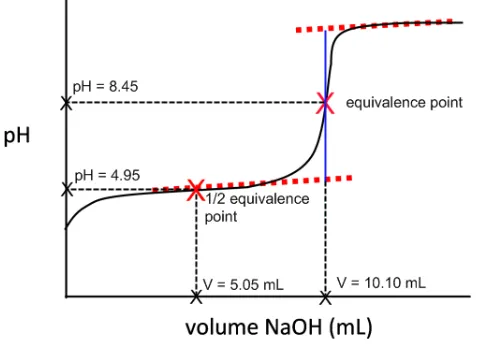
At the equivalence point for an acid-base neutralization reaction, the amount of the base added is equal to the amount of acid initially present; thus, the acid has been completely neutralized. The point in a titration where the indicator changes color is called the endpoint. An indicator is selected to that the color change will occur as close to the equivalence point as possible. For a given acid-base titration, a suitable indicator changes color over a pH range that coincides with the portion of the curve near the equivalence point where the pH rises sharply.
When a weak acid solution is initially present, the following ionization reaction will occur:
The equilibrium constant for the ionization of the acid, Ka is:
At the volume half-way to the equivalence point during the titration of a weak acid by a strong base, one-half of the weak acid, HA, has been converted to its conjugate base, A-. Thus, at the half-equivalence point, the concentration of the excess acid equals the concentration of the conjugate base formed, [HA] = [A-]. Equation 3 then simplifies to become:
Equation 4 can be written in logarithmic form by taking the negative logs of both sides:
The equivalence point occurs at the midpoint of the region where pH rises rapidly. The pKa can be
determined by estimated the pH at the volume point half-way to the equivalence point.
To perform the experiment, a computer-interfaced pH sensor will be placed in the acid solution. You will use the computer to monitor pH as you titrate, and you will enter the corresponding values for the mL of NaOH added. You will need to generate enough data points to obtain a smooth curve. In some regions of the titration, the pH changes very slowly, and you can add larger increments of base at a time. Near the equivalence point, the pH changes very quickly, and you will need to add single drops of base at a time.
Materials:
Vernier computer interface wash bottle
computer distilled water
Vernier pH Sensor ring stand
0.100 M sodium hydroxide, NaOH solution utility clamp hydrochloric acid, HCl, solution, unknown molarity 250 mL beaker
acetic acid, CH3COOH, solution, unknown molarity 10 mL graduated cylinder
magnetic stirrer 50 mL graduated cylinder
stirring bar or Microstirrer buret
Safety:
While working with acids and bases, proper attention should be paid to safety. Goggles should be worn at all times while working in the laboratory. Acids and bases are corrosive materials.
Procedure:
1. Obtain and wear goggles.
2. Obtain about 25 mL of a hydrochloric acid solution of unknown concentration. Add 50 mL of distilled water to a 250 mL beaker. Use a graduated cylinder to transfer 10 mL of the HCl solution into the beaker. CAUTION: Handle the hydrochloric acid with care. It can cause painful burns if it comes in contact with the skin.
3. Place the beaker on a magnetic stirrer and add a stirring bar. If no magnetic stirrer is available, stir the reaction mixture with a stirring rod during the titration.
4. Connect a pH Sensor to Channel 1 of a Vernier computer interface. Connect the interface to the computer using the proper cable.
5. Set up a ring stand, buret clamp, and 50.0 mL buret to conduct the titration (see Figure 1). Rinse Buret (to rinse you need to fill buret with distilled water and run it through and then fill with titrant (NaOH) and run it through) and fill the buret with 0.100 M NaOH solution. Note: Record the precise concentration of the NaOH solution in your data table. CAUTION: Sodium hydroxide solution is caustic. Avoid spilling it on your GCC CHM 152LL: Acid-Base Titration Curves Using a pH Meter page 2 of 5
Figure 1 shows a typical titration curve for the titration of a weak acid by NaOH (with labeled x and y
axes).
Figure 1. Acid-Base Titration curve for WEAK monoprotic acid.
To perform the experiment, a computer-interfaced pH sensor will be placed in the the acid solution. You will use the computer to monitor pH as you titrate, and you will enter the corresponding values for the mL of NaOH added. You will need to generate enough data points to obtain a smooth curve. In some regions of the titration, the pH changes very slowly, and you can add larger increments of base at a time. Near the equivalence point, the pH changes very quickly, and you will need to add single drops of base at a time.
Procedure
Caution: Sodium hydroxide will attack your skin and is very effective at destroying the tissue of the eyeballs. Make sure you are wearing your goggles at all times and that you rinse off any sodium hydroxide immediately!
Work in groups of 2-3 students.
1. Obtain the following approximate volumes of the standardized solutions in separate beakers: 15 mL of HCl(aq), 15 mL of CH3COOH(aq), and 50 mL of NaOH(aq). Record the concentrations of the HCl, CH3COOHand NaOH solutions in your laboratory notebook and lab report!
2. Calculate the volume of base needed for both titrations and show your professor the answers. Note: you should assume that 10.00 mL of acid is present for each titration since that is the amount you pipet into the titration beaker.
3. Obtain a magnetic stir plate, and attach a buret clamp to the vertical bar on the stir plate. Clean and rinse a buret with a few mL of the NaOH, and secure the buret with the buret clamp. Fill the buret a little above the 0.00-mL mark with the NaOH solution. Drain a small amount of the NaOH solution into your waste beaker so it fills the buret tip and leaves the NaOH at the 0.00-mL level of the buret.
4. Measure 50 mL of deionized water with a graduated cylinder and pour into a 250 mL beaker. Pipet 10.00 mL of the standardized HCl solution into the beaker and add 2-3 drops of phenolphthalein indicator. Place the beaker on the center of the magnetic stirrer, and adjust the position of the buret above the beaker.
5. Obtain and assemble the computer and LabPro system. Attach the pH sensor to the CH 1 outlet on the LabPro unit. Allow some space between your titration equipment and the computer! 6. To access the experiment file, double-click on the “Shortcut to GCC Chm Labpro” folder on the
skin or clothing. Make sure to remove any and all bubbles from the buret by emptying some of the NaOH solution before you begin the experiment.
6. Use a utility clamp to suspend the pH Sensor on the ring stand. Position the pH Sensor so that its tip is immersed in the HCl solution but is not struck by the stirring bar. Gently stir the beaker of acid solution.
7. Run the Logger Pro program on your computer. You will need to change the settings on your computer display. Click the graph icon on the bottom left corner to add a title. Click the “Mode” in the far bottom left corner to change data collection to “Event Based”. Be sure “Events with Entry” is selected. Change the “Event Name” to “Volume of NaOH” and units should be entered as “mL”. Once finished click “done”. Your data table should now reflect the type of data you wish to collect in order to construct your titration curve.
8. You are now ready to begin the titration.
a. Before adding NaOH titrant, click on the top of the screen. Once the displayed pH reading has stabilized, click , the pH should be showing in the bottom right corner. In the edit box, type “0” (for 0 mL of base added). Press the “Keep Point” botton to store the first data pair for this experiment.
b. Add the next increment of NaOH (enough to raise the pH about 0.15 units). When the pH stabilizes, again click . In the edit box, type the current buret reading as accurately as possible. Press the “Keep Point” botton. You have now saved the second data pair for the experiment.
c. Continue adding NaOH solution in small increments that raise the pH by about 0.15 units and enter the buret reading after each increment. When a pH value of
approximately 3.5 is reached, change to a one-drop increment, but only record points after a pH change of 0.15 units.
d. After a pH value of approximately 10 is reached, add larger increments that raise the pH again by about 0.15 pH units, and enter the buret level after each increment. e. Continue adding NaOH solution until the pH value remains constant.
9. When you have finished collecting data, click . Dispose of the reaction mixture as directed. Rinse the pH Sensor with distilled water in preparation for the second titration.
10. Find the equivalence point, which is the largest increase in pH upon the addition of a very small amount of NaOH solution.
11. Go back to the original titration graph. Export a copy of the graph and data gathered. (It should go into your drive). Be sure to share with all group members. You will need to print a copy of the graph and the data set for your lab notebook.
12. Repeat the necessary steps to test the acetic acid solution. Analyze, print, and save the titration data for your acetic acid solution trial. You should have two data tables and two titration curves, be sure you have labeled/titled each set.
Data Collection and Computation:
1. Be sure to write neatly or (print and tape) the two data tables collected during each of your two titrations.
2. Summarize your important data in a summary table (like the one below).
Summary Table Example
Volume of acid
(mL)
[NaOH] (M)
Equivalence point (mL)
pH at Equivalence
point
HCl Trial
CH3COOH
Trial
4. Calculate the molar concentration (molarity) of the HCl solution and the acetic acid solution. (use MaVa=MbVb equation)
5. Compare the actual molar concentration of your two acid solutions (0.1 M HCl and 0.1 M acetic acid) with your calculated molarities. What is the percent error?
6. The equivalence points of the two titration curves were not in the same pH range. Explain.
7. Using an estimated pKa value from your acetic acid-sodium hydroxide titration curve at the half-equivalence point, show your calculation of the experimental Ka value for acetic acid.
8. Given the theoretical value for Ka acetic acid = 1.8 x 10⁻⁵, calculate the percent error of your experimental value.
Post-Lab Questions:
1. Why is it important to rinse the buret with distilled water and titrant?
2. Why didn’t we calculate a Ka value for HCl? Explain.
3. Calculate the pH at each point during the titration of 25.00 mL 0.100 M ascorbic acid, C6H8O6 (Ka = 8.0 x 10⁻⁵) with the following volumes of 0.125 M NaOH:
a. 0.00 mL b. 10.00 mL c. 20.00 mL d. 30.00 mL
TEACHER NOTES:
CONC of HCL = 0.3M for stock (will make 0.1M soln)