Chapter
6
Fair Game Review
Find the missing value in the table.
1. 2.
3. 4.
5. 6.
x y
1 5 3 7 5 9 7
x y
2 6 4 12 8 24 12
x y
6 11 14 19 26 31 41
x y
8 4 18 9 28 14 38
x y
4 2.5 11 9.5 15 13.5 21
x y
Chapter
6
Fair Game Review
(continued)Evaluate the expression when x = 2, y = 3,and z = −4.
7. 3x − 2 8. − −6 2y
9. 2z2 10. 3y − 3z
11. 8 1
x − 12. 1 2
6.1
Relations and Functions
For use with Activity 6.1Essential Question
How can you use a mapping diagram to show the relationship between two data sets?Work with a partner. Complete the mapping diagram.
a. Area A
b. Perimeter P
c. Circumference C
d. Volume V
1 ACTIVITY: Constructing Mapping Diagrams
Input, x Output, A
1
2
3
4
Input, x Output, P
1
2
3
4
Input, r Output, C
1
2
3
4
Input, h Output, V
1
2
3
4 2
x
2
x
r
3
6.1 Relations and Functions (continued)
Work with a partner. How many outputs are assigned to each input? Describe a possible situation for each mapping diagram.
a.
b.
Work with a partner. Describe the pattern in the mapping diagram. Complete the diagram.
a.
2 ACTIVITY: Describing Situations
Input, x Output, y
12 23 30 48
6 13 15 20
Input, x Output, y
10 11 12 13
0 1 2 3
3 ACTIVITY: Interpreting Mapping Diagrams
Input, t Output, M
1
2
3
4
5
6
7
8
10
6.1 Relations and Functions(continued)
b.
What Is Your Answer?
4. IN YOUR OWN WORDS How can you use a mapping diagram to show the relationship between two data sets?
Input, x Output, A
1
2
3
4
5
6
7
4 3
5 3
2
6.1
Practice
For use after Lesson 6.1List the ordered pairs shown in the mapping diagram.
1. 2.
3. Draw a mapping diagram for the graph. Then describe the pattern of inputs and outputs.
4. The table shows the number of beads needed to make a bracelet. Use the table to draw a mapping diagram.
Input Output 2 4 6 8 1 3 5 7 Input Output 1 7 8 0 1 5 6 x y 1 4 5 2 3 1 2 3
6.2
Representations of Functions
For use with Activity 6.2Essential Question
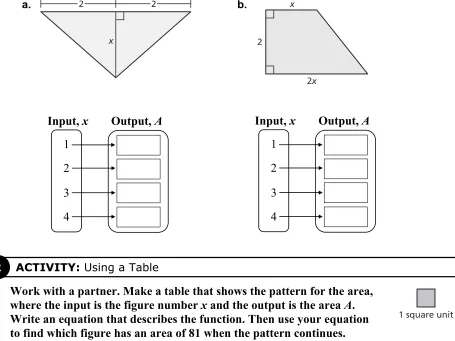
How can you represent a function in different ways?Work with a partner. Complete the mapping diagram on the next page for the area of the figure. Then write an equation that describes the function.
a. b.
Work with a partner. Make a table that shows the pattern for the area,
where the input is the figure number x and the output is the area A.
Write an equation that describes the function. Then use your equation to find which figure has an area of 81 when the pattern continues.
a.
1 ACTIVITY: Describing a Function
2 ACTIVITY: Using a Table
2 2
x 2
2x x
Input, x Output, A
1
2
3
4
Input, x Output, A
1
2
3
4
1 square unit
6.2 Representations of Functions (continued)
b.
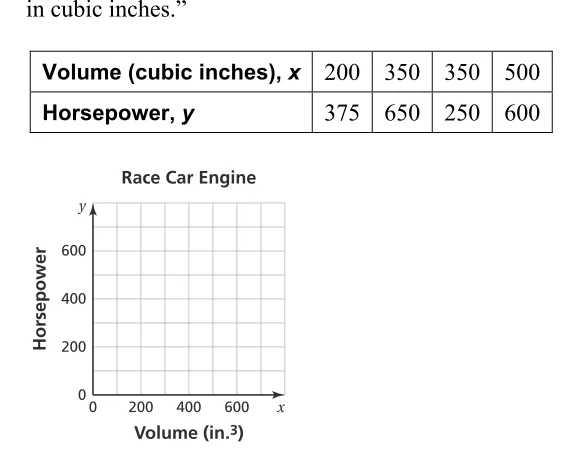
Work with a partner. Graph the data. Use the graph to test the truth of each statement. If the statement is true, write an equation that shows how to obtain one measurement from the other measurement.
a. “You can find the horsepower of a race car engine if you know its volume in cubic inches.”
Figure 1 Figure 2 Figure 3 Figure 4
Volume (cubic inches), x 200 350 350 500
Horsepower, y 375 650 250 600
0 0 200 400 600
200 400
Volume (in.3) Race Car Engine
Horsepower
600 x y
6.2 Representations of Functions (continued)
b. “You can find the volume of a race car engine in cubic centimeters if you know its volume in cubic inches.”
Work with a partner. The table shows the average speeds of the winners of the Daytona 500. Graph the data. Can you use the graph to predict future winning speeds? Explain why or why not.
What Is Your Answer?
5. IN YOUR OWN WORDS How can you represent a function in different ways?
4 ACTIVITY: Interpreting a Graph
Volume (cubic inches), x 100 200 300
Volume (cubic centimeters), y 1640 3280 4920
Year 2004 2005 2006 2007 2008 2009 2010 2011 2012
Speed (mi/h) 156 135 143 149 153 133 137 130 140
0 0 2000 4000 6000
200 400
Volume (in.3) Race Car Engine
V
olume (cm
3)
600 x y
0 130 135 140 145 150 155 160
200420052006200720082009201020112012 Years
Daytona 500 Winners’ Average Speeds
Speed (mi/h)
6.2
Practice
For use after Lesson 6.2Write a function rule for the statement.
1. The output is four times the input. 2. The output is eight less than the input.
Find the value of y for the given value of x.
3. ; 12
3 x
y = x = 4. y = 5x + 9; x = 2
5. You set up a hot chocolate stand at a football game. The cost of your supplies is $75. You charge $0.50 for each cup of hot chocolate.
a. Write a function that represents the profit P for selling c cups of hot chocolate.
6.3
Linear Functions
For use with Activity 6.3Essential Question
How can you use a function to describe a linear pattern?Work with a partner.
• Plot the points from the table in a coordinate plane.
• Write a linear equation for the function.
a. b.
c. d.
1 ACTIVITY: Finding Linear Patterns
x 0 2 4 6 8
y 150 125 100 75 50
x 4 6 8 10 12
y 15 20 25 30 35
x –4 –2 0 2 4
y 4 6 8 10 12
x –4 –2 0 2 4
y 1 0 –1 –2 –3
x y 100 50 0 200 150 4 5 3 2 1
0 6 7 8 9 x
y 20 10 0 40 30 8 4
0 12 16
6.3 Linear Functions (continued)
Work with a partner. The table shows a familiar linear pattern from geometry.
• Write a function that relates y to x.
• What do the variables x and y represent?
• Graph the function.
a. b.
2 ACTIVITY: Finding Linear Patterns
x 1 2 3 4 5
y 2π 4π 6π 8π 10π
x 1 2 3 4 5
y 10 12 14 16 18
x
4
x
x y
6.3 Linear Functions (continued)
c. d.
What Is Your Answer?
3. IN YOUR OWN WORDS How can you use a function to describe a linear pattern?
4. Describe the strategy you used to find the functions in Activities 1 and 2.
x 1 2 3 4 5
y 5 6 7 8 9
x 1 2 3 4 5
y 28 40 52 64 76
4
2
x
4
2
x
x y
6.3
Practice
For use after Lesson 6.3Use the graph or the table to write a linear function that relates y to x.
1. 2.
3. 4.
5. The table shows the distance traveled y (in miles) after x hours.
a. Write a linear function that relates y to x.
b. Graph the linear function.
c. What is the distance traveled after three hours?
x 0 1 2 3
y 5 7 9 11
x –2 0 2 4
y –1 –2 –3 –4
x 0 2 4 6
6.4
Comparing Linear and Nonlinear Functions
For use with Activity 6.4Essential Question
How can you recognize when a pattern in real life is linear or nonlinear?Work with a partner. Complete each table for the sequence of similar rectangles. Graph the data in each table. Decide whether each pattern is linear or nonlinear.
a. Perimeters of similar rectangles b. Areas of similar rectangles 1 ACTIVITY: Finding Patterns for Similar Figures
x 1 2 3 4 5
P
x 1 2 3 4 5
A
x
2x
x P
20
10
0 40
30
4
2 3 6 8 9 1
0 5 7 x
A
20
10
0 40
30
4
2 3 6 8 9 1
6.4 Comparing Linear and Nonlinear Functions(continued)
Work with a partner. Each table shows the height h (in feet) of a falling
object at t seconds.
• Graph the data in each table.
• Decide whether each graph is linear or nonlinear.
• Compare the two falling objects. Which one has an increasing
speed?
a. Falling parachute jumper b. Falling bowling ball
2 ACTIVITY: Comparing Linear and Nonlinear Functions
t 0 1 2 3 4
h 300 285 270 255 240
t 0 1 2 3 4
h 300 284 236 156 44
t h
120
60
0 240
180
4
2 3 6 8 9
1
0 5 7
Time (seconds)
Height (feet)
Parachute Jumper Bowling Ball
t h
120
60
0 240
180
4
2 3 6 8 9
1
0 5 7
Time (seconds)
6.4 Comparing Linear and Nonlinear Functions(continued)
What Is Your Answer?
6.4
Practice
For use after Lesson 6.4Graph the data in the table. Decide whether the graph is linear or
nonlinear.
1. 2.
Does the graph represent a linear or nonlinear function? Explain.
3. 4.
5. The table shows the area of a square with side length x inches. Does the table represent a linear or nonlinear function? Explain.
x –2 0 2 4
y 4 0 4 16
x –1 0 1 2
y –1 1 3 5
x y O x y O x y 3 4 2 1 −3 −4 −2 4 3 2 O −2 −3
−4 x
y 3 4 2 1 −3 −4 −2 4 3 2 1 O −2 −3 −4
Side Length, x 1 2 3 4
6.5
Analyzing and Sketching Graphs
For use with Activity 6.5Essential Question
How can you use a graph to represent relationships between quantities without using numbers?Work with a partner. Use the graph shown.
a. How is this graph different from the other graphs you have studied?
b. Write a short paragraph that describes how the water level changes over time.
c. What situation can this graph represent?
Work with a partner. You are riding your bike. Match each situation with the appropriate graph. Explain your reasoning.
A. B.
1 ACTIVITY: Interpreting a Graph
2 ACTIVITY: Matching Situations to Graphs
Time
W
ater lev
el
Time
S
peed Speed
6.5 Analyzing and Sketching Graphs (continued)
C. D.
a. You gradually increase your speed, then ride at a constant speed along a bike path. You then slow down until you reach your friend’s house.
b. You gradually increase your speed, then go down a hill. You then quickly come to a stop at an intersection.
c. You gradually increase your speed, then stop at a convenience store for a couple of minutes. You then continue to ride, gradually increasing your speed.
d. You ride at a constant speed, then go up a hill. Once on top of the hill, you gradually increase your speed.
Work with a partner. The graphs represent the heights of a rocket and a weather balloon after they are launched.
a. How are the graphs similar? How are they different? Explain.
b. Compare the steepness of each graph.
c. Which graph do you think represents the height of the rocket? Explain.
3 ACTIVITY: Comparing Graphs
S
peed
Time Time
S
peed
Time Graph A
H
eight abo
v
e
gr
ound
Graph B
v
e
gr
6.5 Analyzing and Sketching Graphs (continued)
Work with a partner. The graphs represent the speeds of two cars. One car is approaching a stop sign. The other car is approaching a yield sign.
a. How are the graphs similar? How are they different? Explain.
b. Compare the steepness of each graph.
c. Which graph do you think represents the car approaching a stop sign? Explain.
What Is Your Answer?
5. IN YOUR OWN WORDS How can you use a graph to represent relationships between quantities without using numbers?
6. Describe a possible situation represented by the graph shown.
7. Sketch a graph similar to the graphs in Activities 1 and 2. Exchange graphs with a classmate and describe a possible situation represented by the graph. Discuss the results.
4 ACTIVITY: Comparing Graphs
Time Graph A
S
peed
Time Graph B
S
peed
Time
H
eight abo
v
e
gr
6.5
Practice
For use after Lesson 6.5Describe the relationship between the two quantities.
1. 2.
Sketch a graph that represents the situation.
3. You are texting a friend at a constant rate. You send the message then wait for a response. Once you receive a response, you begin texting a reply at a constant rate.
4. You cut your fingernails, let the nails grow back, and then cut them again.
Months Sales
Dollars
Time Bicycle
S