756
Copyright © 2011-15. Vandana Publications. All Rights Reserved.
Volume-5, Issue-3, June-2015
International Journal of Engineering and Management Research
Page Number: 756-763
Accident Analysis and Prediction of Model on National Highways
Rashni Malik1, S.S. Kajal2 1
Post Graduate Student, Civil Engineering Department, Institute of Technology and Science, Bhiwani, Haryana, INDIA 2
Head of Department, Civil Engineering Department, Institute of Technology and Science, Bhiwani, Haryana, INDIA
ABSTRACT
India is a developing country and safety of road is still in a premature stage. Accident severity is increasing randomly day by day due to increasing in number of vehicle. Accident leads to disablement, death, damage to health and property, social suffering and general degradation of environment. The road accident situation in India is alarming. Records show that there is one death at every 2.75 minutes because of road accidents. The high accident rate is largely attributed to the inadequacy of the highways and other main roads to meet the traffic demands, road user behavior, vehicle defects, poor road geometrics and visibility. Road accidents inflict heavy economic loss to the country. Road Safety is necessary to reduce accident involving both human and vehicles there by making the road more safe and user friendly to traffic.
NH-10 is one of the major connectivity from Delhi to fazilka which caters to the need of transportation of light goods to heavy goods and passengers. Study area was undertaken on road NH-10 from Hansi to Army cant with stretch Km 146/0 toKm158/0 in Haryana state. The study stretch is a major connectivity to no of heavy industries like , Jindal steel, Ravindra pipes , HP cotton textile, DPS school, Vidya Devi Jindal public school, kv and army school and many more small scale industries . The no of accidents is rising up every year due to increase in number of vehicles. The location in a roadway where the traffic accident often occurs is called a black spot. The accident data is analyzed using accident frequency and severity index method. The safety deficiencies were detected to minimize accidents and save the road users. The deficiencies along with the measures for further improvement have been presented in this paper.
Keywords--- Road Accidents, Vehicle, Environment
I.
INTRODUCTION
Road safety is one of the most important problems in our society. Every year 1.2 million of people are killed and between 20 and 50 million people are injured in road accidents. Road crashes take away the right to life of 3,000 people every day. This is a global humanitarian disaster, and it is man-made. (Global Road Safety Partnership Annual Report 2011)
If current trends continue road traffic accidents are predicted to be third leading contributor to the global burden of Disease and injury by 2020(Torregrosa et al.,2012) India had earned the dubious distinction of having more number of fatalities due to road accidents in the world. Road safety is emerging as a major social concern around the world especially in India (Shivkumar and Krishnaraj,2012).
Road accidents are a human tragedy, which involve high human suffering. They impose a huge socio-economic cost in terms of untimely deaths, injuries and loss of potential income. The ramifications of road accidents can be colossal and its negative impact is felt not only on individuals, their health and welfare, but also on the economy. Consequently, road safety has become an issue of national concern. Road Safety is a multi-sectoral and multi-dimensional issue. It incorporates the development and management of road infrastructure, provision of safer vehicles, legislation and law enforcement, mobility planning, provision of health and hospital services, child safety, urban land use planning etc. In other words, its ambit spans engineering aspects of both, roads and vehicles on one hand and the provision of health and hospital services for trauma cases in post-crash scenario. Road accident in India is shown in figure. Source: Road statistics of India (2011).
757
Copyright © 2011-15. Vandana Publications. All Rights Reserved.
• Road accidents in India (2005-2014)Number of Road Accidents and Number of Persons Involved: 2005 to 2014
Year No of Accidents Number of Persons Accident Severity
Total Fatal Killed Injured
2005 4,39,255 83,491 94,968 465,481 21.6
2006 4,60,920 93,917 105,749 496,481 22.9 2007 4,79,216 1,01,161 114,444 513,340 23.9 2008 4,84,704 1,06,591 119,860 523,193 24.7 2009 4,86,384 1,10,993 125,660 515,458 25.8 2010 4,99,628 1,19,558 134,513 527,512 26.9 2011 4,97,686 1,21,618 1,42,485 5,11,394 28.6 2012 4,86,395 1,10,993 125,468 520,456 25.8 2013 4,99,925 1,17,449 139,360 525,495 27.9 2014 4,97,379 1,27,548 1,45,209 5,10,376 29.6
Causes of accidents and their contribution are as follows by statistics of Road accidents in India (2014) Drivers fault- 73.5%
Defects in road condition- 1.0% Defects in motor vehicle- 1.3% Fault of bicyclist- 1.5% Fault of pedestrian- 2.4% Weather condition- 1% All other causes- 15.2%
Road safety in India is the poorest in the world. According to MORTH 2014 India has the highest no of accidents in the world. Awareness among road users and safe design of road components is necessary to reduce accident involving both human and vehicles
II.
ROAD SAFETY & VARIOUS
CAUSES OF ACCIDENT
Road traffic safety refers to methods and measures for reducing the risk of a person using the road network being killed or seriously injured. The users of a road include pedestrians, cyclists, motorists, their passengers, and passengers of on-road public transport, mainly buses and trams. Best practice road safety strategies focus upon the prevention of serious injury and death crashes in spite of human fallibility. Safe road design is now about providing a road environment which ensures vehicle speeds will be within the human tolerances for serious injury and death wherever conflict points exist.
The various causes of accidents may be due to three factors shown in fig .
i) Driver (ii)Vehicle (iii) Environment
The details of these factors are shown in below.
Various Factors Related to Accident Driver-Related
Alcohol and drugs Sickness Unsafe speed Cell Phone Use Drowsing or Fatigue Distraction
Fatigue Improper Passing or Turning Disregard traffic controls Non Use of Restraint
Vehicle-Related
Over Loading Steering defect Brake defect Tire failure
Light defect Improper wheel alignment Environmental- Related
Road side hazard Vision obstruction
Ruts Improper traffic control
Debris or Garbage on the road Road Side Hazard smoke or fog Fixed Objects
Glare Water ponding
758
Copyright © 2011-15. Vandana Publications. All Rights Reserved.
III.TYPES OF ACCIDENT,
POSITION OF VEHICLES AND
CONSEQUENCES
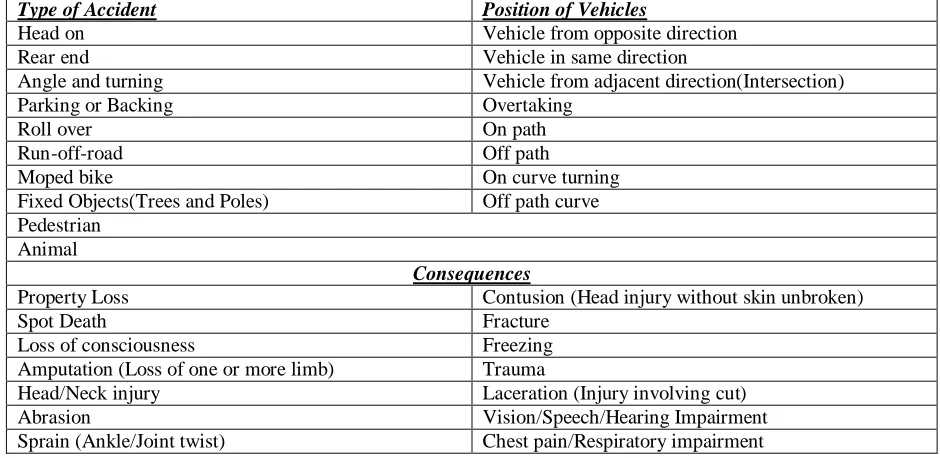
Accident imposes both tangible and intangible cost. The details are shown in Table 1and Fig.2
Table 1Types of Accident,Position of Vehicles and Consequences
Type of Accident Position of Vehicles
Head on Vehicle from opposite direction
Rear end Vehicle in same direction
Angle and turning Vehicle from adjacent direction(Intersection)
Parking or Backing Overtaking
Roll over On path
Run-off-road Off path
Moped bike On curve turning
Fixed Objects(Trees and Poles) Off path curve Pedestrian
Animal
Consequences
Property Loss Contusion (Head injury without skin unbroken)
Spot Death Fracture
Loss of consciousness Freezing Amputation (Loss of one or more limb) Trauma
Head/Neck injury Laceration (Injury involving cut)
Abrasion Vision/Speech/Hearing Impairment
Sprain (Ankle/Joint twist) Chest pain/Respiratory impairment
Accident Theory
Collision may be two types (i) Collinear Impact (ii) Angular collision
Further collision is divided into two types (i) Rear end collision
(ii)Head on collision
Two theory – (i) Poisson Impact theory (ii)Energy theory
Poisson impact theory-It is based on compression and restitution
Suppose two vehicles travelling at initial speed v1 and v2 collide and obtain a uniform speed say u at compression. After compression is over the final speed is u1 and u2 Then according to newton’s law
Reaction force –F = m1dv1/dt and action force F = m2dv2/dt
m1(u-v1) = - pc m2(u-v2) = pc
Where pc= is compression impulse and TC is compression time
Velocity after collision u = (m1v1+ m2v2)/(m1+m2) Compression impulse pc= {(m1m2) /(m1+m2)}*(v1-v2)
In the restitution phase the elastic part of internal energy is released
m1(u1-u) = - pr m2(u2
Restitution impulse e = (u
-u) = pr
where p r = is restitution impulse
τ r = Restitution time
According to poisson hypothesis restitution impulse is proportional to compression impulse
2-u1)/(v1-v2 P = Pc+Pr
)
Total impulse p = (1+e)*((m1m2)/(m1+m2)) Δv
Post impact velocity u1 = u – e (m2/(m1+m2)) Δv = v1 – (1+e)m2/(m1+m2) Δv
u2 = u+e(m1/(m1+m2)) Δv = v2 + (1+e)m1/(m1+m2) Δv where Δv = v1-v2
v1 and v2 are calculated from u1 and u2 Energy theory
Principle of conservation of energy w(v12-v22)/2 g =wfs
f= coefficient of friction s= skid resistance
m1, v1 are mass & velocity of first vehicle colliding with another vehicle of mass & velocity m2, v2 respectively. m1v1= m2v
IV.
NEED AND OBJECTIVES OF
STUDY
2
759
Copyright © 2011-15. Vandana Publications. All Rights Reserved.
accidents in the country increased at a CAGR of 2.1 percent. Similarly, the number of road accident fatalities and the number of persons injured in road accidents in the country between 2001 and 2011 increased by 5.8 per cent and 2.4 per cent, respectively.
Very little work has been done in India to analyze accidents on two-lane roads.
The major objectives of the present work are listed below (i)To study the annual, monthly, daily and hourly variation in accident rate on selected
Stretch of urban two-lane road.
(ii)To study the effect of traffic volume, density and capacity on accident rate on urban
Two-lane road.
(iii) To study the maintenance of road surface and shoulder on rate of accidents.
V.
REVIEW OF LITERATURE
Many factors may exhibit a measurable influence on driving behavior and traffic safety on two-lane highways (Bhuyan, 2003). These include, but are not limited to,
(i)Human factors such as improper judgment of road ahead and traffic, driving under the influence of alcohol or drugs, driver education and experience, young driver, age and sex.
(ii)Traffic factors like speed, volume, density, capacity, traffic mix and variation.
(iii)Vehicle deficiencies, such as defective brake, headlight, tyres, steering and vehicle condition .
(iv) Road condition like slippery or skidding road surface, ravels, pot hole, ruts etc.
(v)Road design such as inadequate sight distances, shoulder width, no of lanes ,improper curve design, improper lighting and traffic control devices.
(vi) Weather condition like fog, heavy rainfall, dust, snow etc.
(vii)Other causes such as enforcement, incorrect sign and signals, service station, badly located advertisement, stray animals etc. 14
VI.
DATA COLLECTION
The only information available for accident studies is the FIR (First Information Report) lodged in the police stations. The data from these records of last ten years (2005-2014) were extracted from the FIR record filed under IPCno.129/377/418/342(A).Vehicles those involved in accidents and reported in the F.I.R. The categories of vehicles include tempo, auto, mini-truck, minibus, Tata indica,Tata-407,trecker,motor cycle, tanker, tailor(articulated vehicle),truck and bus.
Road selected for study
Two-lane roads from Hansi to Army cant on NH-10 was chosen
For this study. Hansi to army cant , Km146/ 0-Km158/0 The following roads were selected for data collection study.
(i)Hansi to army cantt , Km,146/ 0-Km158/0 (ii)Hansi to dps school, Km,146/0-Km 149/0 (iii)dps to mayard Km ,149/0-Km152/0 (iv)mayad to army cant, Km 152/0-Km 158/0 Data collected from Police Records
With the prior permission of the concerned S.P, the accident data were collected on two-lane highways from three police stations as shown in Table 3.1.
Police stations and road sections covered
Police Station Road section covered under the police station Sadder police station Hansi Km 146/0-Km149/0
City police station Km 149/0-Km152/0 Police chowki in cantt Km 152/0-Km 158/0
The police stations have their own FIR records of several years. The data from these records of last ten years were extracted from the FIRs filled under IPC
NO.256/437/368/404 (A).A sample copy of the proforma is shown in the given below.
Proforma for accident data from FIR records. Date/Day/Time Location of
Accident
Details of Accident Vehicle(s) Involved Possible Reasons
Accident details during 2005-2014 on this road section are shown in below. Accident data were collected year wise from each police station records then sorted out
760
Copyright © 2011-15. Vandana Publications. All Rights Reserved.
Details of accidentsYear Fatal Major injury Minor injury
2005 20 32 39
2006 21 34 40
2007 18 41 84
2008 4 24 61
2009 13 32 81
2010 18 34 84
2011 11 30 58
2012 12 34 56
2013 14 43 58
2014 15 45 65
Total 146 349 626
Data collected from P.W.D Records P.W.D (Public Works Department) records are the main
source of details of road. The proforma used to record these details is shown in Table 3.5
Proforma for details of road section Width of
Carriage way in Mt
7 7
Width of Formation in Mt
12 12
Width of Land in Mt
45 45
In addition to the above, traffic volume data were also obtained from PWD records. These are shown in below figure.
Traffic volume data
YEAR ADT AV PCU PER DAY PCU/HR
2005 14533 24656.11 1027.338075
2006 12584 21501.46 895.8942667
2007 12679 21655.23 902.301225
2008 10484 18102.4 754.2667667
2009 12700 21689.22 903.7175
VII.
ANALYSIS OF DATA AND
DISCUSSION
Accident Rate and Frequency Accident Rate = M/L
Where M = Total no of Accidents of a stretch L = Length of Road
Accident Rate
Name of location Length No of accidents in a year
Sum of 10 year Accident rate
Hansi to dps(I) 4km 228 45.6
dps to mayad (II) 4km 208 41.6
mayad to VDJS (III) 4km 26 5.2 vdjs to army
cantt(IV)
761
Copyright © 2011-15. Vandana Publications. All Rights Reserved.
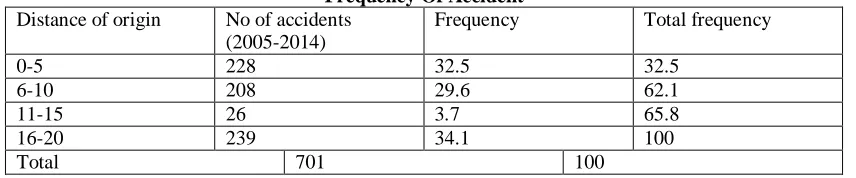
Frequency Of AccidentDistance of origin No of accidents (2005-2014)
Frequency Total frequency
0-5 228 32.5 32.5
6-10 208 29.6 62.1
11-15 26 3.7 65.8
16-20 239 34.1 100
Total 701 100
Annual Variation in Accidents
the annual variation in accidents of total stretches during year 2005-2014.It is observed that percentage accidents are increasing relatively in most of the year. In the year 2007 accident rate was high and low in the year 2005.It may be due to increase in no of vehicles, bad traffic environment, and increase in population.
Monthly Variation in Accidents
the monthly variation in accidents.peak accident occurs in summer season i.e in the month of march,april and may.This is due to distraction related to environment.Problem in these months are glare,fatigue, inconvienient heat.
Hourly Variation in Accidents
hourly variation in accidents. One can observe more accidents occurs in between 8PM to 9PM.In this hour line truck(Truck Series) start their long journey.Most of the driver do not use speedometer as they drive by approximation.Speed crosses limiting speed as a result accident occur.Also they drink and drive in the evening hour.In the late night they use marijjuana as a result reaction time increases and loss of contro occurs.Some drivers make the vehicle over load.In india loadcapacity is 10 ton or 16.2 ton for goods carriage but they carry more than that results uncontrol and leads to accidents.
Vehicles Involved in Fatalities
Vehicle users related to fatalities during 2002-2011 are shown in pie chart in percent. The results indicate that 59 percent of fatalities are due to truck drivers followed by 26 percent by unknown driver,7 percent by motor cycles,5 percent by car and jeep,3percent by bus .They consume alcohol and drugs in long driving. As a result reaction time increases and loss of control occurs during speed driving leads to fatalities.
Accidents Related to Traffic Volume
In order to find the relationship between accident rate and traffic volume, accident rate was presented in two forms. In one case it is the number of accident that occurred in a road section per kilometer per year and presented as accident per km-year. And in other case, it was the number of accidents that occur in a road section per million vehicles (MV) taken in terms of passenger car unit(PCU) per Kilometer(K) per year(Y),represented as Accident per MVKY.
The rate of accidents in terms of accidents per km-year .The curve indicate that accident rate per Km-year increases with AADT
Trend of Accidents, Injuries and Fatalities during 2005-2014
The yearly trend of accident per million vehicle-kilometer-years (MVKY) on the road . it is found that accident rate per MVKY increases in each subsequent Year. The increasing trend in accident rate may be due to increase in population due to town growth, industry growth, poor maintenance of shoulder, electric poles on the road, transformer station on the shoulder, old girth trees on the shoulder, sight distance obstruction due to trees, unsignalized intersection, on street parking of vehicles and lack of general awareness of road safety among road users.
The yearly trend of injuries is injuries per MVKY is increased in subsequent years as accident rate is increasing.
Traffic and Road side feature Data
The Traffic data were collected from different stretches. Volume, density, speed were calculated from these data which is shown in below
Table 4.3Traffic and Roadside features data of four stretches(2013) Stretch
No
ADT Qmax (pcu/s)
Access Road
Trees on Shoulder
Poles Curves Shoulder condition
Lighting condition
1 73600 0.82 35 23 53 6 Good Good 2 35160 0.74 21 25 21 5 Average Average
3 42160 0.74 6 0 0 3 Poor Poor
762
Copyright © 2011-15. Vandana Publications. All Rights Reserved.
Surface PropertySkid Number SN = √v2
/2gl x 100 Where
SN=Skid Number
v =Velocity of the Vehicle g = acceleration due to gravity
l = skid length
The value of skid number for different stretches were calculated by using a Tata Indica V2 car with kerb weight 1050 kg with Two Person are shown in Table 4.4 .Normally for a Asphaltic surface skid no varies between 70 to 100. From the below observation it is found that surface friction lies in normal limit.
Skid Number values of four stretches STRETCH SKID
LENGTH(mt)
SPEED KMPH BRAKING SKID NO
1 8 40 N 77
2 11 50 N 87
3 13 60 N 106
4 12 50 N 80
Average Surface Texture values of Road Surface Average Surface Texture Depth
Average surface depth was determined by modified sand patch method (Pestle method).Sand passing through 300 micron and retaining on 150 micron was collected as sample.50 ml (85gm) sample was spread
evenly on road surface such that it will fill the depression completely in the shape of a circle. The dia of circle was measured.
Average Surface Texture Depth = 35416.66/0.783xd2
Sample Vol(ml) Dia(cm) Avg Depth(mm) Remark
1 50 32.5 0.43 Normal
2 50 30 0.5 Normal
3 50 30 0.5 Normal
4 50 30 0.5 Normal
5 50 38.5 0.3 Sllipery Surface
VIII.
CONCLUSIONS
(1)The available literatures on accident analysis indicate that 77.5 percent of road accidents inIndia are caused due to driver’s error.
(2)Heavy vehicles like truck are involved in maximum no of accident on two-lane roads. It is estimated that fatalities caused by truck is 59 % followed by other (26%) and bike (7%) and jeep (5%) and bus (3%).Road safety awareness should be raised among road user.
(3) the highest no of accidents which accounts for 34.1% of total accidents .The accident rate can be decreased by road side clearance, proper maintenance of shoulders, lighting, and junction improvement. Speed limit should be brought down by providing humps near accident spots. Sight distance near curves should be obstruction free.
(4) the second highest no of accidents accounts for 32.5% of total accident. The Accident rate can be reduced by providing signalized junction, junction improvement, and shoulder Clearance, installation of humps, shifting of poles, removal of trees near the edge of pavement etc.
(5)accounts for 29.6% of total accidents. The accident rate can be Minimized by clearing-off shoulders, reducing speed limit, junction improvement, providing Signals on the median, shifting structures on the shoulder.
(6)the minimum no of accidents accounts for 3.7% of total accidents. Speed limit reduction near junction should be reduced to prevent accidents.
REFERENCES
[1] Global Road Safety Partnership Annual Report (2011) [2] Torregrosa et al.,(2012) New geometric design consistency model based on operating speed Profiles for road safety evaluation, Accident Analysis and Prevention Article in press AAP-2915 pp.1-10
[3] Sivakumar, Krishnaraj(2012),Road Traffic Accidents (RTAs) Due To Drunken Driving In India, Challenges In Prevention international journal of research in management and Technology,ISSN:2249 9563 VOL. 2, pp.401-406
[4] Accidental deaths in india(2011), National Crime Records Bureau, Ministry of Home Affairs, Government of India,New Delhi
763
Copyright © 2011-15. Vandana Publications. All Rights Reserved.
[6] Bhuyan(2003) Accident Analysis on Two-Lane Road,M-Tech Thesis Indian Institute of Technology Roorkee. [7] Hassan and Aty(2012) Exploring the safety implications of young drivers attitudes and perceptions,Accident Analysis and Prevention Vol.43 pp.45-65
[8] Constantinou et al(2011) Risky and aggressive driving in young adults: Personality Matters,Accident Analysis and Prevention Vol.43 pp.1323-1331 64
[9] Chandraratna et al(2006) Crash involvement of drivers with multiple crashes, Accident Analysis and Prevention vol. 38 pp.532–541
[10] Sagberg and Bjørnskau(2006) Hazard perception and driving experience among novice
drivers, Accident Analysis and Prevention vol.38 pp. 407– 414
[11] Derry(2011) The Role of Driving Experience in Hazard and Categorization, Accident Analysis And Prevention Vol.43 pp.1730-1737
[12] Sivakumar, .Krishnaraj(2012),Road Traffic Accidents (RTAs) Due To Drunken Driving In India, Challenges In Prevention international journal of research in management and Technology, ISSN:2249-9563 Vol. 2, pp.401-406
[13] Vaez,Lafllame(2005).,Impaired driving and motor vehicle crashes among Swedish youth: An investigation into drivers’ sociodemographic characteristics Accident Analysis and Prevention Vol.37, pp.605–611
[14] Anne et al.,(2010), The effects of minimum legal drinking age 21 laws on alcohol-relate driving in the United States Journal of Safety Research Vol.41,pp.173– 181
[15] Peter andRobert (2009)Alcohol consumption measured at road side survey and variation in traffic injury crashes, Accident Analysis and Prevention Vol. 30,No. 4, pp. 409–416.
[16] Campus et al.,(2011) The effect of the new traffic law on drinking and driving in Sao Paulo,Brazil Accident Analysis and Prevention Vol.50 pp.622-627 65
[17] Longo et al(1999)The prevalence of alcohol, cannabinoids, benzodiazepines and stimulants amongst injured drivers and their role in driver culpability, Accident Analysis and Prevention Vol.32 pp.623 – 632
[18] Boni et al(2010), factors associated with alcohol and drug use among traffic crash victims in southern Brazil Accident Analysis and Prevention Vol.43 pp.1408-1413 [19] Holmgren et al.,(2003) Alcohol and drugs in drivers fatally injured in traffic accidents in Sweden during the years 2000-2002 Forensic Science International Vol.151 pp.11-17