Mathematical Modelling of Projection for
Population in Kayah State
HtayHtay Mar#1, San San Maw*2, Lin Lin Naing**3 #
Department of Engineering Mathematics, Technological University (Loikaw). Kayah State, Myanmar. *
Department of Engineering Mathematics, Mandalay Technological University, Mandalay, Myanmar. **
Faculty of Computing, University of Computer Studies, Hinthada, Ayeyarwady Region, Myanmar.
Abstract — Censuses and projections for population are the most important activities for a country to provide
current and future population sizes needed by government, policy makers and planners of a country. Population censuses were taken at least every 10 years period and based on the data and information; population projection has been done yearly to perform the development of the country in various sectors. Kayah State is Myanmar's smallest state by both geographical area and population. In this paper, the population of Kayah State is projected for the first half of 21st century using two mathematical models. The exponential growth model and logistic growth model are used to forecast the population from 2020 to 2050 based on the data and information of the 2014 Myanmar Population and Housing Census and CEIC (Census and Economic Information Center) data. The accuracies of the projected results of two models are compared using results from CEIC data by Mean Absolute Percentage Error (MAPE). The objective of this paper is to project the population of Kayah State using two mathematical models to the end of the first half of 21st century to support the development of State.
Keywords - Exponential growth model, Logistic growth model, Growth rate, Population projection, Carrying capacity, MAPE.
I.INTRODUCTION
KayahState is located in the eastern part of Myanmar. It is bounded on the north by Shan State, on the east by Thailand's Mae Hong Son Province, and on the south and west by Kayin State. It is Myanmar‟s smallest state with the area 11,670 km2 (0.17% of country‟s area) and only 0.6% of Myanmar‟s population live in Kayah State [1]. As population history, there were only three censuses (1973, 1983, and 2014) carried out in Myanmar. According to the censuses data, the total populations of Kayah State were 126574 in 1973, 168429 in 1983, and 286627 in 2014 (April). The total number of Kayah State population increased 33.1% in 1983 and 70.1% in 2014 [2]. In this situation, statistical analysis and projection for state‟s population is very important. According to the CEICestimation, Kayah State population will reach 330356 at the end of 2020. The population size and growth rate in a state directly influence the situation of economy, policy, culture, education, environment of state and determine the cost of natural resources [3]. Projection of any country‟s population plays a vital role in the planning as well as in the decision making for socioeconomic and demographic development. Every government always requires accurate idea about the future size of population, resources, demands and consumption for their planning activities. To obtain this information, the behavior of the related parameters is analyzed based on the previous data and using the conclusions drawn from the analysis, they make future projection of the targeted data. In this paper, projections of population for Kayah State are done by determining growth rate, vital coefficients, and the maximum size of population known as carrying capacity etc.
II.MATERIALSANDMETHODS
TABLEI
KAYAHSTATEPOPULATIONHISTORY(FROMCEICDATA)
Year Actual Population
Annual Growth Rate
Population Density (P/km2)
2008 251417 2.57 22
2009 257973 2.51 22
2010 264530 2.45 23
2011 271088 2.39 23
2012 277647 2.34 24
2013 284207 2.28 24
2014 290768 2.18 25
2015 297162 2.16 25
2016 303646 2.14 26
2017 310214 2.12 27
2018 316858 2.10 27
2019 323573 2.07 28
Fig.1 Graph of actual population from CEIC data 2008 to 2019
A. Problem Definition
At the end of 20th century, Kayah State population is round about 0.18 million and according to the Myanmar census 2014 which is the country‟s first national census after three decades [2], population is nearly 0.3 million. A projection of population may be defined as forecast of a future population based on a study of past and present data. The results from population projections are able to be applied for planning of future social security and Medicare obligations, determining of future water demands, estimatingof the needs for new public schools, sites selection for fire stations and predicting the demand for housing [7].
B. Development of the Models
The most successful models for explaining the growth of population are exponential growth model and logistic growth model. Exponential growth model was initiated by Thomas Malthus and itdescribes unlimited reproduction and human population growthhas appeared to be exponential considering on infinite amounts of resources. Logistic growth model was the modification of Malthus model and introduced by Verhulst considering limitation of resources so that the population is always less than some number known as carrying capacity. To compare the accuracy of the projection results of these two models, we use Mean Absolute Percentage Error equation [8].
1) Exponential Growth Model:Englishman Thomas Malthus introduced this model in 1798. Suppose we know the population 𝑁0at some given time 𝑡 = 𝑡0and we are interested in projecting the population N at some
future time 𝑡 = 𝑡1. In other words, we want to find population function 𝑁 𝑡 for 𝑡0≤ 𝑡 ≤ 𝑡1 satisfying 𝑁 𝑡0 =
𝑁0. Then considering the initial value problem [6],
𝑑𝑁
= 𝑟𝑁 𝑡 , 𝑡 ≤ 𝑡 ≤ 𝑡 ; 𝑁 𝑡 = 𝑁 . (1)
0 0.05 0.1 0.15 0.2 0.25 0.3 0.35
To
ta
l
P
o
p
u
la
ti
o
n
(M
il
li
o
n
s)
𝑁 𝑡 = 𝑁0𝑒𝑟𝑡 (2)
where𝑟is a constant called growth rate.
𝑟 =1
𝑡ln
𝑁
𝑁0 (3)
𝑡 =1
𝑟ln
𝑁
𝑁0
the growth rate increases as the population increase.
2) Logistic Growth Model:Belgian Mathematician Verhulst proposed this model in the 1840s as model for world population growth. His model included the idea of carrying capacity and it was widely used in many fields of modelling and forecasting. Verhulst modified Malthus‟s exponential model to make a population size proportional to both the previous population and a new term([3],[6]).
𝑎 − 𝑏𝑁(𝑡) 𝑎
where𝑎and 𝑏 are called vital coefficients of the population that reflect how far the population is from its maximum limit. The modified exponential model using this new term is:
𝑑𝑁
𝑑𝑡 =
𝑎𝑁(𝑡)(𝑎 − 𝑏𝑁 𝑡 ) 𝑎
𝑑𝑁
𝑑𝑡 = 𝑎𝑁 − 𝑏𝑁2.
Integrating,
1
𝑁(𝑎 − 𝑏𝑁)𝑑𝑁 = 𝑑𝑡.
Dividing the integrand by partial fraction and using initial condition, 𝑡 = 0, 𝑁 = 𝑁0,
1 𝑎
1
𝑁+
𝑏
𝑎 − 𝑏𝑁 𝑑𝑁 = 𝑑𝑡
1
𝑎[ln 𝑁 − ln(𝑎 − 𝑏𝑁)] = 𝑡 + 𝑐.
Using initial condition, 𝑡 = 0, 𝑁 = 𝑁0,
𝑐 =1
𝑎 ln 𝑁0− ln(𝑎 − 𝑏𝑁0)
1
𝑎[ln 𝑁 − ln(𝑎 − 𝑏𝑁)] = 𝑡 +
1
𝑎 ln 𝑁0− ln(𝑎 − 𝑏𝑁0)
1
𝑎 ln
𝑁
𝑎 − 𝑏𝑁− ln
𝑁0
𝑎 − 𝑏𝑁0 = 𝑡.
Simplification yields,
𝑁 = 𝑎 𝑁0𝑒
𝑎𝑡
𝑎 + 𝑏𝑁0(𝑒𝑎𝑡 − 1).
Multiplying numerator and denominator by 𝑏𝑁1
0𝑒𝑎𝑡,
𝑁 = 𝑎 𝑎/𝑏
𝑏𝑁0𝑒𝑎𝑡+
1
𝑒𝑎𝑡(𝑒𝑎𝑡− 1)
𝑁(𝑡) = 𝑎/𝑏
1 + (𝑎/𝑏𝑁
0 − 1)𝑒
−𝑎𝑡 (4)
as𝑡 → ∞, (𝑎 > 0)
𝑁𝑚𝑎𝑥 = lim𝑡→∞𝑁(𝑡) =
𝑎
𝑏 . (5)
To find the value of 𝑎𝑏, suppose that the values of Nare 𝑁1and𝑁2at time 𝑡 = 1 and𝑡 = 2 respectively.
From equation (4) we obtain,
𝑁1=
𝑎/𝑏
1 + (𝑎/𝑏𝑁
0 − 1)𝑒
=𝑏 1−𝑒−𝑎1
𝑎 +
1 𝑁0𝑒
−𝑎
𝑏
𝑎 1 − 𝑒−𝑎 =
1
𝑁1−
𝑒−𝑎
𝑁0 . (6)
Similarly,
𝑁2=
𝑎/𝑏
1 + (𝑎/𝑏𝑁
0 − 1)𝑒
−2𝑎
=𝑏 1−𝑒−2𝑎 1
𝑎 +
1 𝑁0𝑒−2𝑎
𝑏
𝑎 1 − 𝑒−2𝑎 =
1
𝑁2−
𝑒−2𝑎
𝑁0 . (7)
Dividing equation (7) by equation (6),
𝑏
𝑎 1 − 𝑒
−2𝑎
𝑏
𝑎 1 − 𝑒−𝑎
=
1 𝑁2−
𝑒−2𝑎 𝑁0
1 𝑁1−
𝑒−𝑎
𝑁0 .
Simplification yields,
1 + 𝑒−𝑎 =
1 𝑁2−
𝑒−2𝑎 𝑁0 1 𝑁1−
𝑒−𝑎
𝑁0
𝑒−𝑎 =𝑁0(𝑁2− 𝑁1)
𝑁2(𝑁1− 𝑁0) . (8)
Equation (6) can also be written as
𝑏
𝑎 1 − 𝑒−𝑎 =
𝑁0− 𝑁1𝑒−𝑎
𝑁1𝑁0
𝑏
𝑎 =
𝑁0− 𝑁1𝑒−𝑎
𝑁1𝑁0 ×
1
1 − 𝑒−𝑎.
By substituting the value of 𝑒−𝑎 from equation (8), we get
𝑏
𝑎 =
𝑁0(𝑁12− 𝑁0𝑁2)
𝑁0𝑁1(𝑁1𝑁2− 2𝑁0𝑁2+ 𝑁0𝑁1)
= 𝑁12− 𝑁0𝑁2
𝑁1(𝑁1𝑁2− 2𝑁0𝑁2+ 𝑁0𝑁1).
Thus the limiting value in equation (5) becomes
𝑁𝑚𝑎𝑥 =
𝑁1(𝑁1𝑁2− 2𝑁0𝑁2+ 𝑁0𝑁1)
𝑁12− 𝑁0𝑁2 . (9)
3) Mean Absolute Percentage Error (MAPE): It is a measure of prediction accuracy as a percentage, and is defined by the formula:
𝑀𝐴𝑃𝐸 =1
𝑛
𝐴𝑡− 𝑃𝑡
𝐴𝑡 × 100
𝑛
𝑡=1
%
where𝐴𝑡 is the actual value and 𝑃𝑡 is the projected value. The absolute value is summed for every projected
point in time and divided by the number of fitted point n. Multiplying by 100% makes it a percentage error. It can only be used based on the actual population and predicted population, so it cannot be calculated without actual population in projection process. In this paper, MAPE is used to compare the accuracy of two or more projection models. A model with smaller MAPE gives better forecast results than other models [8].
III.RESULTSANDDISCUSSION
A. Growth Rate for Exponential Growth Model
In this paper, the growth rate for exponential model is determined using with t = 0 in year 2008 as 𝑁0 and the
current year 2019 as 𝑁 with t = 11 in equation (3). The respective population of these two years can be seen in Table I, i.e., 𝑁0= 251417and 𝑁 = 323573.
𝑟 =1
𝑡ln
𝑁
𝑁0
= 1
11ln
323573
251417 = 0.0229374 = 2.29%.
By substituting 𝑁0, 𝑟 in equation (2), exponential growth model for projected population is
𝑁 𝑡 = 𝑁0𝑒𝑟𝑡 = 251417 𝑒0.0229374 𝑡.
By substituting the value of t, the projected populations can be obtained for respective year with the same average growth rate r = 0.0229374 year by year until 2050 and respective projection of population values can be seen in Table II.
B. Carrying Capacity for Logistic Growth Model
The maximum number of individuals that can be supported sustainably by a given environment is known as its „carrying capacity‟.Carrying capacity for the human population of a state is the maximum numberof people who can live using the resources available from that state [9]. It is not a fixed number and it depends on available resources and per capita consumption [10]. If the number of people exceeds over carrying capacity, the population declines because its environment can no longer support the excess numbers [11]. Three consecutive populations are required to calculate the carrying capacity and in this work, we usedt = 0 in year 2008 as 𝑁0,t =
1 in year 2009 as 𝑁1, and t = 2 in year 2010as 𝑁2. The populations of these three years are 251417,257973, and
264530 respectively. The maximum number of population that people can live in Kayah State can be estimated based on above years using equation (9),
𝑁𝑚𝑎𝑥 =
𝑎
𝑏=
𝑁1(𝑁1𝑁2− 2𝑁0𝑁2+ 𝑁0𝑁1)
𝑁12− 𝑁0𝑁2
=2.211278 × 10¹³
42729719 = 517503 people.
From equation (8),
𝑒−𝑎 =𝑁0(𝑁2− 𝑁1)
𝑁2(𝑁1− 𝑁0)
=251417(264530 − 257973)
264530(257973 − 251417) = 0.950574.
The values of vital coefficients are
𝑎 = − ln 0.95 = 0.05129 = 5.12%
𝑏 = 𝑎
517503=
0.05129
517503 = 9.911689 × 10⁻⁸.
The value of 𝑎 denotes the difference between birth rate and death rate. The smaller value of coefficient
bimplies the higher value of carrying capacity. By substituting 𝑁0, 𝑒−𝑎and
𝑎
𝑏in equation (4), the logistic growth model for projected population is
𝑁 𝑡 = 517503
1 + 517503251417− 1 (0.95)𝑡.
TABLEII
KAYAHSTATEPOPULATION(HISTORICALANDPROJECTION)
Year
CEIC data Projected Population
Actual Projection Exponential growth Model
Logistic growth model
2008 251417 251417 251417
2009 257973 257250 258051
2010 264530 263219 264686
2011 271088 269326 271313
2012 277647 275575 277924
2013 284207 281969 284509
2014 290768 288512 291062
2015 297162 295206 297572
2016 303646 302055 304032
2017 310214 309064 310435
2018 316858 316235 316773
2019 323573 323572 323038
2020 330356 331080 329223
2021 337195 338762 335323
2022 344089 346622 341331
2023 351034 354665 347242
2024 358028 362894 353050
2025 365066 371314 358750
2026 372139 379929 364338
2027 379243 388744 369811
2028 386370 397764 375164
2029 393513 406993 380396
2030 400663 416437 385502
2031 407057 426099 390482
2032 413541 435986 395334
2033 420109 446102 400056
2034 426503 456452 404648
2035 432987 467043 409109
2036 439555 477880 413439
2037 445949 488968 417638
2038 452433 500313 421707
2039 459001 511922 425646
2040 465395 523799 429458
2041 471879 535953 433142
2042 478447 548388 436702
2043 484841 561112 440138
2044 491325 574131 443453
2045 497893 587453 446648
2046 504287 601083 449727
2047 510771 615030 452691
2048 517339 629300 455544
2049 523733 643901 458287
2050 530217 658841 460924
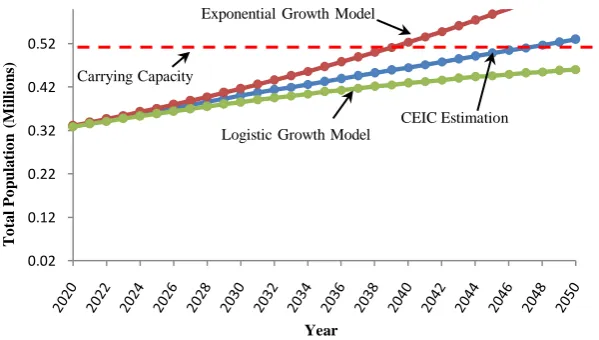
Fig. 2 Comparison of population projection values from exponential growth model, logistic growth model, and CEIC data.
C. Comparison and Recommendation
Two mathematical models have been applied to forecast the population of Kayah State from 2020 to 2050.
Census and Economic Information Center (CEIC)forecasts results are used for reference data. Mean Absolute Percentage Error (MAPE) equation has been used to compare the accuracy of growth models by using actual populations and predicted population values. Moreover, the projected populations from CEIC and two mathematical models have also been compared visually by using graph. According to the percentages of MAPE from the last row of table II, logistic growth model gives the more accurate projection results than exponential growth model. Based on the above comparison of results, we recommend that the logistic growth model has a good projection result as compared to the exponential growth model for some period of years. Kayah State is the smallest state in area and has the lowest population in Myanmar. Furthermore, Kayah State is one of the developing States and the State government should try to improve carrying capacity of population of the state. In this case, industrialization of the state is one of the best ways to increase carrying capacity. The more industrialized a country is the more living space and food it has, thus raising the carrying capacity.
IV.CONCLUSIONSANDFUTUREWORKS
Based on the actual populations from the 2014 Myanmar census, estimated populations from CEIC dataand forecasted populations from 2020 to 2050 by the two growth models have been projected and visualized by using XY scatter graphs. The exponential growth model forecasted a growth rate of approximately 2.29% and projected Kayah State‟s population to 658841 in the year 2050 with a MAPE 5.92% while logistic growth model projected the population of Kayah State to 460924 in the year 2050 with a MAPE 4.41% and carrying capacity 517503. Based on this model we also find out that the population of Kayah State is expected to reach its maximum limit (carrying capacity) in the year 2100. The predicted results of CEIC data estimated the Kayah State‟s population to 530217 in the year 2050. According to the MAPE precents, we can conclude that logistic growth model gives more accurate results than exponential growth model. The population density of Kayah State will be 40 people per squarekilometre in 2050. The applications of these models can also be extended to predict the growth rates of some population dynamics such as colonies of bacteria, animal populations, and other biological species with constrained or unconstrained resources. Decaying of radioactive substances and other monotonically decreasing processes can also be estimated by exponential decay model [12]. In economic sector, these models can also be applied to estimate the simple or compound interest of investments and other sectors with dynamic populations such as education, industrial, policy, culture, and environmental management and demographic development etc.
ACKNOWLEDGMENT
The author would like to acknowledge Dr. San San Maw, Professor, Department of Engineering Mathematics, Mandalay Technological University for her active encouragement, and perfect supervision throughout her research work.And Dr. Lin Lin Naing, Professor and Head, Faculty of Computing, University of Computer Studies, Hinthada, Ayeyarwady Region, Myanmar, for hisvaluable ideas, advices and comments. Her special thanks are due to U MyintZaw, Staff Officer, Regional Officeof Immigration and Population Department, Kayah State under the Ministry of Labour, Immigration and Population, Myanmar forhishelp to collect the required data and information to her research. Finally, the author‟s thanks are to her beloved parents, brothers and sister because her research cannot be done successfully unless they support it.
0.02 0.12 0.22 0.32 0.42 0.52
To
ta
l
P
o
p
u
la
ti
o
n
(M
il
li
o
n
s)
CEIC Estimation Exponential Growth Model
Logistic Growth Model Carrying Capacity
REFERENCES
[1] (2017) Kayah State website. [Online]. Available: https://en.wikipedia.org/wiki/Kayah_State.
[2] H.E Khin Yi, “The 2014 Myanmar Population and Housing Census Report Vol.3 B”, Kayah State, Department of Population, Ministry of Immigration and Population, May 2015.
[3] Augustus Wali, “Mathematical Modelling of Rwanda‟s Population Growth”.Applied Mathematical Sciences, vol. 5, 2011, no. 53, 2617 – 2628.
[4] Wu Haijian, Xing Xiao, “Gray Markov Using on Population Forecast”, International Journal of Mathematics Trends andTechnology (IJMTT) – Vol. 49 Number 5 September 2017.
[5] Myamar Population: Estimate: Kayah State, CEICdata.com@2017. Copyright All Right Reserved. [Online] Available: www.ceicdata.com/en/myanmar/population-estimation-2014-population-census-by-state/population-estimate-kayah-state/amp [6] Vikas Kumar, Shankar Lal, “Mathematical Modeling of India‟s Population Growth”, Aryabhatta Journal of Mathematics and
InformaticsVol.08 Issue-02, Dec 2016.
[7] Jacob Siegel and David Swanson, “Population Projections”, San Diego: Elsevier Academic Press, 2004
[8] Mean Absolute Percentage Error Website.[Online].Available: http://en.m.wikipedia.org/wiki/Mean_absolute_percentage_error. [9] Carrying Capacity website. [Online] Available: https:// populationmatters.org/wp-ontent/uploads/D20Carryingcapacity.pdf [10] Training Indicator for Carrying Capacity Website.
[Online].Available:http://www.sustainablemeasures.com/Training/Indicators/CarryCap.html
[11] World Bank‟s Population Projection for Myanmar, Worldometers Website. [Online].available: https://data.worldbank.org/country/ myanmar