A Case of Spatial Transformations in Complex Business Data Visualizations
Dr. John Tan Ph.D.
Assistant Professor
College of Business and Economics
VBT 454
California State University East Bay
25800 Carlos Bee Boulevard
Hayward, CA94542
United States of America
Abstract
Spatial Transformations are the mental operations that users perform on graphs and visualizations in an effort to extract information that is not explicit. Unfortunately, previous research in the area of Spatial Transformations employed a statistically insignificant number of subject participants (e.g. astronomers, physicists, meteorologists, or undergraduate students). Although graph comprehension theories suggest that a set of two-dimensional line graphs is a better representation for a task involving interpolation of values, the accuracy of the participants viewing a single three dimensional perspective display exceeded that of those participants who viewed a set of two-dimensional line graphs in their interpolation of new values of return on equity. A contributing factor to better accuracy is the mental operations in the form of Spatial Transformations. This study contributes to the existing literature by demonstrating that statistically significant sample size of forty-one undergraduate students, with particular domain knowledge of return on equity, performs Spatial Transformations to complete a task involving interpolation of values from a single three dimensional perspective display.
Keywords-
Spatial Transformations,Informationally Equivalent Representations, Three-Dimensional Perspective Display, Return on Equity1. Introduction
When a graph or visualization does not contain the exact information needed, viewers require the use some sort of mental operations in the form of Spatial Transformations to extract information that is not explicitly represented on a graph or visualization. An example of such Spatial Transformations is a weather forecaster may mentally image a front moving east over the next several days (Trafton et al., 2000). Trafton and Trickett (2001) defined Spatial Transformations as cognitive operations that a scientist does to a graph or display in order to solve a problem. Prior literature used a small number of scientists (astronomer, physicist) and meteorologists as participants in researches of Spatial Transformations (e.g. Trafton & Trickett, 2004; Trafton, Marshall, Mintz, & Trickett, 2002). Trafton and Trickett (2004) recruited only six undergraduate students to perform a task that did not require domain knowledge. I am motivated to develop the research question of this study: Can a large number of participants, with specific domain business knowledge, perform Spatial Transformations to complete a task involving interpolation of values from a three dimensional perspective display?
Graph comprehension theories (e.g. Jarvenpaa & Dickson, 1988; Pinker, 1990) suggest that a set of 2-D line graphs is a better representation for a task involving interpolation of values. This study has two hypotheses. Hypothesis H1 predicted that subjects using a set of 2-D displays will be the most effective (accuracy) in an accounting judgment involving estimation of values. Hypothesis H2 predicted that subjects using a set of 2-D displays will be the most efficient (less time) in an accounting judgment involving estimation of values.
Contrary to expectations, results suggest that participants viewing a single three-dimensional perspective representation were more accurate, than participants viewing a set of two-dimensional line graphs, in their estimation of new values of return on equity. Since Hypothesis H1was not supported, it is concluded that one of the contributing factors for the better performance (in terms of accuracy) of the participants viewing a single 3-D perspective display is Spatial Transformations. Further, hypothesis H2 was also not supported.
2. Background, Motivation and Research Question
“Current graph Comprehension theories do not have a great deal to say about what to do when a graph does not explicitly show the needed information for a variety of reasons. The main reason is probably that most graph comprehension studies have used fairly simple graphs for which no particular domain knowledge is required.” (Trafton & Trickett, 2001). Trafton and Trickett (2001) therefore developed a framework called Spatial Transformations to describe the mental operations that users perform on graphs and visualizations in order to extract information that is not explicit. Trafton and Trickett (2001) defined Spatial Transformations as cognitive operations that a scientist does to a graph or display in order to solve a problem. Examples of Spatial Transformation include mental rotation (Shepard & Metzler, 1971), creating a mental image and modifying that mental image by adding or deleting features to or from it (Hegarty, 1992), mentally moving an object, mentally comparing a current image to a previously created mental image (Kosslyn, Sukel, & Bly, 1999).
By tracking the eye movements of six meteorologists, Trafton, Marshall, Mintz, and Trickett (2002) found that meteorologists used spatial reasoning in the form of Spatial Transformations to construct and forecast meteorological information which was not explicitly found on the visualization. When meteorologists need to interpolate between two pressure lines, the meteorologists do not use a propositional representation, they use some spatial process to trace a line that allows them to extract the needed information. Trickett (2004) recruited six undergraduate students as participants for an experiment in graph comprehension. Participants were asked for the value of the y axis at a given point on the x axis (indicated by a red arrow in one of the three different positions) of a two dimensional unlabelled line graphs. Trafton and Trickett (2004) created three conditions for the participants to look for the value of the y axis at a given point on the x axis: read-off (arrow beneath line), near (arrow slightly beyond line), and far (far beyond end of line). As predicted, Trafton and Trickett (2004) found that participants were extending the line (a kind of Spatial Transformations) to estimate the value of y axis in the conditions of near and far. Whenever these six participants had to draw longer mental extensions to the line, their response times systematically increased and their accuracy decreased.
Even though Trafton and Trickett (2004) recruited undergraduate students instead of scientists for an experiment, the number of participants is only six in total. Further, the task of estimating the value of y axis at a given point on the x axis does not require specific domain knowledge. The graphical display used in Trafton and Trickett (2004) to test for Spatial Transformations is only a two dimensional line-graph. I am motivated to develop the research question of this study: Can a large number of participants, with specific domain business knowledge, perform Spatial Transformations to complete a task involving interpolation of values from a three dimensional perspective display?
3. Informationally Equivalent Representations
Research in computer science, human factors, and aviation engineering has moved beyond two-dimensional (2-D) analysis and found positive effects using three-dimensional (3-D) visualization of objects. Moriarity (1979) and Dull and Tegarden (1999) have also demonstrated the potential benefits of visual representation of multidimensional accounting information.
Kumar and Benbasat (2004) suggested that information with two ratio-interval (continuous) components and one nominal component can be represented as a single 2-D line graph because the third nominal component can be represented on a 2-D plane using an appropriate visual variable (size, value, texture, color orientation and shape). Further, Bertin (1981) suggested that in the case wherein all three components are interval or ratio (continuous) scale, the information can be represented by a pair of 2-D graphs. The information must be split between two 2-D graphs because the third continuous component cannot be represented on a 2-D plane using visual variables such as legends (Kumar & Benbasat, 2004).
Return on equity (ROE) and profitability can be plotted on a single line graph, as they can be scaled as percentages. Turnover and leverage can be plotted on another line graph, as they can be scaled as multiples. A single 3-D bubble plot, however, can represent turnover (X axis), profitability (Y axis), leverage (Z axis) and ROE (bubble) simultaneously. Representations are informationally equivalent if all of the information in one is also inferable from the other, and vice versa (Larkin & Simon, 1987; Simon, 1978). In this study information is presented equivalently through different display formats using a case of DuPont analysis (modified from White, Sondhi, & Fried, 1988) presented in a tabular display, a set of four 2-D line graphs and a 3-D perspective display, respectively. Table 1 shows the DuPont analysis of a company‟s ROE for a period of five years. Equivalent information can be presented in a set of four 2-D line graphs (Figure 1), and a 3-D perspective display (Figure 2).
Table 1: Tabular Display of a Company’s ROE for a Period of Five Years
Year Turnover Profitability Leverage ROE
1 1.10 5.77% 2.26 14.34%
2 1.04 3.63% 2.24 8.46%
3 1.01 -10.37% 2.63 -27.55%
4 0.98 1.49% 3.31 4.83%
5 1.06 4.93% 3.07 16.04%
Figure 1: 2-D Display of a Company’s ROE for a Period of Five Years
0 1 2 3 4 5 6
Year -30 -20 -10 0 10 20 -25 -15 -5 5 15 R et u rn O n E q u it y ( P er ce n ta g e) 14.34 8.46 -27.55 4.83 16.04 Case I
0 1 2 3 4 5 6
Year 0.96 1 1.04 1.08 1.12 0.98 1.02 1.06 1.1 T u rn o v er ( m u lt ip le ) Case I
0 1 2 3 4 5 6
Year -12 -8 -4 0 4 8 -10 -6 -2 2 6 P ro fi ta b il it y ( p er ce n ta g e) Case I
0 1 2 3 4 5 6
Figure 2: 3-D Perspective Display of a Company’s ROE for a Period of Five Years
Graphical software from the Golden Software, Inc. (www.goldensoftware.com) was used to draw figures 1 to 2. The three components of return on equity (ROE) will be in a 3-D perspective display with the X axis as turnover (a multiple measure), Y axis as profitability (a percentage measure) and Z axis as leverage (a multiple measure). In the 3-D perspective display ROE will be shown as a bubble of varying size that indicates the multiplicative function of turnover, profitability and leverage. The actual value of the ROE will be labeled, while actual values of each of the components of ROE can be read by following the drop lines from the bubbles linking to X, Y and Z axes, respectively.
3. Theoretical Framework and Hypotheses
Triffett and Trafton (2006) described a meteorologist spatially transforming the position of a low pressure system toward a certain direction (by hand gesture) even though actual movement of the low pressure system was not explicitly shown in a graph. Trafton and Trickett (2004) recruited six undergraduate students to infer the value of y axis at a given point on the x axis from a two-dimensional line graph. Trafton and Trickett (2004) found that participants were mentally extending the line to make inferences for the value of y axis in the conditions of near and far. Whenever participants in Trafton and Trickett (2004) had to draw longer mental extensions to the line, their response times systematically increased and their accuracy decreased.
Based on the findings of Trafton and Trickett (2004), it is assumed that viewers of the 2-D line graphs (Figure 1) will also be performing Spatial Transformations to complete a task involving interpolation of values. However, whether viewers of the 3-D perspective display (Figure 2) will be performing Spatial Transformations to complete a task involving interpolation of values is an empirical question to be tested. Further, current graph comprehension theories suggest that a set of 2-D line graphs is a better representation, than a single 3-D perspective display, for a task involving interpolation of values.
According to Jarvenpaa and Dickson (1988), viewers of line graphs can see trends and relationships at a glance, avoiding the steps of reading, comparing, and interpreting that are necessary to spot deviations using tabular data. Viewers of line graphs (Figure1) can discern the trend relationship simply by following the changes in the slope of the line. Viewers of the 3-D perspective display (Figure 2) must first identify the correct bubble that represents year 1 to year 5, and then use the drop lines from the bubbles to compare the differences between years for each variable of the ROE.
Pinker‟s (1990) Graph Difficulty Principle can help us to understand why a set of 2-D line graphs is a better representation for a task involving interpolation of values. Lohse (1991) suggested that only a small fraction of the information (about 3 chunks) decoded from a graph can be held in short-term memory at one time. Reorganization and reinterpretation of the information decoded from a graph is subject to capacity and duration limitations in short-term memory (Lohse, 1991). Pinker (1990) suggested that limits on short-term memory and on processing resources will make specific sorts of information easier or more difficult to extract. Viewers of line graphs can discern the trend relationship by following the changes in the slope to determine whether the data are linear (straight), not changing (flat), or increasing sharply (steep slope). The 3-D perspective display of the study cannot provide message flags (slope of the line) with similar richness about the nature of the data. By following the slope of the line, viewers of the 2-D line graphs can roughly estimate the new value to be larger or smaller than the existing values or perhaps that it remains the same. Thus, the 2-D line graph is a better representation for a task involving interpolation of values.
Therefore, it is hypothesized that:
H1: Subjects using a set of 2-D displays will be the most effective (accuracy) in an accounting judgment involving estimation of values when compared to subjects using a single 3-D perspective display or subjects using a table.
H2: Subjects using a set of 2-D displays will be the most efficient (less time) in an accounting judgment involving estimation of values when compared to subjects using a single 3-D perspective display or subjects using a table.
However, if those participants viewing a single 3-D perspective display are more accurate or more efficient than those participants viewing a set of 2-D line graphs, in an accounting judgment involving estimation of values, then it is logical to conclude that viewers of a single 3-D perspective display are also performing Spatial Transformations to estimate values.
4. Methodology
4.1 Research DesignHowever, participation of data will not affect the results of the two hypotheses of this study. Further, the mentioned above bigger experiment does not specifically address the research question of this study in relation to Spatial Transformations. To test for the two hypotheses of this study, two questions with definite quantitative answers are developed as tasks of the participants. The first task (question) to be performed (answered) by the participants is:-based on the ROE of year 5 (Bubble 5), what would be year 6 ROE if each of the variables of ROE in year 5 doubled? The second task (question) to be performed (answered) by the participants is:-estimate the average of turnover, leverage and profitability for the years 1, 2, 4 and 5, and use them to calculate a new ROE (Hint 1: you do not actually need to calculate the average, please consider the position of ROE as you attempt to answer. Hint 2: year 3 is not used). Each of the two questions has its own page screen with the randomly assigned display format, allowing for the time spent by each participant on each question to be recorded in seconds, thus allowing for measurement of efficiency.
In relation to the two hypotheses of this study, one hundred and twenty three undergraduate business students were randomly assigned to one of the three display formats to perform the task of interpolation of new values. The experiment was conducted in a computer laboratory over a period of two weeks. All participants used the same type of computer with a 16” screen to complete the experiment, and calculators or any external aids were not allowed to be used during the experiment. All participants first completed a training task, to familiarize them with their assigned display format and the concept of ROE, and then completed the experimental tasks. Following the experimental tasks, all participants completed a post-experiment questionnaire that included mental workload questions, survey questions, manipulation-check questions, demographic questions, and the Mental Rotations Tests. The 3-D perspective display of DuPont analysis is a newly created display format of financial ratios that has never been empirically tested. For this reason, this study adopted six survey questions from Fuller, Murthy and Schafer (2010) to elicit participants‟ opinions on the usefulness and ease of use of their randomly assigned display format.
4.2 Measures
Two performance constructs are of interest in this study, effectiveness and efficiency. In this study effectiveness is defined and measured as participants‟ accuracy in performing the tasks. Efficiency is measured as the response time in seconds spent by each participant on each of the two questions described in section 4.1. Accuracy is measured as the absolute difference between the correct answer (value) and participant‟s estimation of the value. The correct answer (value) for year 6 ROE is 128.34% if each of the variables of ROE in year 5 doubled. The correct answers to the average of turnover, leverage and profitability for the years 1, 2, 4 and 5, are 1.045, 3.955% and 2.72 respectively. While the correct answer to the new ROE based on the average of turnover, leverage and profitability for the years 1, 2, 4 and 5 is 11.241%.
Twenty-four possible predictors – the data on practice questions, demographic questions, mental workload, and the time spent in seconds by each participant when answering each practice question or the Mental Rotations Tests− were developed from a pilot study to test for significant correlations with the dependent variables (accuracy and efficiency). This study developed separate regression models for each of the dependent measures using twenty-four possible predictors in each regression model. Only those predictors that were significant at p-values < 0.05 in one or more of the regression were retained for testing of each hypothesis.
This study employs MANCOVA analysis to test hypotheses. By including all dependent variables in a single analysis, MANCOVA takes into account the relationships among dependent variables. If the MANCOVA model is significant, then univariate ANCOVA will be used to separately test each dependent variable of a hypothesis. Rather than just putting the theoretical or expected covariates into the MANCOVA analysis, a separate regression will be run for each dependent variable with all the theoretical covariates and demographic variables to test for significance of all possible covariates to be included in subsequent MANCOVA analyses. Insignificant covariates in MANCOVA or ANCOVA models are dropped from the final analysis.
4.3 Hypothesis Results
Results of Hypothesis H1
In constructing the models to test hypothesis H1, two covariates − highest level of education (HE), and time spent on the mental rotations test (TSMRT) − were included in the models along with the manipulated variable Treatment.
The first dependent variable used to test hypothesis H1was Q1, which asked the participants to estimate what the ROE would be in year 6 (Q1) if each of the variables comprising ROE in year 5 doubles. The correct answer to the first question is 128.34%. The difference between the correct answer (Q1) and each participant‟s response (correct answer minus participant‟s answer) is the dependent measure (accuracy) used to test hypothesis H1. Lower scores on this measure indicate greater accuracy. Table 2, Panel A, shows that all participants had a mean estimation of year 6 ROE (Q1) that was less than the correct answer by 71.242 (tabular), 87.110 (2-D), and 63.876 (3-D).
The other dependent variable used to test hypothesis H1 was question two, which asked the participants to estimate the average of turnover (Q2a), profitability (Q2b) and leverage (Q2c) for the years 1, 2, 4 and 5, and use the estimated average to calculate a new ROE (Q2d). The correct answers to the second question are: (a) average turnover = 1.045, (b) average profitability = 3.955%, (c) average leverage = 2.72 and (d) the new ROE = 11.241%. Differences between the correct answers (Q2a-d) and each participant‟s responses (correct answer minus participant‟s answer) are the dependent measures (accuracy) used to test hypothesis H1. Lower scores on this measure indicate greater accuracy.
Table 2, Panel A provides mean results for Q2a-d. For Q2a participant responses are greater than the correct answer by -5.001 (tabular), -1.503 (2-D), and -0.874 (3-D). The participant‟s mean estimation of profitability Q2b was less than the correct answer by 0.796 (tabular), and 0.626 (2-D), while the mean answer for the 3-D perspective display was greater than the correct answer by -1.541(3-D). For Q2c, the mean estimation of leverage, participant‟s answers were greater than the correct answer by -0.032 (tabular), -1.898 (2-D), and -0.322 (3-D). Finally, for Q2d, mean estimation of ROE, participant‟s answers were greater than the correct answer by -16.392 (2-D) and -1.055 (3-D), while mean answer for the tabular display were less than the correct answer by 0.359 (tabular).
The mean results for the dependent variables from the preceding paragraphs provide little support for hypothesis H1, which predicted that participants viewing a set of 2-D displays will be the most effective in an accounting judgment involving estimation of values when compared to participants using a single 3-D perspective display or participants using a table. Prior to presenting ANCOVA results for the four dependent variables used to test hypothesis H1, a MANCOVA analysis was conducted. As shown (Table 2, Panel B), the overall F-statistic for the manipulated variable Treatment is significant (p = 0.005) using Pillai‟s Trace. The results are also significant (p = 0.004) using Hotelling‟s Trace. These significant results allow for analysis of the univariate results, which are provided on Panel B of Table 2.
Panel C indicates that manipulation of the presentation formats (Treatment) is significantly (p = 0.032) associated with the accuracy of the participants in estimating what the ROE would be in year 6 (Q1) if each of the variables comprising ROE in year 5 doubles. A paired comparison test (Table 2, Panel D) shows that the participants viewing the 3-D perspective display were more (p = 0.031) effective or accurate than those participants viewing the 2-D displays in this trend analysis task (Q1). Thus, hypothesis H1 predicting that participants viewing a set of 2-D displays will be the most effective in an accounting judgment involving estimation of values, when compared to participants using a single 3-D perspective display or participants using a table, was not supported.
Contrary to expectation, Panel C indicates that the manipulation of the presentation formats (Treatment) does not have a significant (p = 0.170) effect on the accuracy of the participants in estimating the average of turnover for the years 1, 2, 4 and 5 (Q2a). Since there is no significant main effect a paired comparison test was not conducted. Panel C also indicates that the manipulation of the presentation formats (Treatment) does not have a significant (p = 0.094) effect on the accuracy of the participants in estimating the average of profitability for the years 1, 2, 4 and 5 (Q2b). Since there is no significant main effect a paired comparison test was not conducted.
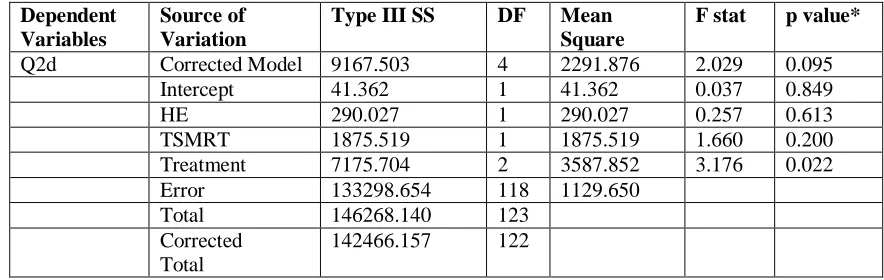
A paired comparison test (Table 2, Panel D) also shows that the participants viewing the 3-D perspective display were more (p = 0.047) effective or accurate than those participants viewing the 2-D displays in this task (Q2c). Thus, hypothesis H1was not supported. Panel C indicates that manipulation of the presentation formats (Treatment) is significantly (p = 0.022) associated with the accuracy of the participants in estimating the average of turnover, profitability and leverage for the years 1, 2, 4 and 5, and using the estimated average to calculate a new ROE (Q2d). A paired comparison test (Table 2, Panel D) shows that the participants viewing the tabular display were more (p = 0.026) effective or accurate than those participants viewing the 2-D displays in this task (Q2d). Hypothesis H1was not supported.
In summary, hypothesis H1 is not supported. While the MANCOVA result showed a significant treatment effect, the significant pairwise comparisons at the ANCOVA level show that Q1, Q2c and Q2d, are opposite what was predicted, indicating that use of 2-D displays did not result in greater accuracy by participants.
Table 2
Test Results of H1
(Participants viewing a set of 2-D displays will be the most effective in an accounting judgment involving estimation of values),
MANOVA Model on Effectiveness (Accuracy) in Estimation of Values
‘Based on the ROE of year 5 (Bubble 5), what would be year 6 ROE if each of the variables of ROE in year 5 had doubled?’ (Q1)
‘Estimate the average of turnover, profitability and leverage for the years 1, 2, 4, and 5, and use them to calculate a new ROE’ (Q2a), (Q2b), (Q2c), (Q2d)
Tests of Between-Subjects Effects on Effectiveness
Panel A: Mean Scores on the Tasks.
Dependent Variable
Treatment Actual Mean MANCOVA
Adjusted Mean*
Q1 Tabular Display (n=42) 71.242 72.184
2-D Displays (n=40) 87.110 88.030
3-D Perspective Display (n=41) 63.876 62.015
Q2a Tabular Display (n=42) -5.001 -5.054
2-D Displays (n=40) -1.503 -1.490
3-D Perspective Display (n=41) -0.874 -0.834
Q2b Tabular Display (n=42) 0.796 0.777
2-D Displays (n=40) 0.626 0.563
3-D Perspective Display (n=41) -1.541 -1.457
Q2c Tabular Display (n=42) -0.032 -0.105
2-D Displays (n=40) -1.898 -1.933
3-D Perspective Display (n=41) -0.322 -0.213
Q2d Tabular Display (n=42) 0.359 1.756
2-D Displays (n=40) -16.392 -16.329
3-D Perspective Display (n=41) -1.055 --2.547
The number of observations of 3-D Perspective Display is 41 instead of 42 as an outlier was dropped *Adjusted Mean is for the effects of the covariates.
Panel B: Multivariate Tests
Variables Multivariate Test Value F stat |p value|
Intercept Pillai‟s Trace 0.229 6.789 < 0.001
HE Pillai‟s Trace 0.013 0.306 0.908
TSMRT Pillai‟s Trace 0.048 1.148 0.339
Treatment Pillai‟s Trace 0.205 2.627 0.005
HE = highest level of education.
Table 2: Test Results of H1 (Continued)
Panel C: ANOVA Results Using Scores as the Dependent Variables.
Dependent Variables
Source of Variation
Type III SS DF Mean
Square
F stat p value*
Q1 Corrected Model 19410.708 4 4852.677 1.998 0.099
Intercept 73061.681 1 73061.681 30.077 0.000
HE 2331.893 1 2331.892 0.960 0.329
TSMRT 5704.231 1 5704.231 2.348 0.128
Treatment 13641.724 2 68200.862 2.808 0.032
Error 286643.074 118 2429.179
Total 978643.709 123
Corrected Total
306053.782 122
Q2a Corrected Model 414.336 4 103.584 0.563 0.690
Intercept 28.689 1 28.689 0.156 0.694
HE 2.950 1 2.950 0.016 0.899
TSMRT 0.622 1 0.622 0.003 0.954
Treatment 400.509 2 200.255 1.088 0.170
Error 21714.821 118 184.024
Total 22890.690 123
Corrected Total
22129.157 122
Q2b Corrected Model 171.343 4 42.836 1.246 0.295
Intercept 29.571 1 29.571 0.860 0.356
HE 15.855 1 15.855 0.461 0.498
TSMRT 15.943 1 15.943 0.464 0.497
Treatment 116.794 2 58.397 1.698 0.094
Error 4057.884 118 34.389
Total 4229.407 123
Corrected Total
4229.227 122
Q2c Corrected Model 98.817 4 24.704 2.004 0.098
Intercept 24.965 1 24.965 2.025 0.157
HE 1.571 1 1.571 0.127 0.722
TSMRT 15.390 1 15.390 1.248 0.266
Treatment 84.540 2 42.470 3.429 0.018
Error 1454.674 118 12.328
Total 1620.097 123
Corrected 1553..492 122
Table 2: Test Results of H1 (Continued)
Panel C: ANOVA Results Using Scores as the Dependent Variables.
Dependent Variables
Source of Variation
Type III SS DF Mean
Square
F stat p value*
Q2d Corrected Model 9167.503 4 2291.876 2.029 0.095
Intercept 41.362 1 41.362 0.037 0.849
HE 290.027 1 290.027 0.257 0.613
TSMRT 1875.519 1 1875.519 1.660 0.200
Treatment 7175.704 2 3587.852 3.176 0.022
Error 133298.654 118 1129.650
Total 146268.140 123
Corrected Total
Q1 Adjusted R Squared = 0.032. Q2a Adjusted R Squared = -0.015 Q2b Adjusted R Squared = 0.008. Q2c Adjusted R Squared = 0.037 Q2d Adjusted R Squared = 0.033 HE = highest level of education.
TSMRT = time spent on mental rotations test.
*Treatment p-values are one-tail, all others are two-tail.
Panel D: Bonferroni Pairwise Comparisons for Test H1
Dependent Variables
(I) Treatment (J) Treatment Mean
Difference (I-J)
Std Error p
value*
Q1 2-D Displays Tabular Display
3-D Display
15.846 26.015
11.026 11.098
0.230 0.031
Q2c 2-D Displays Tabular Display
3-D Display
-1.828 -1.720
0.785 0.791
0.032 0.047
Q2d 2-D Displays Tabular Display
3-D Display
-18.085 -13.782
7.519 7.568
0.026 0.106
*p-values are one-tail.
Results of Hypothesis H2
Two dependent variables were used to test hypothesis H2− the time spent in seconds by each participant when answering the first question (Q1), and the time spent in seconds by each participant when answering all four parts of the second question (Q2). In constructing the models to test hypothesis H2, four covariates − practice question five (PQ5), time spent on practice question five (TSPQ5), score on the mental rotations test (SMRT), and time spent on the mental rotations test (TSMRT) − were included in the model along with the manipulated variable Treatment.
The first dependent variable used to test hypothesis H2 was the time spent in seconds by each participant when answering the first question (TSQ1) which asked what the ROE in year six would be if each of the variables of ROE in year 5 doubled. Table 3, Panel A indicates that those participants viewing a tabular display (mean seconds 109) used 11% more time (in seconds) than those viewing the 2-D displays (mean seconds 98) .Those participants viewing the 3-D perspective display (mean seconds 94) were as efficient as those participants viewing the 2-D displays when answering the first question.
The second dependent variable used to test hypothesis H2 was the time spent in seconds by each participant when answering the second question (TSQ2), which asked the participants to estimate the average of turnover, profitability, and leverage for the years 1, 2, 4, and 5, and use them to calculate a new ROE. Table 3, Panel A indicates on average participants- viewing the tabular display (mean seconds 221), participants viewing the 2-D displays (mean seconds 218), and participants viewing a 3-D perspective display (mean second 210) – of different treatment groups spent roughly the same amount of time in seconds when answering the second question.
The mean results for the dependent variables from the preceding paragraphs provide little support for hypothesis H2, which predicted that participants viewing a set of 2-D displays will be the most efficient in an accounting judgment involving estimation of values when compared to participants viewing a single 3-D perspective display or subjects viewing a table.
Table 3
Test Results of H2
(Participants viewing a set of 2-D displays will be the most efficient in an accounting judgment involving estimation of values)
MANCOVA Model on Efficiency (Less Time) in Trend Analysis Task
‘Based on the ROE of year 5 (Bubble 5), what would be year 6 ROE if each of the variables of ROE in year 5 had doubled?’ (TSQ1)
‘Estimate the average of turnover, profitability and leverage for the years 1, 2, 4, and 5, and use them to calculate a new ROE’ (TSQ2)
Tests of Between-Subjects Effects on Efficiency
Panel A: Mean Time Spent on the Tasks.
Dependent Variable
Treatment Actual Mean
(Seconds)
MANCOVA Adjusted
Mean* (Seconds)
TSQ1 Tabular Display (n=42) 109.500 107.300
2-D Displays (n=40) 98.925 103.800
3-D Perspective Display (n=42) 94.809 92.387
TSQ2 Tabular Display (n=42) 221.333 207.700
2-D Displays (n=40) 218.325 227.900
3-D Perspective Display (n=42) 210.095 214.600
*Adjusted Mean is for the effects of the covariates.
Panel B: Multivariate Tests
Variables Multivariate Test Value F stat |p value|
Intercept Pillai‟s Trace 0.006 0.329 0.720
PQ5 Pillai‟s Trace 0.113 7.369 0.001
TSPQ5 Pillai‟s Trace 0.274 21.855 < 0.001
SMRT Pillai‟s Trace 0.078 4.921 0.009
TSMRT Pillai‟s Trace 0.130 8.696 <0.001
Treatment Pillai‟s Trace 0.016 0.479 0.751
PQ1 =score on practice question 5.
TSPQ5 = time spent in seconds by each participant when answering practice question 5. SMRT = Score on Mental Rotations Test.
TSMRT = Time Spent on Mental Rotations Test.
5. Conclusions and Implications
There was no support for hypothesis H1using any of the five dependent measures tested. In fact, for the dependent measure Q1, participants viewing the 3-D perspective display were more effective than those participants viewing the 2-D displays in estimating what the ROE would be in year 6 if each of the variables comprising ROE in year 5 doubles. This same result was also found for the dependent measure Q2c, which asked participants to estimate the average of leverage for the years 1, 2, 4, and 5, both the participants viewing the tabular display and the participants viewing the 3-D perspective display were more effective than those participants viewing the 2-D displays. Lastly, for the dependent variables Q2d participants viewing the tabular display were more effective than those participants viewing the 2-D displays.
Since Hypothesis H1was not supported, it is concluded that one of the contributing factors for the better performance (in terms of accuracy) of the participants viewing a single 3-D perspective display is Spatial Transformations. The results of hypothesis H1 suggest that those participants viewing a single 3-D perspective display is using spatial reasoning in the form of Spatial Transformations to construct and interpolate new values which were not explicitly found on the visualization.
Hypothesis H2 was not supported, because there was no significant difference between treatment-groups in terms of time used in a task involving interpolation of values. Trafton and Trickett (2004) suggested that whenever participants had to draw longer mental extensions to the line of slope, their response times systematically increased and their accuracy decreased.
This study contributes to the literature by demonstrating that forty-one undergraduate students, with particular domain knowledge of return on equity, perform Spatial Transformations to complete a task involving interpolation of values from a three dimensional perspective display. Prior literature used a small number of scientists (astronomer, physicist) and meteorologists as participants in researches of Spatial Transformations (e.g. Trafton & Trickett, 2004; Trafton, Marshall, Mintz, & Trickett, 2002). Trafton and Trickett (2004) recruited only six undergraduate students to perform a task that did not require domain knowledge.
This study also contributes to the literature by suggesting a number of possible covariates that can affect the dependent variables of effectiveness (accuracy) and efficiency. Participants need to be trained to get familiar with their randomly assigned display format, the knowledge of return on equity, and their assigned task. Individual characteristics such as performance in the Mental Rotation Tests and highest level of education are significant covariates.
Finally, this study contributes to the literature by demonstrating that participants of the study were able to learn and use a display format that they had never seen before – the 3-D perspective display of DuPont analysis. Analysis of the responses to the survey questions show that users of the 3-D perspective display did not negatively or overwhelmingly dislike this newly created presentation format.
References
Bertin, J. (1981). Graphics and Graphic Information Processing. Berlin: Walter de Gruyter & Co.
Bogacz, S. & Trafton, J. G. (2005). Understanding dynamic and static displays: Using images to reason dynamically. Cognitive Systems Research, 6(4), 312-319.
Dull, R. B., & D. P. Tegarden. (1999). A comparison of three visual representations of complex multidimensional accounting information. Journal of Information Systems 13 (2): 117-131.
http://www.goldensoftware.com
Fuller, R., Murthy, U., & Schafer, B. (2010). The effect of data moel representation method on task performance. Information & Management, 47(4), 208-218.
Hegarty, M. (1992). Mental animation: Inferring motion from static displays of mechanical systems. Journal of Experimental Psychology: Learning, Memoryand Cognition, 18(5), 1084–1102.
Jarvenpaa, S. L. & Dickson, G.W. (1988). Graphics and managerial decision making: Research based guidelines. Communications of the ACM , 31 (June), 764-774.
Kosslyn, S. M. (1989). Understanding charts and graphs. Applied Cognitive Psychology, 3, 185–226.
Kumar, N. & Benbasat, I (2004). The effect of relationship encoding, task type, and complexity on information representation: An empirical evaluation of 2-D and 3-D line graphs. MIS Quarterly, (June), 255-281. Larkin, J. H. & Simon, A. H. (1987). Why a diagram is (sometimes) worth ten thousand
words. Cognitive Science, 11, 65-99.
Lohse, J. 1991. A cognitive model for the perception and understanding of graphs. Communications of theACM 383: 137-144.
Moriarity. S. (1979). Communicating financial information through multi-dimensional graphics. Journal of Accounting Research, 17 (Spring), 205-224.
Shepard, R. N. & Metzler, J. (1971). Mental rotation of three-dimensional objects. Science, 171, 701–703.
Simon, H. A. (1978). On the forms of mental representation. In Savage, C. W. (Ed.), Minnesota Studies in the Philosophy of Science. Vol. IX: Perception and Cognition: Issues in the Foundations of Psychology Minneapolis; University of Minnesota Press.
Trafton, J. G., Kirschenbaum, S. S., Tsui, T. L., Miyamoto, R. T., Ballas, J. A., & Raymond, P. D. (2000). Turning pictures into numbers: Extracting and generating information from complex visualizations. International Journal of Human ComputerStudies, 53(5), 827–850.
Trafton, J.G. & Trickett, S. B. (2001). A new model of graph and visualization usage. Naval Research Lab Washington D.C.
Trafton, J. G., Marshall, S., Mintz, F., & Trickett, S. B. (2002). Extracting Explicit and Implicit Information from Complex Vusalizations. Lecture Notes in Computer Science, 2317, 25-48.
Trafton, J.G. & Trickett, S. B. (2004). Spatial Transformations in Graph Comprehension. Lecture Notes in Computer Science, 2980, 1-19.
Tricket, S. B. & Trafton, J. G. (2006). Toward a comprehensive model of graph comprehension: Making the case for spatial cognition. Lecture Notes in Computer Science, 4045, 286-300.