Published online August 10, 2014 (http://www.sciencepublishinggroup.com/j/ajss) doi: 10.11648/j.ajss.20140204.14
ISSN: 2330-8559 (Print); ISSN: 2330-8540 (Online)
Offensive process analysis in handball: Identification of
game actions that differentiate winning from losing teams
Willian R. Ferrari
*, João Valente dos Santos, Vasco Parreiral Simões Vaz
Faculty of Sports Science and Physical Education, University of Coimbra, Portugal
Email address:
[email protected] (W. R. Ferrari), [email protected] (J. V. dos Santos), [email protected] (V. P. S. Vaz)
To cite this article:
Willian R. Ferrari, João Valente dos Santos, Vasco Parreiral Simões Vaz. Offensive Process Analysis in Handball: Identification of Game Actions that Differentiate Winning from Losing Teams.American Journal of Sports Science. Vol. 2, No. 4, 2014, pp. 92-96.
doi: 10.11648/j.ajss.20140204.14
Abstract:
This present study aims to show the main offensive differences between handball teams that lead to a win or a loss. The samples were collected through quantitative analyses of the Champions League 2011-2012 handball games. This study relied on non-descriptive and non-parametric statistics. The Mann-Whitney U test was used as the statistical method. The variables that show the significant differences in favour of the winners were the goals obtained in positioned attacks, 9-meter goals and 7-meter penalties, which, in the semi-finals and final decided who the winner would be. This study shows that the teams who reached the finals and came out victorious have a wide and well-defined range of offensive actions enabling them to involve all aspects of the game, in any situation. This tendency was particularly visible in positioned attacks, which was the main difference throughout the competition.Keywords:
Handball, Observational Methodology, Manual Notation, Winning and Losing Teams Profile, Sports Performance1. Introduction
Today’s Handball is being decided in small details, due to the big investments made in teams, turning the game analysis, as in most sports, into a game decisive factor. The direct observation is the most used method in game analysis, helping to better understand and explore the different relations within the game (1). In order to enhance the game comprehension, it’s necessary to focus on the analysis that enables us to better understand the relationship between different factors, making the relation between the game dynamics and the success patterns of the winning teams understandable (2; 3). From this point of view, it is important that coaches consider, among other physical attributes, the player’s ability to interact with the environment and the individual and group decision-making within the game (4). The observation and analysis of play is essential to the evaluation of the fundamental characteristics of teams and players, resulting in the coach’s intervention (5). The game analysis is defined by measuring individual performance, physical loads, tactical solutions, the study of interactions within and between staff, discovering talents, supporting the decision making of coaches and theoretical interest in the
game’s structure (6;7).
Various authors in various ways have carried out handball analysis. The predominance of tactical elements in the outcome of the winning team’s attacks during the first Croatian Handball League was clearly characterized by rapid attacks against disorganized defences (8). Bilge compares data from the European Championships with other tournaments, considering the success of European teams in World Men's Handball. It was determined that in terms of efficiency, fast break goals, which is the key element of modern Handball, compared to the effectiveness of nine meters shots, remained relatively constant over the three years of competition.
concentrate more on the collective aspect of the game because the best teams are most effective when shooting near the goal, noting that the women's teams that had a higher shot efficacy reached victory. In men, the main difference is the number of balls lost due to a more balanced physical and evolutionary game (10).
Following the same type of study, Saez has collected data from the teams participating in the 2008 King's Cup in Spain by observing 7 games of 8 different teams, using, as the key differentiating factors between winning and losing teams, goals, failed 6m shots and counterattack goals. However, a study conducted in the ASOBAL Handball league in the 2008-2009 season with 240 games of 16 different teams has shown that there are significant differences between winners and losers in the following statistics: goals and shooting in actions counterattack (11).
This study aims to develop a characterization of the offensive process, evaluate the attack patterns, correlate the effectiveness of winning team’s attacks and analyse the attack variables that differentiate the winning from the losing teams. At the end, verify if the performance of the winning teams follows a pattern that is likely to be a future standard.
After consultations articles made in this area, this study aims to take a different view from other studies due to the level of the teams in the competition to be very similar, there is no great disparity between teams and players.
2. Methods
2.1. Sample
The data for this study collected through observation of the official EHF Champions League games available online, containing the complete sets of all 2011/2012 season games. We observed 20 games throughout the finals from the "Last 16" teams that reached the "Final 4", 8 games in the "Last 16", 8 games in the "quarterfinals" and 4 more games in the "Final 4". With the main focus on the four teams (THW Kiel, Atletico de Madrid, and AG Kobenhavn Fusche Berlin) that reached the final stages of the competition
For the present study was constructed a grate collection. Data collected simultaneously with the losing team and the winning team of the respective game. Then the data placed in Microsoft Excel 2013 program, for a better analysis of results. All games seen within one month aiming to minimize the discrepancy analysis.
2.2. Variables
The variables chosen according to studies, in which we identified as being most important to define the winners from losers.
- Number of possess: Number of the ball in offensive actions of each team. It considered that a team has possession of the ball when you have an uninterrupted and complete control of the ball (12).
- Time of posse: Number of the ball in offensive actions of
each team.
- Total Attempts: Total number of attempts made by the team throughout the game.
- Attempts Positioned: Number of attempts made by the teams placed in the position of attack.
- Attempts Counter Attack: Number of trim held on the counterattack as described (13), which set against direct attack as a direct attack by 2 or 3 players, emerging from a long pass from the guard goalkeeper or an outfield player in their defensive zone to a player who isolates himself in front of the opponents.
- Attempts Sustained Attack: Number of shots played in supporting attack (13) is defined as an attack carried out by the rearmost players progress in the field passes through quick progression on in order to make an attack on a numerical superiority while the defense is not fully organized.
- Attempts 9m.: Total number of shots made the dashed line of 9 meters or behind it.
- Attempts 7m.: Total number of shots made in a game penalty.
- Attempts 6m.: Total number of shots made from the line of 6 meters.
- Total Goals: Total goals achieved by the teams.
- Positioned goals: Number of goals made by the teams when they positioned in attack.
- Goals Counterattack: Number of goals made by the teams using the counterattack.
- Attack Sustainable Goals: Number of goals made by the teams using the sustained attack
- Goals 9m.: Number of goals made by teams in shots 9 feet.
- Goals 7m.: Number of goals made by teams in penalty 7 meters.
- Goals 6m.: Number of goals made by the teams to trim 6 feet.
- % Attempts: Percentage of success of the teams on the total number of shots
- % Positioned: Percentage of correct teams positioned in attack.
- % Counter Attack: Percentage of success of the teams on the counterattack.
- % Sustainable: Percentage of success of teams in sustained attack.
- % Attempts 9m.: Percentage of success of the teams in the shot 9m.
- % Attempts 7m.: Percentage of correct teams in penalties of 7 meters.
- % Attempts 6m.: Percentage of success of the teams shots of 6m.
statistics 20.
3. Results and Discussion
Something that contradicts the literature is that
counterattack shots do not show statistically significant differences (p = 0.44) showing a mean difference of 0.88 shots. In terms of counterattack goals, we have a mean difference of 0.88 in favour of the losing teams (Table 1).
Table 1. Results of the Mann-Whitney U test, concerning Possession and shots of the winning and losing teams.
Variables
Losers
(n=17) Mean
Rank
Winners
(n=17) Mean
Rank z p
Mean DP Mean DP
Number of Possess 56.59 2.83 17.15 56.71 2.84 17.85 -.21 .83
Time of Posse 32.42 2.96 19.50 30.91 3.40 15.50 -1.17 .24
Total Attempts 46.47 3.52 14.44 49.06 3.56 20.56 -1.80 .07
Attempts Positioned 34.53 4.69 17.24 34.59 3.26 17.76 -.16 .88
Attempts Counterattack 5.88 2.76 16.21 6.76 2.82 18.79 -.76 .44
Attempts Sustained 3.71 1.83 14.50 4.82 2.24 20.50 -1.79 .07
Attempts 9m. 21.94 3.13 16.06 23.35 4.27 18.94 -.85 .40
Attempts 7m. 3.18 1.55 15.26 4.06 1.89 19.74 -1.34 .18
Attempts 6m. 21.82 3.73 17.29 21.65 5.48 17.71 -.12 .90
(*) p<0.05 (**) p<0.01)
The total number of goal attempts that hit the target tended to be statistically significant (p = 0:07) (Table 1).
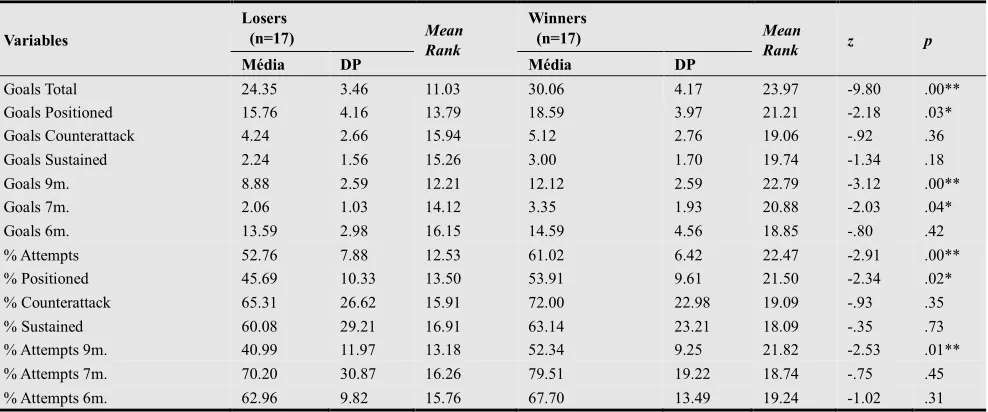
Statistical significances may be noted in the aspect of goals in positioned attacks (p = 0.03) and a difference between means of 8.22% about the percentage of
successful shots in positioned attacks. The number of 9m goals scored by the winning teams (p = 0.00) and goals scored from 7m penalties (p = 0.04) were the main aspects that differentiated winning from losing teams (Table 2).
Table 2. Results of the Mann-Whitney U test, referring to the Offensive Effectiveness in both winning and losing teams.
Variables
Losers
(n=17) Mean
Rank
Winners
(n=17) Mean
Rank z p
Média DP Média DP
Goals Total 24.35 3.46 11.03 30.06 4.17 23.97 -9.80 .00**
Goals Positioned 15.76 4.16 13.79 18.59 3.97 21.21 -2.18 .03*
Goals Counterattack 4.24 2.66 15.94 5.12 2.76 19.06 -.92 .36
Goals Sustained 2.24 1.56 15.26 3.00 1.70 19.74 -1.34 .18
Goals 9m. 8.88 2.59 12.21 12.12 2.59 22.79 -3.12 .00**
Goals 7m. 2.06 1.03 14.12 3.35 1.93 20.88 -2.03 .04*
Goals 6m. 13.59 2.98 16.15 14.59 4.56 18.85 -.80 .42
% Attempts 52.76 7.88 12.53 61.02 6.42 22.47 -2.91 .00**
% Positioned 45.69 10.33 13.50 53.91 9.61 21.50 -2.34 .02*
% Counterattack 65.31 26.62 15.91 72.00 22.98 19.09 -.93 .35
% Sustained 60.08 29.21 16.91 63.14 23.21 18.09 -.35 .73
% Attempts 9m. 40.99 11.97 13.18 52.34 9.25 21.82 -2.53 .01**
% Attempts 7m. 70.20 30.87 16.26 79.51 19.22 18.74 -.75 .45
% Attempts 6m. 62.96 9.82 15.76 67.70 13.49 19.24 -1.02 .31
(*) p<0.05 (**) p<0.01)
The total number of shots on target have shown a tendency to be statistically significant (p = 0.07), having an average difference between the teams of 2.59 shots (losing teams) per game (Table 1). Thus the percentage of Goal attempts as a statistically significant difference (p = 0.00) showed a mean difference between the teams of 8.26% for the winners (52.76% losers, 61.02% winners), (Table 2). The comparative study shows that winners have an average difference of 8.17% (41.01% losers, 51.18% winners) showing the quality of the observed games, where the percentage of successful shots (goals) in that particular study to be higher in the losing teams then in the winning
ones by comparing both studies (14). These were the main aspects where winning and losing teams can be differentiated.
them, as this present study shows 2.06 for the losers and 3.35 for the winners with a 1.29 mean difference, being the number of goals scored by the losers the major difference between the studies which, in this study, presents an average number of 0.76 between the two comparative studies.
Something that contradicts the literature is that counterattack shots do not show statistically significant differences (p = 0.44) showing a mean difference of 0.88 shots Table 1. In terms of counterattack goals, we have a mean difference of 0.88 in favour of the losing teams and a percentage of hits of 65.31% for the losers and 72.00% for the winners. The same study mentioned above shows an average of 2.84 goals for the losers and 4.45 goals in counterattack situations whilst this present study shows 4.24 for the losers and 5.12 for the winners.
When we compare this present study with youth teams it shown that the winning teams have a higher 6m and counterattack goals rating, as the main differentiators between winning and losing teams (9). 9m goals which, in this present study, show significative values (p = 0.00), are not relevant in Saez’s study (p = 0.41). The same applies to the study of Antunes where he makes a comparison between winning and losing teams in the children's category. Featuring a very low 9m scored goals index (5.78 ± 5:23 to 6:39 ± 6:09 and losers to winners) thereby not a statistically significant difference (p = 0.61).
4. Conclusion
Games won in positioned attack, unlike all the studies, where the literature points to the counter-attack as the main variable of differentiation between winners and losers. 7m penalties, 9m shots, and their efficacy are more and more the main differentiators between winning and losing teams. Due to this, and as an incentive for the youth teams and their coaches, there is no need to have only one offensive solution whether that solution is the counterattack or the positioned attack. This study shows that the all-round teams are the ones who come out victorious. With a positioned attack with a vast number of solutions and variations and well executed by quality players.
Encouraging the training teams and coaches of the same terms that not only have a choice of offensive play, as the counter attack or attack positioned. This study shows that victories made to the most complete teams in all these aspects. With an attack positioned with a greater number of options and variations and running well with high-level players. Having the counterattack as a variable attack and not your main offensive foundation. Complementing this sustained attack, which in turn ends up being a difference in winning teams.
This study hopes to change the coaches’ who spend too much training time with the counterattack philosophies, not to forsake the counterattack, but to add a greater part for the all-round attack and enable shooting opportunities for every player in the team despite their position, because modern
handball seeks the most complete players.
Acknowledgements
My family, friends and teachers who have helped me in this study, with support and help when needed.
References
[1] Silva, A., Sánchez, F., Garganta, J., & Anguera, M.T. (2005). Patrones de juego en el fútbol de alto rendimiento. Análisis secuencial del proceso ofensivo en el campeonato del mundo Corea-Japón 2002. Cultura, Ciencia y Deporte, 1 (2), 65-72.
[2] Volossovitch A. (2005). Analysis of the performance in handball: perspectives and tendencies. Technical Handball Magazine; Vol. 3 : 16-20.
[3] Warren W. (2006). The Dynamics of Perception and Action. Psychological Review; Vol. 113 : 358-89.
[4] Araújo, D. Davids, K. & Hristovski, R. (2006). The ecological dynamics of decision making in sport. Psychol Sport Exercices; 7: 653-676.
[5] Gomes R 2002. Análise de dados em pesquisa qualitativa. Pesquisa social: teoria, método e criatividade. Editora Vozes, p 67-80 Petrópolis.
[6] Garganta, J. (1998). Analisar o jogo nos jogos desportivos. Revista Horizonte XIV (83), 7-14.
[7] Garganta, J. (1996). Análise do jogo de futebol. Acta das II jornadas do CEJD. FCDEF-UP, Porto.
[8] Rogulj, N., Srhoj, V., & Srhoj, L. (2004). The contribution of collective attack tactics indifferentiating handball score efficiency. Coll. Antropol. 28 (2): 739-746.
[9] García J., Ibáñez S., Feu S., Cañadas M., Parejo I. (2008). Study of the differences y play between winning and losing teams in formative stages of team handball. CCD. 5 Vol. 3 (9) 195-200.
[10] Antúnez, A., García, J, Sáez, F.J., Valle, A., García, A. (2013) Differences in performance indicator between winning and losing team in formative stages according to sex and final score differences. Revista de Ciencias del Deporte, 9 (1), 5-16.
[11] Gutiérrez A., López P. (2010). Discriminant analysis between winners and losers in the asobal league 2008-2009. http://activities.eurohandball.com/web-periodicals [pesquisa efectuada em 20/10/12].
[12] Malarranha, J., Sampaio, J. (2007). Ritmo dos jogos das finais das competições europeias de basquetebol (1988-2006) e as estatísticas que discriminam os jogos mais rápidos dos jogos mais lentos. Revista Portuguesa de Ciências do Desporto; vol.7, 2: 202-208.
[13] Fernandez E. & Falkowski, M. (1988). Los sistemas de juego offensivos. Coleccion Handball, número 8 Editorial Esteban Sanz Martinez.