Tribology in Industry
www.tribology.rs
Oil Film Thickness Measurements Combined with
High Temperature Friction Investigations in a
Simplified Piston-Ring Lubrication Test Rig
P.S. Dellis
a,*
aASPETE, Department of Mechanical Engineering Educators, Athens, Greece.
Keywords:
Piston-ring lubrication Single-ring test rig Oil film thickness
Friction force measurements Capacitance
Cavitation
A B S T R A C T
The effect of lubricants properties in oil film thickness was evaluated and linked to performance limitations in view of cavitation appearance, its initia Ccapacitance tion and development. The piston-ring and the cylinder liner interface are characterized in terms of oil film thickness measurements. Study of cavitation in lubricants and its rheology were presented in previous studies and results of different lubricants, speed, load, temperature and piston-ring curvatures were assessed to achieve useful tribological engine data that apply to the piston-cylinder assembly. The evaluation of new designs that can be applied to the ring/liner interface and many future parametric studies that can be combined with surface modifications in both parts of the assembly are under examination. The use of a simplified single-ring test rig that utilizes a steady piston-ring section of overall width 5 mm placed under a flat liner surface that reciprocates instead, takes advantage of significantly less uncertainties when compared to engine experiments. Minimum oil film thickness measurements (MOFT) is studied for different lubricants as a variation of temperature and simultaneously friction high temperature results for the whole stroke length are presented. Measurement transducers for the separation of the metal surfaces (liner and piston-ring) and the friction force developed in the contact surfaces were the conventional methods used. Within certain parts of the stroke where friction reaches its maximum value, a greater focus is given to evaluate the effect of different operating conditions. Useful conclusions are drawn regarding lubricants behavior under cavitation that can be used to new additives design and enhancement of lubricant physical-chemical properties that have the potential to conform to the even stricter emission regulations that will apply in the future.
© 2019 Published by Faculty of Engineering
* Corresponding author:
Polychronis S. Dellis
E-mail: pasd@city.ac.uk
Received: 5 August 2019 Revised: 30 September 2019 Accepted: 14 November 2019
1. INTRODUCTION
The piston-liner interface is one major engine tribological component that is studied in terms
of lubrication and rheology, so that a better understanding can be given regarding the lubrication phenomena at the converging diverging wedge of the ring-liner interface. The
R
ES
EA
R
development of oil film thickness in different
lubrication regimes according to the
reciprocating speed is the outcome of this tribological process and the most significant part of this process is the continuous trial to reduce friction losses. Furthermore low oil consumption and minimised wear should be considered in parallel to promote the optimisation of engine tribology.
Optimization of all around lubricant
performance is the outcome of specifically blended engine oil formulation [1]. A result of this is the enhancement of piston-ring load carrying capacity. The appearance of cavitation with its different forms during the stroke at the converging-diverging wedge has the opposite and adverse effect [1- 3].
Rastogi and Gupta [4] have shown that the main goal of the additives is reduction of lubricant dependence on viscosity variation due to temperature. The addition of polymers in the lubricant composition strengthens viscoelastic properties and the oil becomes slightly shear-thinning [1,4]. Large cavitation zone is the result of lubricant shear-thinning. Shear stress affects lubricant viscosity along with temperature variation [1]. Viscoelastic additives increase the load carrying capacity and also reduce wear [5].
As temperature varies viscosity of different lubricants varies as well but at a different rate. Minimum lubricant film thickness and load carrying capacity have a significant rate of decrease with increasing temperature [6]. At high temperature shear thinning lubricants are prone to the appearance of large cavities as a result of the reduced viscosity [4]. Lubricant properties need to be controlled as these circumstances promote a significant loss of load carrying capacity. The viscosity variation has a significant impact on flow separation points, which also affects the oil film pressure profile and types of cavitation [7].
Lubrication experiments were conducted in a specially designed single-ring test rig. The test rig has the ability to provide lots of reliable parametric results and is used as a platform for designing and implementing new measuring techniques, such as oil film pressure measurements with ultra-miniature transducers that can average the pressure over the ring
width with satisfactory outcome. Simulation of the piston-cylinder assembly is achieved by a fixed parallelepiped piston-ring section that has a convex top surface and a flat liner that reciprocates, making the actual engine assembly inversed. The test rig, thus, is capable of providing a simple version of the engine piston tribology. Eventually, the complexity of the engine lubrication and rheological phenomena are avoided and engine experiments can be interpreted much easier [3,8-10]. Taking advantage of this simplified experimental set-up, mounting of any measurement sensor can provide clear information of the lubrication between the surfaces. The accessibility of the ring-liner assembly can help in set-up
characteristics changes [2,3,8,9]. During
previous work parametric results were acquired to complement on (initiation and development) cavitation findings [1-3,8,9] and were used to interpret friction and oil film pressure results [10,11]. The simplified layout has the advantage of providing experimental data capable of being interpreted in a much safer way. Afterwards moving to engine testing will be advantageous in
terms of results interpretation and
implementation of novel techniques.
This study presents different lubricants testing with a view of temperature variation. Minimum oil film thickness is measured with a capacitance sensor (electrical method). The lubricants test matrix involves speed and load variation to analyse the lubricants behaviour. Under these circumstances friction is measured and both measurements are combined to complement on the MOFT results for certain stroke parts, where the different lubrication regimes are identified. MOFT results are given as the outcome of lubricant properties variation (different blends and varying viscosity) and provide an insight of the cavitation conditions occurring at the dead centers of the stroke with temperature variation.
Results are focused on MOFT and friction, with temperature variation, measured with a capacitance and a friction force sensor respectively [10] as previously stated.
2. EXPERIMENTAL SET-UP
static load hung at the one edge of the simplified single ring test rig and the lubricant temperature can be adjusted according to certain experimental specifications.
The main drive train reciprocates the liner and rubber couplings are used to absorb vibrations. A crank mechanism turns the reciprocating motion to linear (sinusoidal velocity) [1,8-10].
Minimum oil film thickness is measured with a capacitance sensor. This very popular film thickness method is widely used [2,8,9]. Capacitance between two surfaces is directly proportional to the surface area and inversely proportional to their separation. Distance between the two surfaces is set to 30 microns with the aid of a shim. Mounting of the custom capacitance sensor is outside the oil bath next to the piston-ring. The lubricant film is measured throughout the whole length of the stroke which in this case has a maximum length of 50 mm. A signal conditioning unit (Capacitec), converts the capacitance signal output to voltage which in turn is being acquired and recorded through the National Instruments data acquisition system. The linearity of the capacitance signal is valid for measurements of 10 microns thick maximum [12]. When the reciprocating liner accelerates from zero at the dead centers of the stroke, the lubricant film develops. When the liner moves towards the stroke dead centers the surfaces’ asperities are in contact which is the prevailing action. This interaction is described by the boundary or mixed lubrication regime. The squeeze film effect in these lubrication regimes results in beneficial load support during flow reversal, further supported by the minimal amount of lubricant between the interacting surfaces. With increasing velocity the surfaces separate. The lubricating region from mixed turns to elastohydrodynamic and eventually full film-hydrodynamic and at the same time the interacting surfaces separate resulting in asperity interaction decrease. When moving from near mid-stroke towards bottom dead center (BDC), an opposite mechanism takes place. With velocity reduction, lubrication turns to mixed from hydrodynamic and when the liner further decelerates, surfaces come into contact and lubrication turns to boundary. Cavitation forms diminish at this point into bubbles and at the same time squeeze film effect is saving the contact at the other side of the stroke dead center [1,8,9,13].
A PCB 208B force measuring sensor (load cell) is used for friction measurements. This sensor is able to capture small displacements of the ring assembly, which take place as the liner reciprocates, resulting in axial friction. The amplified signal is acquired through the data acquisition system and then via National Instruments signal conditioning modules.
In Fig. 1, a schematic of the experimental set-up can be seen and Fig. 2 shows a photo of the test rig with the mounted sensors.
Fig. 1. Schematic of the single-ring test rig [1,3].
Fig. 2. Photo of the single-ring test rig [1].
(a)
Friction transducer connection
Friction transducer
(b)
Fig. 3. (a) Top view photo of the sensors layout, and (b) 3D schematic of the capacitance measurement with the magnetic holder and the flat surface on top of the capacitor [2].
Figure 3a, when the liner is removed from its place, shows the mounted sensors of the test rig and Fig. 3b shows a 3-D schematic of the test rig. It can be noticed from Figs. 2 and 3a that the load cell of the friction sensor is mounted outside the oil bath [2,10]. Liner reciprocation places the transducer under tension or compression. The friction signals show that close to the dead centers, in the boundary and mixed (boundary and elastohydrodynamic) lubrication regimes, friction force reaches its maximum and peaks appear close to the dead centers. These results are combined with the capacitance minimum oil film thickness measurements. As surface separation in boundary lubrication regime increases, asperity contact decreases, and this is affecting the friction signal with a friction spike lowering [5].
Tested Lubricant Properties
The parametric lubricant study was conducted with a set of six lubricants that can be found in Table 1.
Table 1. Oils tested for temperature investigations
Blend Code 003B 006E/02 005A/02 002A/02
Grade 0W-30 0W-40 0W-20 10W-40
HTHS (mPa
s) 3.30 3.4 2.14 4.05
V100 (cSt) 12.16 12.8 6.04 14.97
V40 (cSt) 68.93 66.8 31 97.8
VI 182 196 146 160
High temperature testing will be used to investigate the temperature effect. It is essential to determine lubricant behaviour under these circumstances. It is expected that the oil film decreases with rising oil temperature that is a similar behaviour with viscosity decrease. The presented results further on will be used to investigate the effect of temperature in viscosity with a view to the physical-chemical properties on MOFT [8].
3. RESULTS
3.1Temperature Parametric Lubricant Testing
These tests take into account the viscosity variation with temperature according to
Walther’s equation. Lubricant kinematic
viscosity is varying with temperature according to equation (1):
loglog(v+0.7)=A+BlogT (1)
where v is the kinematic viscosity and T the temperature in Kelvin. A, B are constants, that depend on the tested lubricant. Temperature effect in oil 3B viscosity is shown in Figure 4. Additionally, the difference in minimum oil film thickness measurements (capacitance) is further explained for temperature variation.
Fig. 4. Temperature effect on kinematic viscosity, oil 3B.
High temperature results for oil 3B in Figs. 5a-5c show that MOFT decreases at high temperatures. There is a gap/step when one compares oil data taken at 35 oC (ambient) and the ones at higher temperature. This trend can be noticed in Figs. 5a-5c for oil 3B. This “gap/step” that is evident in parametric speed measurements is the direct outcome of viscosity variation with temperature (Fig. 4). Viscosity value changes with an increased rate from oil temperature that ranges from 35 oC to 50 oC. Then, at higher
Temperature Effect on Kinematic Viscosity for Oil 3B
0 20 40 60 80 100
0 20 40 60 80 100 120
Temperature (C)
K
in
e
m
a
ti
c
V
is
c
o
s
it
y
(
c
S
t)
Fibre optic Pressure
transucer
Capacitance sensor
Liner plate
temperatures the value decreases again, this time following a smoother curve. Oil film thickness value is decreasing 46.58 % (at 92.16 deg CA at 200 rpm) and at the same time oil viscosity decreases 43.35 % from 35 oC to 50 oC (from equation (1)) [8].
(a)
(b)
(c)
Fig. 5. (a) Temperature effect at 200 rpm, 1159 N/m, (b) at 400 rpm, 1159 N/m and (c) at 600 rpm, 1159 N/m, oil 3B.
(a)
(b)
(c)
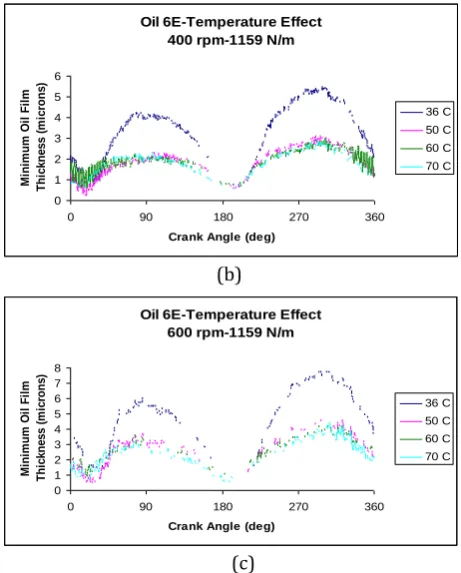
Fig. 6. (a) Temperature effect at 200 rpm, 1159 N/m, (b) at 400 rpm, 1159 N/m and (c) at 600 rpm, 1159 N/m, oil 6E.
Similar set of results for oil 6E (Figs. 6a-6c) point out how MOFT above 50 oC is affected by temperature.
This trend is not comparable to the one already investigated for previous oil 3B. In Figs. 6a-6c, MOFT curves coincide and this applies for all speed parametric results. In Fig. 7 oil 6E and oil 3B produce similar results in terms of temperature effect in viscosity. Again, viscosity variation with temperature was given according to Walther’s equation.
Fig. 7. Temperature effect on kinematic viscosity, oil 6E.
Oils 3B and 6E were compared from viscosity point of view as temperature increased. The comparison showed that viscosity has an
Oil 3B-Temperature Effect 200 rpm-1159 N/m
0 0.5 1 1.5 2 2.5 3 3.5 4
0 90 180 270 360
Crank Angle (deg)
M in im u m O il F il m T h ic k n e s s ( m ic ro n s ) 35 C 50 C 60 C 70 C
Oil 3B-Temperature Effect 400 rpm-1159 N/m
0 1 2 3 4 5 6 7
0 90 180 270 360
Crank Angle (deg)
M in im u m O il F il m T h ic k n e s s ( m ic ro n s ) 35 C 50 C 60 C 70 C
Oil 3B-Temperature Effect 600 rpm-1159 N/m
0 1 2 3 4 5 6 7
0 90 180 270 360
Crank Angle (deg)
M in im u m O il F il m T h ic k n e s s ( m ic ro n s ) 35 C 50 C 60 C 70 C
Oil 6E-Temperature Effect 200 rpm-1159 N/m
0 0.5 1 1.5 2 2.5 3 3.5
0 90 180 270 360
Crank Angle (deg)
M in im u m O il F il m T h ic k n e s s ( m ic ro n s ) 36 C 50 C 60 C 70 C
Oil 6E-Temperature Effect 400 rpm-1159 N/m
0 1 2 3 4 5 6
0 90 180 270 360
Crank Angle (deg)
M in im u m O il F il m T h ic k n e s s ( m ic ro n s ) 36 C 50 C 60 C 70 C
Oil 6E-Temperature Effect 600 rpm-1159 N/m
0 1 2 3 4 5 6 7 8
0 90 180 270 360
Crank Angle (deg)
M in im u m O il F il m T h ic k n e s s ( m ic ro n s ) 36 C 50 C 60 C 70 C
Temperature Effect on Kinematic Viscosity for Oil 6E
0 20 40 60 80 100 120
0 20 40 60 80 100 120
Te mpe rature (C)
increased value for oil 6E by 1 % at 50 oC, 2.6 % at 60 oC and 4.6 % at 70 oC. These results show that only a small increase in viscosity value comparison cannot justify by itself any minimum oil film thickness measurements results when one refers to the two comparing lubricants. These results show the effect of lubricant formulation and chemical properties. The parameters have a significant impact in variability noticed in the MOFT high temperature characteristics when one refers to a specific lubricant. MOFT measurement is greater in oil 3B than in 6E. Oil 6E has a higher viscosity index but this value is not capable of justifying MOFT increase. In previous studies for lubricants with higher viscosity index (VI), MOFT rises for lubricants with 0W-30 SAE grade [2,8].
In Fig. 8, lubricant 5A has produced similar curves when compared to lubricants 6E and 3B.
(a)
(b)
(c)
(d)
Fig. 8. Load effect – high temperature testing, oil 5A: (a) at 200 rpm, 1159 N/m, (b) at 300 rpm, 1638 N/m, (c) at 400 rpm, 1159 N/m and (d) at 600 rpm, 1159 N/m.
In this case, minimum oil film thickness has a low value when running at low speeds, reaching a maximum of 2.7 μm at 200 rpm (Fig. 8a), 33 oC, whereas lubricants 6E and 3B reach 2.75 μm and 3.5 μm at 200 rpm respectively. Lubricant 5A behaviour can be interpreted as the effect of temperature on viscosity. In Fig. 9, the graph shows for lubricant 5A, the temperature effect on viscosity. In this case, viscosity values at 35 oC, are reaching 50 % lower than oil 3B and 53 % lower than oil 6E. In high speed parametric results a similar trend is produced, i.e 600 rpm in Fig. 8d. The coincidence of the results at high temperature and high load test cases is obvious as there is no clear line between high viscosity and low viscosity data. Results at 600 rpm showed that at the temperature range from ambient to 50 oC, MOFT is reduced 16 % when compared to 200 rpm (Fig.8a) where the reduction in MOFT maxima is 23 %. Lubricant 3B produced similar results. In Fig. 5c, where 600 rpm speed results were presented, it can be seen that temperature does not affect the MOFT curves in the same manner as at lower speeds. In numbers, the reduction at 600 rpm is 34 and 53 % (reduction) respectively at 200 rpm (Fig. 5a). What is interesting to notice is that lubricant 6E produces a far greater stability in this aspect. Again, in numbers, MOFT is reduced 47 % at 600 rpm in Fig. 6c and at the same time at 200 rpm MOFT is reduced 55 % in Fig. 6a.
Fig. 9. Temperature effect on kinematic viscosity, oil 5A.
Oil 5A Temperature Effect 200 rpm-1159 N/m
0 0.5 1 1.5 2 2.5 3 3.5
0 90 180 270 360
Crank Angle (deg)
M
in
im
u
m
O
il
F
il
m
T
h
ic
k
n
e
s
s
(
m
ic
ro
n
s
)
33 C 50 C
60 C
68 C
Oil 5A-300 rpm-1638 N/m
0 0.5 1 1.5 2 2.5 3 3.5 4
0 90 180 270 360
Crank Angle (deg)
M
in
im
u
m
O
il
F
il
m
T
h
ic
k
n
e
s
s
(
m
ic
ro
n
s
)
33 C
50 C
60 C
68 C
Oil 5A Temperature Effect 400 rpm-1159 N/m
0 1 2 3 4 5 6
0 90 180 270 360
Crank Angle (deg)
M
in
im
u
m
O
il
F
il
m
T
h
ic
k
n
e
s
s
(
m
ic
ro
n
s
)
33 C 50 C 60 C 68 C
Oil 5A Temperature Effect 600 rpm-1159 N/m
0 1 2 3 4 5 6 7
0 90 180 270 360
Crank Angle (deg)
M
in
im
u
m
O
il
F
il
m
T
h
ic
k
n
e
s
s
(
m
ic
ro
n
s
)
33 C 50 C 60 C 68 C
Temperature Effect on Kinematic Viscosity for Oil 5A
0 20 40 60
0 20 40 60 80 100 120
Te mpe rature (C)
K
in
e
m
a
ti
c
V
is
c
o
s
it
y
(
c
S
(a)
(b)
(c)
Fig. 10. Load effect – high temperature testing, oil 2A: (a) at 200 rpm, 2216 N/m, (b) at 300 rpm, 3371 N/m and (c) at 600 rpm, 1159 N/m.
Furthermore, for lubricant 5A, it can be noticed that when compared to lubricant 2A in Figs. 8d and 10c, results are not comparable. A similar trend to oils 3B and 6E is evident for oil 2A and in total it can be derived that these lubricants (that have similar trends) possess higher VI, V100, V40 and HTHS values than oil 5A (see Table 1).
3.2Load Effect in oil film Thickness at High Temperature
To accomplish this test lubricant 5A was selected to evaluate parametric load test cases in terms of MOFT at high temperature. The results show the trend at 300 rpm (Figs. 11a-11c) and 500 rpm (Figs. 12a-12c). The outcome was that load has a significant impact on MOFT curves and that applies for all the parametric testing. In this case temperature variation and further on viscosity
variation does not play a significant role. In Figs. 11b-11c and Figs. 12b-12c for high load test cases, the temperature effect on MOFT is reduced when compared to the low load parametric results, i.e temperature effect at 1159 N/m load [8]. MOFT has a low value and when moving towards higher temperatures this value is further reduced, see 68 oC temperature parametric testing in Figs. 11a– 11c and Figs. 12a-12c.
(a)
(b)
(c)
Fig. 11. Load effect – high temperature testing, oil 5A: (a) at 300 rpm, 2216 N/m, (b) at 300 rpm 2793 N/m and (c) at 300 rpm 3371 N/m.
(a)
Oil 2A-300 rpm-3371 N/m
0 0.5 1 1.5 2 2.5 3
0 90 180 270 360
Crank Angle (deg)
M in im u m O il F il m T h ic k n e s s ( m ic ro n s ) 33 C 50 C 60 C 70 C
Oil 2A-300 rpm-2216 N/m
0 0.5 1 1.5 2 2.5 3 3.5 4
0 90 180 270 360
Crank Angle (deg)
M in im u m O il F il m T h ic k n e s s ( m ic ro n s ) 33 C 50 C 60 C 70 C
Oil 2A Temperature Effect 600 rpm-1159 N/m
0 2 4 6 8 10
0 90 180 270 360
Crank Angle (deg)
M in im u m O il F il m T h ic k n e s s ( m ic ro n s ) 33 C 50 C 60 C 70 C
Oil 5A-300 rpm-3371 N/m
0 0.5 1 1.5 2 2.5
0 90 180 270 360
Crank Angle (deg)
M in im u m O il F il m T h ic k n e s s ( m ic ro n s ) 33 C 50 C 60 C 68 C
Oil 5A-300 rpm-2216 N/m
0 0.5 1 1.5 2 2.5 3
0 90 180 270 360
Crank Angle (deg)
M in im u m O il F il m T h ic k n e s s ( m ic ro n s ) 33 C 50 C 60 C 68 C
Oil 5A-300 rpm-2793 N/m
0 0.5 1 1.5 2 2.5
0 90 180 270 360
Crank Angle (deg)
M in im u m O il F il m T h ic k n e s s ( m ic ro n s ) 33 C 50 C 60 C 68 C
Oil 5A-500 rpm-2216 N/m
0 0.5 1 1.5 2 2.5 3 3.5 4 4.5
0 90 180 270 360
Crank Angle (deg)
(b)
(c)
Fig. 12. Load effect – high temperature testing, oil 5A: (a) at 500 rpm, 2216 N/m, (b) at 500 rpm, 2793 N/m and (c) at 500 rpm, 3371 N/m.
(a)
(b)
(c)
Fig. 13. Load effect – high temperature testing, oil 2A: (a) at 300 rpm, 2216 N/m, (b) at 300 rpm, 2793 N/m and (c) at 300 rpm, 3371 N/m.
In Figs. 11 and 12, one can notice that MOFT value is smaller close to BDC than at TDC. This fact, at the point of flow reversal, has an effect on the squeeze film. For high temperature parametric study, the squeeze film is not affected in terms of crank angle appearance. A direct comparison of the ambient temperature results (33-35 oC) and the load tests showed that there is a slight shift towards the dead centers. In load parametric study and at high loads in particular, it was shown that for the squeeze film, there is a marginal shift of the MOFT curves towards the dead centers [8].
In Fig. 13, for oil 2A, the effect of load on MOFT is shown as temperature rises. Oil 2A and 5A produced similar curves with oil 2A having greater V40 and V100 (and VI) than oil 5A. At high loads, the temperature effect on MOFT is not evident.
3.3Effect of High Temperature on MOFT for the Tested Oils at Different Speeds
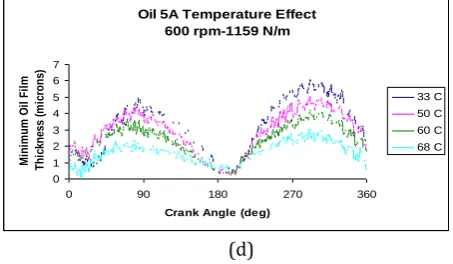
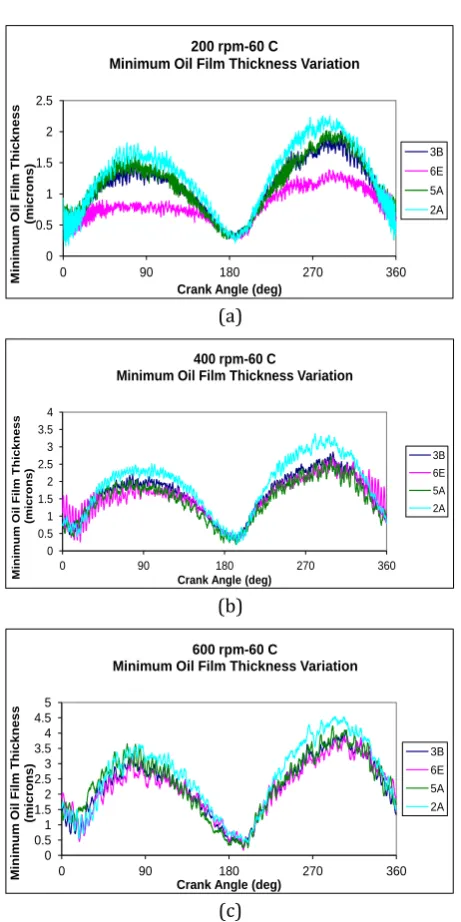
MOFT thickness is compared for all the lubricants tested with a parametric speed test case. The presented graphs show how high temperature is affecting all the tested lubricants. The test matrix includes 50 oC (Fig. 14), 60 oC (Fig. 15) and 68-70 oC (Fig. 16).
(a) 50 oC
(a)
(b)
Oil 5A-500 rpm-2793 N/m
0 0.5 1 1.5 2 2.5 3 3.5 4
0 90 180 270 360
Crank Angle (deg)
M in im u m O il F il m T h ic k n e s s ( m ic ro n s ) 33 C 50 C 60 C 68 C
Oil 5A-500 rpm-3371 N/m
-0.5 0 0.5 1 1.5 2 2.5 3 3.5
0 90 180 270 360
Crank Angle (deg)
M in im u m O il F il m T h ic k n e s s ( m ic ro n s ) 33 C 50 C 60 C 68 C
Oil 2A-300 rpm-2793 N/m
0 0.5 1 1.5 2 2.5 3 3.5
0 90 180 270 360
Crank Angle (deg)
M in im u m O il F il m T h ic k n e s s ( m ic ro n s ) 33 C 50 C 60 C 70 C
Oil 2A-300 rpm-2216 N/m
0 0.5 1 1.5 2 2.5 3 3.5 4
0 90 180 270 360
Crank Angle (de g)
M in im u m O il F il m T h ic k n e s s ( m ic ro n s ) 33 C 50 C 60 C 70 C
Oil 2A-300 rpm-3371 N/m
0 0.5 1 1.5 2 2.5 3
0 90 180 270 360
Crank Angle (de g)
M in im u m O il F il m T h ic k n e s s ( m ic ro n s ) 33 C 50 C 60 C 70 C 0 0.5 1 1.5 2 2.5 3 3.5
0 90 180 270 360
M in im u m O il F ilm T h ickn e ss (m icr o n s)
Crank Angle (deg)
200 rpm-50oC
Minimum Oil Film Thickness Variation
3B 6E 5A 2A 0 0.5 1 1.5 2 2.5 3 3.5 4 4.5
0 90 180 270 360
M in im u m O il F il m T h ic k n e s s (m ic ro n s )
Crank Angle (deg) 400 rpm-50oC
Minimum Oil Film Thickness Variation
(c)
Fig. 14. MOFT variation: (a) at 200 rpm, (b) at 400 rpm and (c) at 600 rpm – 50 oC for all tested oils.
(b) 60 oC
0 0.5 1 1.5 2 2.5
0 90 180 270 360
M inim um O il Fil m Th ickn ess (mi cron s)
Crank Angle (deg)
200 rpm-60 C
Minimum Oil Film Thickness Variation
3B 6E 5A 2A (a) 0 0.5 1 1.5 2 2.5 3 3.5 4
0 90 180 270 360
M in im u m O il F il m T h ickn ess (m icro n s)
Crank Angle (deg)
400 rpm-60 C
Minimum Oil Film Thickness Variation
3B 6E 5A 2A (b) 0 0.5 1 1.5 2 2.5 3 3.5 4 4.5 5
0 90 180 270 360
Min imu m Oil Film T hic kn es s (mic ron s)
Crank Angle (deg)
600 rpm-60 C
Minimum Oil Film Thickness Variation
3B 6E
5A
2A
(c)
Fig. 15. MOFT variation: (a) at 200 rpm, (b) at 400 rpm and (c) at 600 rpm – 60 oC for all tested oils.
(c) 68-70 oC
0 0.2 0.4 0.6 0.8 1 1.2 1.4 1.6 1.8 2
0 90 180 270 360
M in im u m O il F il m T h ickn ess (m icro n s)
Crank Angle (deg)
200 rpm-70 C
Minimum Oil Film Thickness Variation
3B 6E 5A 2A (a) 0 0.5 1 1.5 2 2.5 3
0 90 180 270 360
M inim u m O il Film T h ick n es s (micr o n s)
Crank Angle (deg)
400 rpm-70 C
Minimum Oil Film Thickness Variation
3B 6E 5A 2A (b) 0 0.5 1 1.5 2 2.5 3 3.5 4 4.5
0 90 180 270 360
M in im um O il F il m Th ic k ne s s (m ic rons )
Crank Angle (deg)
600 rpm-70 C
Minimum Oil Film Thickness Variation
3B 6E 5A 2A
(c)
Fig. 16. MOFT variation: (a) at 200 rpm, (b) at 400 rpm and (c) at 600 rpm – 68-70 oC for all tested oils.
Table 2. Viscosity properties for the temperature-load effect experiments and VI properties.
Blend Code 002A /02 005A /02 006E /02 003B
Viscosity (cSt)
50 oC 64.34 21.49 47.13 46.61 60 oC 45.76 15.72 34.55 33.65 70 oC 33.46 12.60 26.29 25.09
VI 160 146 196 182
The majority of the testing showed that for the above series of experimental data (Figs. 14, 15 and 16), oil 2A had the thickest film as the temperature varies in comparison to oils 6E, 5A and 3B. Lubricant 2A has the highest viscosity of all the tested lubricants at all temperatures. Results for oil 2A had a thicker oil film thickness, and this trend was more pronounced in Fig. 14, at 50 oC. In Fig. 15 at 60 oC and in Fig. 16, at 68 -70 oC oil film thickness results are becoming
0 1 2 3 4 5 6 7
0 90 180 270 360
M in im u m O il fi lm T h ickn e ss (m icr o n s)
Crank Angle (deg)
600 rpm-50oC
Minimum Oil Film Thickness Variation
3B
6E
5A
even. And still, results with marginally thicker films are being produced for lubricant 2A. Table 2 shows the viscosity variation for the tested oils at 50, 60 and 70 oC.
3.4Friction Experiments
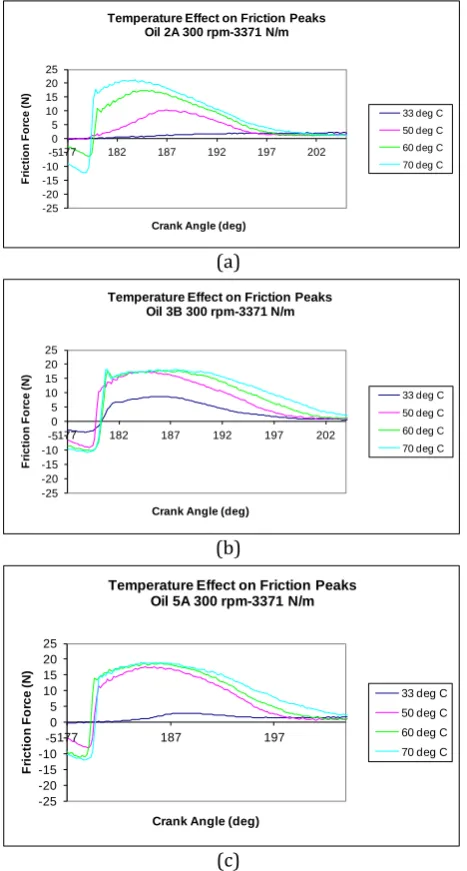
High friction peaks are noticed with viscosity variation due to high temperature. Testing includes lubricant 2A at maximum load test case, 3371 N/m and oils 3B and 5A that were tested accordingly at the same high load test case:
(a)
(b)
(c)
Fig. 17. High temperature friction results for oil 2A, 3B and 5A.
In the vicinity of the dead centers where flow reverses, for high temperature testing, friction
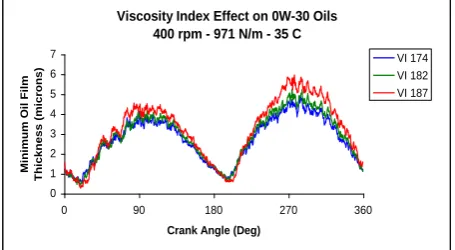
measurements are high respectively. Figures 17 show these high friction results. One can notice that the friction peaks during flow reversal show slight different behaviour for each oil. This finding can be highlighted as one of the outcomes of the parametric testing. Oil 3B reaches the highest friction value, at the highest temperature, at a quicker pace than oil 2A and 5A. Oil 3B having the highest viscosity index (Table 2) shows that particular behaviour. Viscosity values at 70 oC do not show a specific trend (Table 2). Highest viscosity index is combined with highest MOFT value for the same SAE oil grade as shown in Fig. 18. Different additives affect the viscosity index within a slight margin [2] that is evident in the MOFT graph.
Fig. 18. Viscosity index effect in minimum oil film thickness measurements (MOFT) [2].
The boundary and mixed lubrication regions at high loads and high temperatures are developing to a larger extent than the respective
region at ambient temperature. High
temperature is related to friction force increase when the interface between the liner surface and the piston ring is under boundary and mixed lubrication. Lubricant formulation plays an important role because at higher temperatures lubricant additives have a different interaction with contacting surfaces and in this manner the resulting effect of asperity contact is either increased or reduced. Moreover, the friction curves at the vicinity of the dead centers close to the stroke ends are changing direction suddenly, with the curves falling sharply compared to the ambient temperature results (33 oC). A closer look in the area where friction force reaches its peak shows the distance from BDC of the friction peaks for each tested oil. Figures 19 show the friction peaks for the area that corresponds to flow reversal close to BDC and Fig. 20 show the friction peaks distance from BDC.
Temperature Effect on Friction Peaks Oil 2A 300 rpm-3371 N/m
-25 -15 -5 5 15 25
0 100 200 300
Crank Angle (deg)
F
ri
c
ti
o
n
F
o
rc
e
(
N
)
33 deg C 50 deg C 60 deg C 70 deg C
Temperature Effect on Friction Peaks Oil 3B 300 rpm-3371 N/m
-25 -15 -5 5 15 25
0 90 180 270 360
Crank Angle (deg)
F
ri
c
ti
o
n
F
o
rc
e
(
N
)
33 deg C 50 deg C 60 deg C 70 deg C
Temperature Effect on Friction Peaks Oil 5A 300 rpm-3371 N/m
-25 -15 -5 5 15 25
0 90 180 270 360
Crank Angle (deg)
F
ri
c
ti
o
n
F
o
rc
e
(
N
)
33 deg C 50 deg C 60 deg C 70 deg C
Viscosity Index Effect on 0W-30 Oils 400 rpm - 971 N/m - 35 C
0 1 2 3 4 5 6 7
0 90 180 270 360
Crank Angle (Deg)
Minimu
m O
il Film
Th
ickness (m
icr
on
s)
(a)
(b)
(c)
Fig. 19. Temperature effect increase on friction peaks at BDC region: (a) Oil 2A 300 rpm, 3371 N/m load, (b) Oil 3B, 300 rpm, 3371 N/m load, (c) Oil 5A 300 rpm, 3371 N/m load.
Following the results in Fig. 19, the friction peaks distance from BDC according to temperature variation is depicted in Fig. 20. From Fig. 20 it can be derived that friction peaks move closer to BDC for lubricants 2A and 5A.
(a)
(b)
(c)
Fig. 20. Friction peaks distance from BDC:(a) Oil 2A 300 rpm, 3371 N/m load, (b) Oil 3B, 300 rpm, 3371 N/m load, (c) Oil 5A 300 rpm, 3371 N/m load.
Higher friction force is acquired from the data graphs when we move closer to the stroke ends. So, higher friction forces appear for higher loads, as expected, and the friction peaks are combined with a peak distance that is closer to the dead centers. Oil 3B, however, is following a complete different appearance for the friction peaks and the above mentioned interpretation for oils 5A and 2A is not being followed in the case of oil 3B. The absolute peak measurement remains almost the same for temperatures of 50, 60 and 70 oC and only for the ambient temperature the friction peak has a lower value (Figs. 19 and 20b). As the distance from BDC is concerned for oil 3B (Fig. 20b), it is not varied by any large margin and it does not give any indication of linearity reduction (for the higher temperatures) as in oils 5A and 2A (Figs. 20a and 20c). So, checking with the oil properties, oil 3B with its high VI, it is evident that the chemistry of lubricant (3B) plays its role in the peak friction values and their distance from BDC.
4. CONCLUSIONS
This study, that combines high temperature MOFT measurements and friction, produced results that show a directly comparable amount of decrease in the MOFT with rising oil temperature.
-25 -20 -15 -10 -5 0 5 10 15 20 25
177 182 187 192 197 202
F
ri
c
ti
o
n
F
o
rc
e
(
N
)
Crank Angle (deg)
Temperature Effect on Friction Peaks Oil 2A 300 rpm-3371 N/m
33 deg C 50 deg C 60 deg C 70 deg C
-25 -20 -15 -10 -5 0 5 10 15 20 25
177 182 187 192 197 202
F
ri
c
ti
o
n
F
o
rc
e
(
N
)
Crank Angle (deg)
Temperature Effect on Friction Peaks Oil 3B 300 rpm-3371 N/m
33 deg C 50 deg C 60 deg C 70 deg C
-25 -20 -15 -10 -5 0 5 10 15 20 25
177 187 197
F
ri
c
ti
o
n
F
o
rc
e
(
N
)
Crank Angle (deg)
Temperature Effect on Friction Peaks Oil 5A 300 rpm-3371 N/m
33 deg C
50 deg C
60 deg C
70 deg C
0 5 10 15 20 25
0 0.2 0.4 0.6 0.8 1
F
ri
c
ti
o
n
F
o
rc
e
(
N
)
Distance from BDC (mm)
Friction peaks distance from BDC - Temperature variation Oil 2A 300 rpm-3371 N/m
Friction peaks Linear f it
0 2 4 6 8 10 12 14 16 18 20
0.2 0.25 0.3 0.35 0.4
F
ri
c
ti
o
n
F
o
rc
e
(
N
)
Distance from BDC (mm)
Friction peaks distance from BDC - Temperature variation Oil 3B 300 rpm-3371 N/m
Friction peaks Linear f it
0 5 10 15 20 25
0.2 0.25 0.3 0.35 0.4 0.45
F
ri
c
ti
o
n
F
o
rc
e
(
N
)
Distance from BDC (mm)
Friction peaks distance from BDC - Temperature variation Oil 5A 300 rpm-3371 N/m
MOFT is strongly viscosity dependent and
temperature variation affects the
capacitance sensor error curves [2].
The significant role of lubricant chemistry in MOFT measurements is pronounced and in parallel is changing the MOFT high temperature characteristics of specific oil. For higher rpm parametric study, however, this effect is barely acknowledged compared to lower revs.
The parametric lubricant study showed that the squeeze film is partially affected for the
tested lubricants matrix. At high
temperatures and high loads one can find variations between the two dead centers, as the squeeze film is shifted towards the dead centers of the stroke for the considered test
cases. In this case, geometrical
considerations of the test rig and its dynamics play an important role as lubrication is affected, but since this asymmetry in MOFT is more pronounced (as in Figs. 11 and 12), the squeeze film changes its extend in microns (thickness) but not in terms of its location (crank angle).
Highest friction results were derived for high temperature testing. The extent of the boundary and mixed lubrication areas is larger when compared to ambient temperature. The boundary lubrication region is also connected with a sharp rise of the friction force.
Friction peak distance from BDC is moving further away from the dead center as temperature goes towards lower levels (oils 2A and 5A). Peak friction values also decrease. For oil 3B, the chemistry of the lubricant seems to be important as the findings for oils 5A and 2A are not verified.
The lubricants with the highest VI, produce increased oil film thickness results for oil blends with the same SAE grade [2].
Acknowledgement
The project was partly funded from Greek State Scholarship Foundation (S.S.F) and resources from the ongoing lubrication project at Imperial College, London, Thermofluids and Internal Combustion Engines Sections and at CITY University, London, Research Center for Energy and the Environment
with the major sponsor being CASTROL Lubricants. The author would like to thank gratefully Prof. C. Arcoumanis, (FREng) and the lab technicians at Imperial and City University. Many thanks are also due to my student Mr C. Lymeris for persuading me to promote and continue my research efforts from the fruitful past.
REFERENCES
[1] P. Dellis, LIF measurements in a single – ring test rig: Evidence of cavitation and the effect of different operating conditions and lubricants on
cavitation patterns and initiation, International
Journal of Engine Research, 2019, doi: 10.1177/1468087418819254
[2] P.S. Dellis, Piston-ring performance: limitations
from cavitation and friction, International
Journal of Structural Integrity, vol. 10, no. 3, pp. 304-324, 2019, doi: 10.1108/IJSI-09-2018-0053 [3] P.S. Dellis, Aspects of Lubrication in a
Reciprocating Single-ring Test Rig and Further Implementation to Engine Applications, Tribology in Industry, vol. 39, no. 2, pp. 260-269, 2017, doi: 10.24874/ti.2017.39.02.14
[4] A. Rastogi, R.K. Gupta, Effect of shear thinning on
cavitation in lubricant films, SAE International,
922286, 1992, doi: 10.4271/922286
[5] G. Stachowiak, A.W. Batchelor, Engineering
Tribology, United Kingdom:
Butterworth-Heinemann, Elsevier, 2000.
[6] O. Akalin, G.M. Newaz, Piston ring-cylinder bore friction modelling in mixed lubrication regime.
Part II: correlation with test bench data, Journal
of Tribology, vol. 123, iss. 1, pp. 219–223, 2001,
doi: 10.1115/1.1286338
[7] D.D. Joseph, Cavitation and the state of stress in a
flowing liquid, Journal of Fluid Mechanics, vol.
366, pp. 367–378, 1998, doi:
10.1017/S0022112098001530
[8] P. Dellis, Aspects of lubrication in piston cylinder
assemblies, PhD thesis, Imperial College
London, Department of Mechanical Engineering, London, 2005.
[9] P. Dellis, C. Arcoumanis, Cavitation development
in the lubricant film of the piston-ring assembly,
Proceedings of the Institution of Mechanical Engineers, Part J: Journal of Engineering Tribology, vol. 218, iss. 3, pp. 157–171, 2004,
doi: 10.1243/1350650041323340
[10]P.S. Dellis, Effect of friction force between piston rings and liner: a parametric study of speed, load, temperature, piston-ring curvature, and
Institution of Mechanical Engineers, Part J: Journal of Engineering Tribology, vol. 224, iss. 5, pp. 411– 426, 2010, doi: 10.1243/13506501JET727
[11]P. Dellis, C. Arcoumanis, A parametric study on oil film pressure measurements in a single
piston-ring configuration, International Journal of
Engine Research, vol. 14, iss. 2, pp. 122–137, 2013, doi: 10.1177/1468087412440540
[12]N. Grice, I. Sherrington, An Experimental Investigation Into the Lubrication of Piston Rings
in an Internal Combustion Engine: Oil Film
Thickness Trends, Film Stability and Cavitation,
SAE 930688, 1993.
[13]N.W. Bolander, B.D. Steenwyk, F. Sadeghi, G.R. Gerber, Lubrication regime transitions at the piston
ring–cylinder liner interface, Proceedings of the
![Fig. 2. Photo of the single-ring test rig [1].](https://thumb-us.123doks.com/thumbv2/123dok_us/9808579.1966754/3.595.309.540.585.779/fig-photo-single-ring-test-rig.webp)
![Fig. 3. (a) Top view photo of the sensors layout, and (b) 3D schematic of the capacitance measurement with the magnetic holder and the flat surface on top of the capacitor [2]](https://thumb-us.123doks.com/thumbv2/123dok_us/9808579.1966754/4.595.55.290.66.258/sensors-layout-schematic-capacitance-measurement-magnetic-surface-capacitor.webp)