Abstract—Multi Carrier Code Division Multiple Access
(MC-CDMA) is a promising technology for 4G wireless communication systems. Orthogonal Frequency Division Multiplexing (OFDM) and Multi Carrier Code Division Multiple Access (MC-CDMA), which convert frequency selective channel to several flat fading channels thereby eliminating ISI and in turn need of equalization. This dissertation mainly focusses on implementation of PTS technique to MC-CDMA scheme for downlink scenario. Also, a low complexity receiver is designed for the above scheme where the equalization is carried out in time domain basis. Also the proposed MC-CDMA with PTS scheme is compared with Single Input Single Output (SISO) MC-CDMA with PTS scheme in terms of Complementary Cumulative Distribution Function (CCDF) and Bit Error Rate (BER) performance. The simulation results verify that proposed MC-CDMA outperforms SISO MC-CDMA under fading conditions. Also as the no of users increase, CCDF performance improves and BER performance degrades.
Index Terms— Multi Carrier Code Division Multiple Access,
PTS, OFDM, SISO.
I. INTRODUCTION
Single carrier systems suffer from heavy Inter Symbol Interference (ISI). ISI occurs when the signal bandwidth is less than the coherence bandwidth or equivalently when the delay spread is greater than the symbol duration. To combat the problem of ISI multicarrier techniques have been proposed. Multicarrier techniques divide the whole bandwidth
into large no of narrow band orthogonal subcarriers [1, 2]. Thus the signal bandwidth becomes very less compared to the coherence bandwidth ensuring no ISI in time domain and flat fading in frequency domain. Multicarrier systems such as Orthogonal Frequency Division Multiplexing (OFDM) and Multi Carrier Code Division Multiple Access (MC-CDMA) are considered to be the promising technologies for 4G wireless communication systems [1, 2]. Fig. 1.1 explains the spectrum of multicarrier and single carrier systems. In single carriersystem the information symbols are loaded onto one subcarrier whereas in multicarrier system the information symbols are loaded onto multiple no of subcarriers.Recently, Code Division Multiple Access (CDMA) which is the basis of all 3G wireless communication system is a spread spectrum technique and has gained a lot of attention to support multimedia services in mobile radio communication. On the other hand, OFDM which is a multicarrier technique is considered to be the basis of all 4G wireless communication systems.
SHIV SHAKTI
International Journal in Multidisciplinary and
Academic Research (SSIJMAR)
Vol. 6, No. 4, August 2017 (ISSN 2278 – 5973)
PAPR Reduction Using PSO-GSA Tuned PTS
Techniques in MC-CDMA System
Renu Devi Jagtar Singh Ajay Kumar Jaiswal M.Tech, ECE Deptt., NCCE, HOD, ECE Deptt., NCCE Sr. Lecturer, ECE Deptt., NCCE Israna, Panipat, India Israna, Panipat, India Israna, Panipat, India
Fig. 1.1 Conventional spectrum of multicarrier and single carrier systems [19]
CDMA spreads the data symbol in frequency direction. The same chip will be transmitted on different subcarriers thus increasing the frequency diversity. MC-CDMApreferred to be used in downlink. Since downlink is synchronous we don’t have to pay attention to the autocorrelation properties of the spreading code. Simple Walsh-Hadamard (W-H) code can be used for spreading which has very good orthogonality property.MC-DS-CDMA spreads the data symbol in time direction after spreading thus increasing the time diversity. MC-DS-CDMA is used in uplink scenario. In uplink Pseudo Noise (PN) code is used since uplink transmission is asynchronous.Since MC-CDMA is a combination of CDMA and OFDM it takes advantage of both the schemes and inevitably has the same drawbacks [2]. MC-CDMA spreads the data with a particular spreading code in frequency direction thus increasing frequency diversity whereas MC-DS-CDMA spreads the data in time direction and MT-MC-DS-CDMA uses very high spreading factor [3].This dissertation mainly focusses on signal processing aspects of downlink multiuser MC-CDMA. Since the downlink (from Base Transceiver Station (BTS) to Mobile Station (MS)) is considered to be synchronous, orthogonal codes can be used for spreading since they reduce multiple access interference. Walsh-Hadamard (W-H) code [2] is used for spreading since they are easy to generate and they have very good orthogonality property.
II. PROPOSEDWORK
In our work as PAPR of OFDM has to be reduced. There are various methods available for this purpose, but from the literature review it has been clear that partial transmit sequence (PTS) is the most effective method. But in PTS too length of sub blocks considered and the weighted factor sequence data can change the reduction in PAPR and can show improvement. In our work focus is to set the weighted sequence such that PAPR settle to a minimum value. Bioinspired optimization algorithms helped in this.There are various algorithms available but every alogrithm if used alone suffers form some drawbacks and majority of them are suffered from premature convergence i.e in case of
multiobjective optimsations they skipped many points of iterations and can’t look for a minimum solution& fall into a local minima. The problems faced during OFDM are :
(i) The major negative aspect with OFDM is high Peak-to-
(ii) Average Power Ratio (PAPR). Due to high PAPR results in nonlinear distortion at a high power amplifier (HPA) and degradation of the bit error rate (BER). To handle these occasional large peaks, a high-power amplifier with linear characteristics is required.
Figure 2.1: Block diagram of conventional PTS (ii) There are various methods for reducing PSNR like selective mapping (SLM), partial transmit sequence (PTS) etc. mainly PTS is used for this purpose even it is a special case of SLM because of less complexity in PTS.
(iii) In PTS optimization of weighting factor is done so that PAPR is reduced. For optimization different techniques like ACO, PSO, etc. but these suffers for premature convergence of result.
Proposed Methodology
In this partial transmit sequence method is used which is discussed here. This method is based on phase shifting of sub-blocks of data and multiplication of data structure by random vectors. The main purpose behind this method is that the input data frame is divided into non-overlapping sub-blocks and each sub-block is phase shifted by constant factor to reduce PAPR. In the PTS technique, an input data block of N symbols is partitioned into disjoint sub-bocks. The subcarriers in each sub-block are weighted by phase factor for that sub-block. The main purpose behind this method is that the input data frame is divided into non-overlapping sub-blocks and each sub blocks.
1. Set all the phase factors b v for v=1:V, find PAPR of equation (3), and set it as PAPR_min.
2. Set the v=2.
3. Find PAPR of equation (3) with b v = -1.
Sub block partitioning
IFFT
IFF T
IFF T
+
4. If PAPR>PAPR_min, switch b v back to 1. Otherwise, update PAPR_min=PAPR.
5. If v<V, increment v by 1 and go to step 4.
We consider the PAPR as our objective function an specifically peak power only as PAPR is the ratio of peak to average power, so if peak power is reduced then automatically PAPR also reduces. Initially PSOGSA is executed as the main optimization technique. The agent’s initial positions are randomly chosen and these make the weighted factor of PTS. Steps of proposed algorithms are described as:
Step1. Initialize all initial parameters of OFDM to model it.
Step2. Generate the input bits and modulate them as per
the modulation instructed by user
Step3. Generate hadamard sequence or Walsh code and spread the modulated input with this code to provide the uniqueness to each user’s data.
Step4. Take the sum of these spreader sequences and partitioned it into sub blocks for PTS.
Step5. Take the inverse Fourier transform of these partitioned blocks and pass to proposed optimization being used.
PSOGSA Initialization
Step1. Initialize the random positions of particles in PSO.
Step2. Consider the searching space dimension as
number of total binary digits for bandwidth, energy and memory
Step3. Initialize the weighting parameters of PSO as 0.2 and 0.5.
Step4. Compare the fitness value of each particle with the previous best position of bacteria. If fitness function value is less for this new position than previous position then it will be assigned as new.
Step5. The present bets position is termed as current position of particle for PSO and output of fitness function is Local for the PSO.
GSA Starts here:
Step6. The current position selected in previous step is used to get the mass for each agent as per GSA algorithm. The minimum value of fitness function is selected as best and maximum as worst position and using the formulas, mass of each agent can be calculated as:
𝑚𝑖 𝑡 = 𝑓𝑖𝑡(𝑡) − 𝑤𝑜𝑟𝑠𝑡(𝑡) 𝑏𝑒𝑠𝑡 𝑡 − 𝑤𝑜𝑟𝑠𝑡(𝑡)
𝑀𝑖 𝑡 = 𝑚𝑖 𝑡 𝑚𝑗(𝑡)
𝑁 𝑗 =1
Gravitational force is calculated as:
𝐹𝑖𝑗𝑑 𝑡 = 𝐺 𝑡 . 𝑀 𝑝𝑖 𝑡 ×
𝑀𝑎𝑖 𝑡 𝑅𝑖𝑗 𝑡
+ 𝜀 . 𝑥𝑗𝑑 𝑡 − 𝑥 𝑖𝑑 𝑡
The formula is described in section 3.1.
Step7. This new velocity is the direction of particle in PSO is updated as
𝑛𝑒𝑤 𝑣𝑒𝑙𝑜𝑐𝑖𝑡𝑦
= 𝑜𝑙𝑑 𝑣𝑒𝑙𝑜𝑐𝑖𝑡𝑦 + 𝑐1 ∗ 𝑎𝑐𝑐𝑒𝑙𝑒𝑟𝑎𝑡𝑖𝑜𝑛 + 𝑐2(𝑔𝑏𝑒𝑠𝑡 − 𝑐𝑢𝑟𝑟𝑒𝑛𝑡 𝑝𝑜𝑠𝑖𝑡𝑖𝑜𝑛)
Here gbest is the global best position of particles in PSO and acceleration is calculated in GSA as
𝑎𝑖𝑑 𝑡 = 𝐹𝑖𝑑 𝑡 /𝑀𝑖𝑖(𝑡). GSA ends here
Step8. The final position of agents which is achieved either by matching the condition of power reduction or by reaching the maximum iterations.
Step9. Final positions of agents thus settled are
considered as the final weighted sequence of PTS algorithm and multiplied with input sub blocks and PAPR is calculated.
III. RESULTS
In our work we have proposed a hybrid evolutionary optimisation algorithm which is combination of PSO and GSA as discussed in pevious chapter. PSOGSA optimisation as decribed earlier to optimise the combination of PTS for minimisation of PAPR in MC-CDMA. The proposed work is implemented in MATLAB R 2013a. A lot of inbuilt functions in MATLAB makes the use easier and saves our time to build our code from scratch.So we can use that time in problem solution of research.
During the PSOGSA implementations we have to provide the input of number of agents, total number of iterations and range to the PSOGSA.m script. This gives the better results in PSOGSA.Some test functions are used hybrid algorithm with both the standard PSO and GSA algorithms. The values of these inputs are tabulated in table 3.1.
Table 3.1: input variables set in GSA optimization
Input Value
Total number of agents 10
Range [-1,1]
We have developed MC-CDMA communication system in MATLAB. So simulation parameters considered for this implemenatation are given in table 3.2.
Table 3.2: Simulation parameters of MC CDMA
Spreading codes of MC CDMA Walsh code
Modulaiton process QPSK,8PSK, 16PSK
Number of users in MCCDMA 4,8,10,12
Number of subcarriers 16,32,64
Length of sub blocks of PTS 4,6,8
No of bits for each user 10000
We have divided our work in four sub cases which are
Keeping the other factors constant at some value, only number of users are changed
1. Type of modulation varies
2. Subcarriers in MC-CDMA also affects the PAPR so it’s variation is also considered.
3. The size subblocks of PTS is also varied
Case I: no of users changes
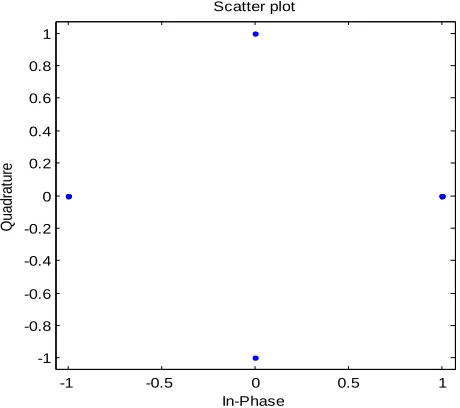
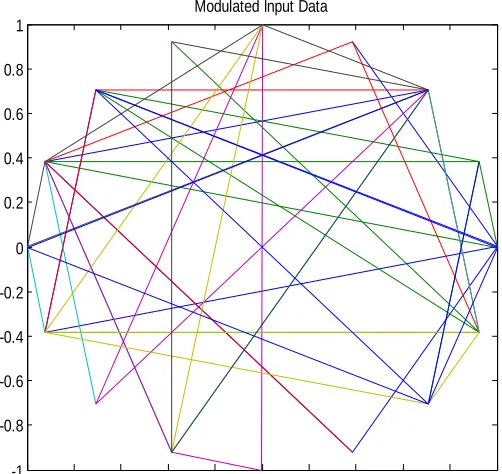
Initially 4 usres have been taken along with QPSK modulation, number of subcarrirers=8 and length of subblocks pf PTS is 4. Figure 3.3 shows the constellation map of modulated input of MC-CDMA by QPSK and scatter diagram of QPSK is shown in figure 3.4.
Figure 3.3: Constellation Map of 4-PSK Modulated Data
Figure 3.4: Scatter plot of QPSK modulation
The comparison plot for both optimization techniques in case of every unique no of users is shown in figure 3.5 for different number of sub blocks too.
Figure 3.5: PAPR vs. CCDF for different 8numbers of Users with different sub blocks length
As is seen from the figure with the increase in the number of users the PAPR is also increased, but if it is compared in case of each different number of users then PAPR reduces significantly by our proposed algorithm. Table 3.6 clearly proves our point.
Table 3.6: PAPR for proposed work and firefly-PTS for different number of users for 4 sub blocks
No of
Users
PAPR of Firefly-PTS(dB) PAPR of
PSOGSA-PTS(dB)
4 10.1740 9.7636
8 8.8413 9.0862
10 9.9402 9.6023
-1 -0.8 -0.6 -0.4 -0.2 0 0.2 0.4 0.6 0.8 1
-1 -0.8 -0.6 -0.4 -0.2 0 0.2 0.4 0.6 0.8 1
Modulated Input Data
-1 -0.5 0 0.5 1
-1 -0.8 -0.6 -0.4 -0.2 0 0.2 0.4 0.6 0.8 1
Q
u
a
d
ra
tu
re
In-Phase Scatter plot
2 3 4 5 6 7 8 9 10 11
10-3
10-2
10-1
100
PAPR0[dB]
C
C
D
F(
p
r[
P
A
P
R
>
P
A
P
R
0
])
CCDF vs PAPR plot for different number of sub-blocks
12 9.6967 9.6942
This table clears the point that our proposed algorithm improves the PAPR than firefly tuned PTS scheme.
Case II: when modulation is changed
In this case modulation type of MC- CDMA is changed which also changes the modulated input, number of users is kept fixed to 8 users, subcarriers are set to 8 and sub block length of PTS is 4.
(a): 8PSK scattering of modulated input
Figure 3.7: Scatter pattern of 16PSK modulated input data
Figure 3.8: PAPR vs. CCDF curve for 8PSK modulation schemes for different number of sub blocks
Below table 3.9 shows the final PAPR value for different modulation scheme which will provide a crisp comparison of PAPR improvement to firefly algorithm.
Table 3.9: PAPR for proposed work and firefly-PTS for different modulation schemes for 4 sub blocks
Modulation scheme
PAPR o1f Firefly-PTS(dB)
PAPR of PSOGSA-PTS(dB)
4 9.0341 9.6954
8 8.6511 10.0274
-1 -0.8 -0.6 -0.4 -0.2 0 0.2 0.4 0.6 0.8 1
-1 -0.8 -0.6 -0.4 -0.2 0 0.2 0.4 0.6 0.8 1
Modulated Input Data
-1 -0.8 -0.6 -0.4 -0.2 0 0.2 0.4 0.6 0.8 1 -1
-0.8 -0.6 -0.4 -0.2 0 0.2 0.4 0.6 0.8 1
Modulated Input Data
3 4 5 6 7 8 9 10
10-3
10-2
10-1
100
PAPR0[dB]
C
C
D
F(
p
r[
P
A
P
R
>
P
A
P
R
0
])
CCDF vs PAPR plot for different number of sub-blocks
16 9.0801 10.4332
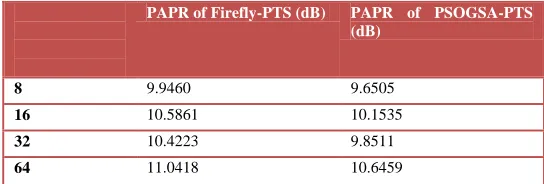
Case III: Number of sub carriers is varied
In 3rd case subcarriers of MC-CDMA are varied. These are basically the number of channels which are required for parallel transmission of data. In this case 8 users are considered along with QPSK modulation scheme and length of PTS sub blocks is taken 4. The comparison graph for different sub-blocks is shown in figure 3.10.
Figure 3.10: PAPR vs. CCDF for different number of subcarriers.
In this case, with the increase in number of subcarriers keeping all other factors constant, PAPR increases with number of sub carriers.
Table 3.11: PAPR for proposed work and firefly-PTS for different sub carriers for 4 sub blocks
PAPR of Firefly-PTS (dB) PAPR of PSOGSA-PTS
(dB)
8 9.9460 9.6505
16 10.5861 10.1535
32 10.4223 9.8511
64 11.0418 10.6459
Case 4: Length of PTS blocks are varied
In this case only length of sub blocks in PTS is changes and other conditions are same as previous discussed cases. The comparison curve for this case is shown in figure 3.12 below. The table and graph shows that our proposed scheme for PAPR improvement works well when length of sub-blocks of PTS increases.If length of sub block is taken 8 then improvement in PAPR is approx. 2 dBs Best improvement in CCDF is also visible in this case as slop of curve is less as compared to other cases.
Table 3.13: PAPR values for different subcarriers
Number of PTS sub-blocks
PAPR of Firefly-PTS
(dB)
PAPR of PSOGSA-PTS (dB)
4 12.1843 12.1843
6 11.2280 10.4671
8 11.8327 10.4878
Now at this stage where all possible cases are discussed, a collective representation of PAPR is required to get the parameters which gives best PAPR reduction. For this purpose a bar graph for all cases is itself which is shown in figure 5.10. This bar graph is only for PAPR using proposed method as PAPR always improved than PTS. From this figure it is concluded that at highest number of sub blocks of PTS the PAPR reduction is highest.
Figure 3.14: Bar graph for proposed scheme PAPR IV. CONCLUSION
MC-CDMA has been the promising technology for 4G wireless communication system. Since it is a combination of both OFDM and CDMA, it explores the advantages of both the schemes. MIMO integrated with multicarrier techniques can boost the data rate and the reliability of the link. Also by using multi antenna elements MIMO can achieve diversity which in turn will improve BER performance thus improving the reliability at the receiver. So hadamard coded MC-CDMA is a suitable candidate in this regard which can achieve speed, range and reliability simultaneously. But the problem with multicarrier technique is PAPR which is also the major drawback for MC-CDMA and restricts its application. High PAPR causes inter modulation products, increases the cost of the transmitter, and increases the complexity of the ADC. So PAPR must be reduced at any cost. In this dissertation we have assumed that the receiver has the knowledge about channel coefficients. This may not be possible in adverse situations. So receiver side channel estimation is essential for better reception of the signal. Also we have assumed that the side information bits are known at the receiver. This means that additional spectrum is used for transmission of these side information bits. This may lead to data loss if these bits are significant. So the future work will be to estimate the transmitted bits without using side information bits.
V. REFERENCES
4 5 6 7 8 9 10 11
10-3
10-2
10-1
100
PAPR0[dB]
C
C
D
F(
pr
[P
A
P
R
>
P
A
P
R
0]
)
CCDF vs PAPR plot for different number of sub-blocks
4 sub-blocks for PSO-GSA 4 sub-blocks for Firefly 6 sub-blocks for PSO-GSA 6 sub-blocks for firefly 8 sub-blocks for PSO-GSA 8 sub-blocks for firefly
0 5 10 15
[1]. B.Sarala and D.S.VenkateswaruluB.N.Bhandari,”Overview Of MC
CDMA PAPR Reduction Techniques” International Journal Of Distributed And Parallel Systems (IJDPS) Vol.3, No.2, March 2012
[2]. Sarala, B., D. S. Venkateswarulu, and B. N. Bhandari. "Overview
Of MC CDMA PAPR Reduction Techniques." International Journal of Distributed & Parallel Systems 3.2 (2012).
[3]. Ali AsgharParandoosh, JavadTaghipour and
VahidTabatabaVakili,”A Novel Particle Swarm Optimization For PAPR Reduction Of OFDM Systems”International Conference on Control Engineering and Communication Technology, IEEE, 2012.
[4]. Branislav M. Popovi´c,” Spreading Sequences for Multicarrier
CDMA Systems” IEEE Transactions On Communications, Vol. 47, No. 6, June 1999.
[5]. Ho-Lung Hung and Yung-FaHuang,”Peak To Average Power
Ratio Reduction Of Multicarrier Transmission Systems Using
Electromagnetism-Like Method” International Journal of
InnovativeComputing,Volume7, Number 5(A), May 2011.
[6]. JaswinderKaur, KomalArora,”Performance analysis of PAPR
reduction techninques for MC-CDMA system” International Journal of Scientific & Engineering Research, Volume 4, Issue 8, August-2013.
[7]. Jyh-HorngWen, Shu-Hong Lee, Yung-Fa Huang, and Ho-Lung
Hung,” Suboptimal PTS Algorithm Based on Particle Swarm Optimization Technique for PAPR Reduction in OFDM Systems” EURASIP Journal onWireless Communications and Networking Volume 2008.
[8]. Gagandeep Kaur1, RajbirKaur,”Comparative study of SLM and
PTS techniques for PAPR Reduction of an MC-CDMA system” IJERA, Vol. 2, Issue 4, July-August 2012.
[9]. Neha Gupta, GarimaSaini,”Performance Analysis of BFO for
PAPR Reduction in OFDM” International Journal of Soft Computing and Engineering (IJSCE) , Volume-2, Issue-5, November 2012.
[10].Devinder Kumar, Preeti Singh, JagetSingh,”Complexity Reduction
in PTS based OFDM System: A Survey” International Journal of Computer Applications Volume 69– No.13, May 2013.
[11].KanchanSingla, RajbirKaur,” Ant Colony Optimization Algorithm For PAPR Reduction In Multicarrier Code Division Multiple Access System” IJERA,Vol. 4, Issue 6( Version 5), June 2014PavaniSumala, R.Prasanth ,R.A.S.Bharadwaj.
[12].Qinghai Bai,”Analysis of Particle Swarm Optimization Algorithm”
Compuet& Information Science, Vol 3, No. 1, 2010.
[13].GagandeepKaur, RajbirKaur,”PAPR Reduction of an MC-CDMA System through PTS Technique using Suboptimal Combination Algorithm”IJERA Vol. 2, Issue4, July-August 2012.
[14].Mariano García-Otero, Luis Alberto Paredes-Hernández,”PAPR reduction in SFBC MIMO MC-CDMA systems via user reservation” EURASIP Journal on Advances in Signal Processing, 2011.
[15].Neha Gupta, GarimaSaini,” Performance Analysis of BFO for PAPR Reduction in OFDM” IJSCE, Volume-2, Issue-5, November 2012.
[16].R.Manjith, M.Suganthi,” A Sub-Optimal Pts Algorithm Based On Bacterial Foraging Optimization Technique For Papr Reduction In Mimo-Ofdm System” JATIT, Vol. 57 No.2, 2013.
[17].Zbynˇek FEDRA, Roman MARˇSA´LEK, Vladim´ırSˇEBESTA,”Chip Interleaving and its Optimization for PAPR Reduction in MC-CDMA” RADIOENGINEERING, VOL. 16, NO. 4, DECEMBER 2007.
[18].Sajjad A. Memon, A. W. Umrani, F. A. Umrani, and A. K. Baloch,” A Peak to Average Power Ratio Reduction of Multicarrier CDMA System Using Error Control Selective Mapping” Progress In Electromagnetics Research Symposium Proceedings, Marrakesh, Morocco, Mar., 2011.
![Fig. 1.1 Conventional spectrum of multicarrier and single carrier systems [19]](https://thumb-us.123doks.com/thumbv2/123dok_us/9901220.1977559/2.612.60.285.50.210/fig-conventional-spectrum-multicarrier-single-carrier-systems.webp)