http://www.sciencepublishinggroup.com/j/ijnrem doi: 10.11648/j.ijnrem.20180301.12
ISSN: 2575-3088 (Print); ISSN: 2575-3061 (Online)
Water Demand Simulation Using WEAP 21: A Case Study
of the Mara River Basin, Kenya
Osoro George Marcellus Metobwa
1, Khaldoon Abdalah Mourad
1, 2, Lars Ribbe
31
Pan African University Institute of Water and Energy Sciences (Including Climate Change), University of Tlemcen, Tlemcen, Algeria
2
Social Science Faculty, Center for Middle Eastern Studies, Lund University, Lund, Sweden
3
The Institute for Technology & Resources Management in the Tropics and Subtropics, University of Applied Sciences, Cologne, Germany
Email address:
[email protected] (K. A. Mourad)
To cite this article:
Osoro George Marcellus Metobwa, Khaldoon Abdalah Mourad, Lars Ribbe. Water Demand Simulation Using WEAP 21: A Case Study of the Mara River Basin, Kenya. International Journal of Natural Resource Ecology and Management. Vol. 3, No. 1, 2018, pp. 9-18. doi: 10.11648/j.ijnrem.20180301.12
Received: October 2, 2017; Accepted: December 26, 2017; Published: January 16, 2018
Abstract:
The competing water uses within the Mara River Basin MRB has increased water demand, which has affected the Mara river. In this paper, water resources and demands were modelled using Water Evaluation and Planning system (WEAP), by which different methods and strategies were assessed to mitigate the overuse practices from the Mara river. For this, water uses and resources in the basin were quantified and mapped in regard to their current and future statuses taking 2010 as a reference year for the simulation’ scenarios up to 2045. The Parameter Estimation Tool (PEST) was used to calibrate the model. The results showed that the total water demand within the basin under the reference scenario was 4.91 BCM, the demand dropped to 4.1 BCM under the ¨Demand Management Strategy DMS scenario and to 3.5 BCM under the Enhanced Policy Implementation and DMS scenario. The results also showed that the proposed DMS could increase water sustainability by reducing water demands at the basin.Keywords:
Demand Management, Mitigation, PEST, Sustainability, Policy Implementation1. Introduction
1.1. Study Area
Kenya has five main water basins; the rift valley, Tana, the Lake Victoria, Athi, and the Ewaso Ngyiro basin (Figure 1). Mara River Basin MRB, within the Lake Victoria basin, runs through 13,750 km2 area of South Western Kenya and North-Western Tanzania before entering Lake Victoria at the Musoma bay. Water resources in the Lake Victoria South catchment area that includes MRB has recently decreased due to population growth and the increase of socioeconomic activities [1]. MRB and its surrounding areas face a water shortage [2]. The basin experiences a bimodal rainfall pattern of wet and short rains. The maximum precipitations begin in mid-March to June with a crest in April while short precipitations occur between September and December. The
mean annual precipitation ranges from 500 mm in the south to around 1750 mm at the northern and the western parts of the basin. Based on satellite images, the forest cover has reduced from 752 km2 in 1973 to 493 km2 in 2000 [2]. The socioeconomic activities have converted some forest lands to agricultural and urban uses [3].
Recent studies showed that climate change, socioeconomic activities, population growth, water pollution and the huge water abstraction are the main challenges that altered the natural hydrologic regime of the Mara river [2, 4, 5, 6, 7, 8].
Figure 1. Nain water basins in Kenya. [10].
1.2. Modelling Using WEAP
WEAP is a user-friendly software tool that is developed by the Stockholm Environmental institute (SEI) to assist decision makers in managing water demand, water availability, waste generation and water costs and to evaluate water development and management options [11].
WEAP incorporates water supply in the context of demand-side management, and water quality and ecosystem
preservation and protection into a practical tool for water resources planning and policy analysis [12]. The model places demand-side issues such as water use patterns, equipment efficiencies, reuse strategies, costs, and water allocation schemes on an equal footing with supply-side themes such as stream flow, groundwater resources, reservoirs and water transfers [11, 13].
discharge and water demand and supply, which can give water planner a more comprehensive view of the broad range of factors that must be considered in managing water resources for present and future uses [12]. It can analyse a diverse range of issues such as climate variability, watershed conditions, anticipated demands, ecosystem needs, available infrastructures and operational objectives in a transparent manner [13].
Several studies have used WEAP for water allocation for various uses in different catchments in Kenya [6, 14, 15]. WEAP was used to assess water demand and supply in Syria till 2050. The results showed that possible regional conflicts affect water balance, while regional cooperation and using the best available technology can reduce water scarcity [16]. In Somalia, WEAP model was used to assess irrigation and competing water demands on the Juba and Shebelle river basin [17].
1.3. Problem Statement and Objectives
The high-water use for industrial, domestic and agricultural sectors in Mara region due to the lack of hydrological knowledge, unimplemented water rights and ignorance of the environmental water demands has decreased water quantity. Moreover, the need to satisfy water demands for both economic and social development in the basin has created conflicts due to the lack of equity in the allocation method and the permit system. The existing water allocation strategies and permit system have optimized the rate of water abstraction because they have largely relied on a “first come, first serve” approach, instead of determining maximum water use for ecological benefits. The increase in water demand and the lack of demand management measures will lead to a real clean water scarcity in the basin.
Therefore, the main goal of this paper is to assess and simulate water demands in the MRB to provide an in-depth knowledge on water demand (spatial- temporal), which will be the key for the implementation of water allocation policies by Water Resources Management Authority in Kenya (WRMA) and other governmental policies. By considering national water laws and policies, it will be possible to determine where the abstraction for consumptive purposes is allowed and the sections of the river that have deficits can be identified in advance. The scenarios will provide a base for a fruitful dialogue among interested stakeholders about various options for allocation of water resources and the possible trade-offs therein. This will also enhance the development of the governance mechanisms and will provide an opportunity to water managers and users to project and evaluate the impacts of different possible future trends and management strategies before implementing them.
2. Methods
The paper focuses on the abstractors with authorization, permits and illegal abstractors for domestic, industrial and commercial purposes. Both primary and secondary data was
collected in this study.
2.1. Water Demands in Mara River Basin
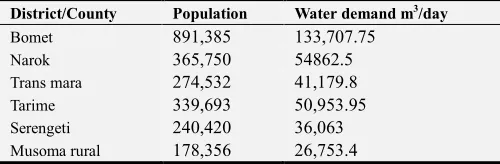
Domestic demand: Mara river provides the life to all activities and livelihoods within the basin. The population of the basin has grown from less than 300,000 people in 1989 to almost 1,000,000 people, according to the recent estimates. Previous studies estimated that more than 50% of MRB residents in Kenya collect water directly from the Mara River or its tributaries and 5% collect rain water while 20% get water from wells and springs for drinking purposes. Residents in cities like Bomet, Bureti and Narok satisfy their water needs almost from surface water sources [5]. On the Tanzanian side, the domestic water supply is assumed to be covered at 80% by surface water sources. The domestic demand was estimated by combining both the local and urban population based on the Kenya National bureau of statistics and the Tanzania national bureau of statistics (Table 1).
Table 1. Population within the MRB.
District/County Population Water demand m3/day
Bomet 891,385 133,707.75
Narok 365,750 54862.5
Trans mara 274,532 41,179.8
Tarime 339,693 50,953.95
Serengeti 240,420 36,063
Musoma rural 178,356 26,753.4
Agriculture demand: Irrigation is practiced in various parts of the basin at both small and large scales. The upper and lower areas of the basin are under household small cultivation practices, while the large-scale irrigation farms are distributed along the river. Water demand for irrigation was obtained from previous studies [5, 18]. The irrigation water demands were lumped together to estimate the total demand within the MRB.
Industrial demand: Mining is the main industry at MRB. There are two mining sites, the Buhemba and the North Mara Mines (NMM). Recent studies showed that the major industrial user in the basin is the NMM, 3200 m3/d with 60% recycling rate [6]. NMM also harvested overland flows during the rainy season [18]. According to the national agreement, NMM has an annual permit to withdraw 1.5 million m3. NMM does not abstract during the months of September and December due to low water levels. For this study water demand utilized was the maximum allowed by the permit.
Tourism demand: The number of tourists visiting the MRB has increased from 133,000 visitors in 1995 to 240,000 in 2004 in the Maasai Mara National Reserve and from 59,564 visitors in 1990 to 378,218 in 2002 in the Serengeti National Park. The main attraction is usually the annual wildebeest migration that begins during the dry season around June - July [2]. With the river flows already low, a combined increase of wildlife and tourists puts more strain on the limited waters in the river.
goats, camels, donkeys, pigs, chickens and bee hives
The population of domesticated animals within the MRB shows an increasing trend more specifically in cows and goats while sheep population showed a slight decline within the periods 1984,1998 and 2000. Table 2 presents the population of domestic animals in the Kenyan side in 2010. While Table 3 presents the population of livestock in the Tanzanian side in 2007 [7].
Table 2. Domestic animal population Kenyan side of the MRB.
Molo Narok north
Narok south
Trans
mara Bomet
Cattle 182243 255881 701889 459106 210855
Sheep 149906 529492 935757 184780 53060
Goats 37724 219394 510328 150496 82395
Camels 2 116 449 43 5
Donkeys 20208 38796 38934 20466 18363
Pigs 1789 3959 2275 1097 604
Chicken 439209 113328 172644 275347 364644
Bee hives 64052 19402 22730 22335 14807
Table 3. Livestock population in Tanzania part of MRB.
District Cattle Shoats Donkeys
Musoma 115573 56162 963
Serengeti 109307 117459 308
Tarime 84959 35082 253
The estimation of the water demand was based on [19], Table 4 presnts water requirements for domestic animals, while Table 5 presents water demands at the MRB per ditrict based on 2010.
Table 4. Daily Water requirements domestic animals.
Species Weight (KG) Daily drinking requirement (litres).
Zebu 350 16.4 25
Goat 30 2.0 5.0
Sheep 35 1.9 5.0
Donkey 120 12.4 15
Table 5. Water Demands per district in MRB.
District Water amount (m3/year)
Kenya Tanzanian
Bomet 1,658,409 Musoma 1,162,372
Molo 444,365 Serengeti 1,213,475
Narok South 5,276,540 Tarime 840,660.7
Trans Mara 1,473,985
Total 8,853,296 Total 3216508
Wildlife demand: The MRB economy is based on the wildlife. Mara river is the lifeline of living creatures in the basin as it’s the only source of water utilized especially during the dry season. [20] noted that the wildlife populations especially the herbivores are limited by water availability and forage mostly during the drought years. [2] postulated that 30% of the wildlife population will be wiped out if the Mara River was to run dry.
It’s also important to note that the seasonal migration of the wildlife contributes to the wildlife demand [7]. Earlier studies [2, 20] estimated that about two million heads of
wildlife move from the Serengeti plains towards the MMNR to drink water from the Mara river during the dry season. The migration is estimated to last four months. Because of the complex movement of the wild animals, previous studies estimated the wildlife demand all year around, the demand is split into two the annual migration demand and the resident demand which are then summed up to give an estimate of the wildlife demand [7, 21].
In this paper, wildlife demand calculation was adapted from studies done by [7], while the daily water requirements were modified from [22, 23], Table 6. Although the rates of water consumption differ per species, and the consumption is significantly correlated to body weight of each livestock [24].
Table 6. Wildlife water demands
Animal Population (Year
2000)
Individual daily water requirements (litres)
Buffalo 4733 31
Eland 1025 23
Elephant 989 150
Grant’s gazelle 13353 2.6
Thomson gazelle 32880 1
Maasai giraffe 2213 40
Impala 36929 2.5
Hartebeest 1295 5.5
Topi 6244 5
Warthog 1889 3.5
Waterbuck 143 9
Wildebeest 88256 7
Burchel zebra 43624 12
Recent quantitative studies showed that the available water cannot meet the competing sectoral demands due to the population growth and the environmental degradation [5, 7]. Therefore, the development of some mechanisms to ensure equitable distribution between man and nature is needed. This is only possible if the people attach value to the resource and identify possible trade-offs between the different users. Such initiatives will ensure the equitable management and give the priority to the sustainable ecological - social benefits by increasing water use efficiency, improving economic gains, mitigating hydrological variations and accommodated socio-political water rights.
2.2. Model Calibration and Validation
In the model, the current figures provide an actual picture of the situation hence it is viewed as a calibration step. The validation procedure was undertaken using the PEST routine within the WEAP system. PEST is a nonlinear parameter estimator and considered a unique calibration tool. The adjustment of sensitive parameters is done through trial and error to determine the best value for a specific parameter. PEST utilizes a nonlinear estimation technique; Gauss-Marquart-Levenberg method, which saves time by doing fewer model runs. The optimized value of any adjusted parameter is within a 95% confidence range.
validated using values from the years 1990 – 2000. The performance of the model was gauged using statistical means like Efficiency Coefficient of (EF), the Mean Error (ME) and the Mean Square Error (MSE).
The model efficiency coefficient EF of Nash and Sutcliffe (1970), is a dimensionless and a scaled version of the MSE for which the values range between 0 and 1 (1 for a perfect model), which gives a much clearer evaluation of the model results and performance.
2.3. The Development of the Scenarios
Scenario can be defined as a set of assumptions or alternative mechanisms (policies, pricing and demand management strategies) that form the basis for the projection. Scenarios are self-consistent story-lines of how a future system might evolve over time in a specific socio-economic condition and under a specific set of policy and technology conditions [12]. Through scenario analysis, the posed question” what if” is answered. Moreover, it enables the poser to change and test the limits of endurance within the set criterion. The reference scenario inherits the characteristics of the current situations on the ground. It enables a better understanding of the current trend. The other scenarios are variations of this actual picture in a bid to achieve the main goal.
The Reference Scenario represents the current actual situation is modelled and projected under current situations/conditions, which is in this paper the year 2010
taking into account the following assumptions:
1. Linear population growth rate 3% based on KNBS. 2. Urban and rural population lumped into one demand
node (human water needs). 3. Domestic consumption 150l/d 4. Water is priced per cubic metre.
The water allocation priority was based on the following criteria; domestic 1, livestock 2, agriculture 3, other uses 4, and reservoirs 5.
Based on the reference scenario, two scenarios were analysed to project different demand management strategies within the basin: 1) Enhanced water policies implementation and 2) increased DMS by utilization of measures such as; tiered water pricing, water efficient appliances, and monitoring increase.
3. Results and Discussion
3.1. Water Demand Projections
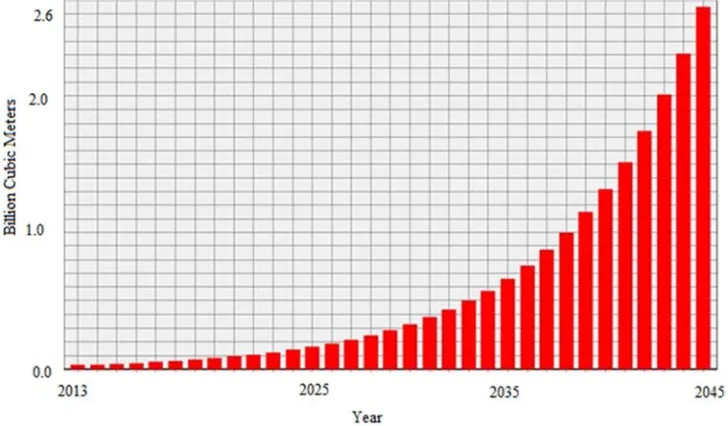
According to the reference scenario, water demand projections at all nodes show a remarkable increase in the abstraction levels in all the abstraction points. The major demand nodes for the water utilized from the analysis were human consumption and irrigation. The MRB is poised to experience a gradual increase in demand. The total demand on the Mara river is projected to rise from 0.03 BCM in the year 2013 to 2.65 BCM in the year 2045 (Figure 2).
Figure 2. Mara river Water Demand Projection.
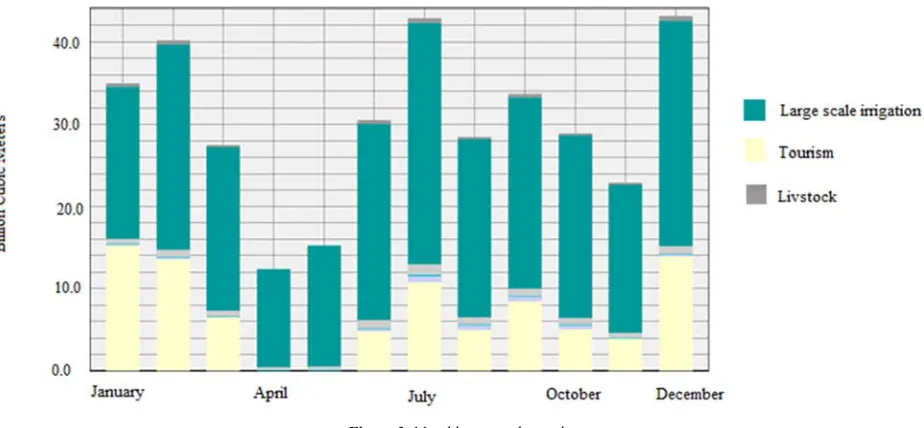
3.2. Unmet Demands and Demand Site Coverage
The unmet demands start in June for tourism and end in March. The unmet demands for the large-scale irrigation varies throughout the year. On average the demand site coverage is above 80%. This can be attributed to the adequate water budget within the MRB ensuring that sufficient water is available to meet its annual basin wide
Figure 3. Monthly unmet demands.
Figure 4 illustrates that water demands within the MRB are sufficiently met for all demand sites until the year 2028 but the significant effects are visible from the year 2033.
Figure 4. Annual unmet demands.
Figures 3 and 4 illustrate that all demand site needs are sufficiently met until the year 2028. External factors such as the population growth, climatic variability and land use change contribute to the sudden change.
3.3. Scenarios
3.3.1. The Enhanced Policies Implementation Scenario
Kenya and Tanzania have made strides into ensuring that there is portable water available to their residents within the basin but there are still some constrains. Previous studies [5] showed that on the Kenyan side more than 50% of the Kenyan population obtain their water directly from Mara
river, piped water penetration 14%, and 25% from springs and wells.
Figure 5. Demand site coverage in the Enhanced policy and DMS scenario.
Water demands simulation in the Enhanced policy implementation Scenario decreases from 75 MCM in 2010 to 50 MCM in 2045 (Figure 6). A gradual decline in water demand within the MRB. In the year 2010, the demand was
126.2 MCM across all demand nodes. This demand falls to 76.2 MCM in the year 2045, which presents a 2% annual demand decrease. On the other hand, the reference scenario shows an increasing trend in the total demand within the MRB.
Figure 6. Water demand coverage in Scenario 1.
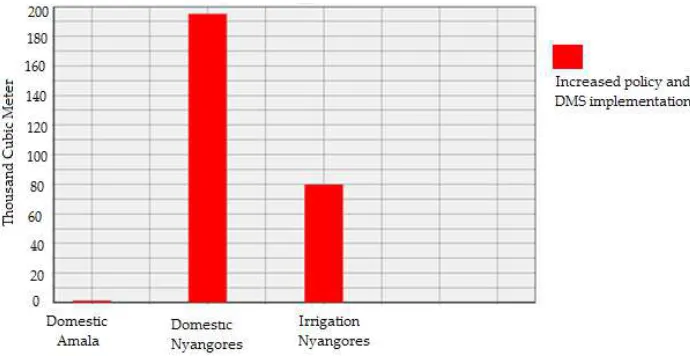
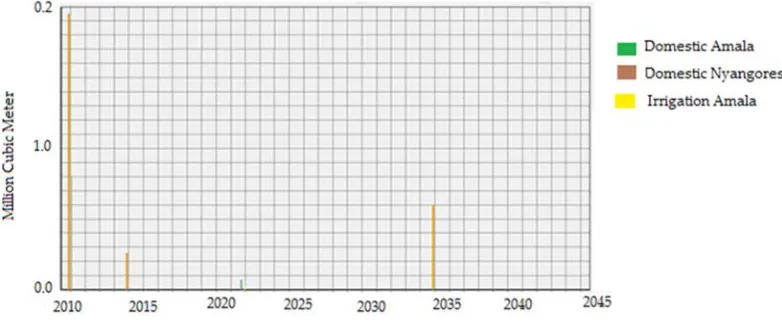
The Unmet demands. Anticipated factors such as population increase and land use change especially at the upper parts of the MRB, around the Mau forest zone (Nyangores and Amala catchments), have widen the gap between supply and demand. The MRB does not satisfy the domestic demand at Nyangores and Amala while the irrigation needs at the Nyangores sub catchment was not met. The unmet demands ranged from 196 MCM, while the
irrigation deficit is pegged at 80 thousand cubic metres (Figure 7). The analysis of the annual unmet demand shows that the demand is unmet during the years 2010 and 2022 and water demands are fully met during the rest of the years. This is in line with recent findings that peg a drought occurrence within the basin to a cycle of seven years. Tourism, large scale agriculture, wildlife and livestock water needs were sufficiently met in this scenario.
The reduction in the unmet demands within the Enhanced Policy scenario shows a great reduction in the volume of unmet water demands within the MRB compared with the refrence scenario. A case in point is that during the later part of the simulated period (2035- 2045), there is no net defict in unmet demands as illustrated in the reference scenario.
This scenario indicates that water stress in the MRB can be alleviated. This can be achieved through the utilisation of policy tools like catchment management strategies, water laws & acts, water recyling within the farms. For example the savings achieved through these initiatives have resulted in the divertion of 2641 MCM cubic metres pooled from other sectors to fully satisfy the unmet large scale irrigation needs in the year 2045.
3.3.2. Demand Management Strategies DMS Scenario
This scenario simulated the impact of enhancing the Demand Management Strategies on the reference scenario. Previous studies [2, 5]. showed that ensuing scarcity of water within the MRB requires equitable management and trade-offs between demand sectors. Therefore, in this scenario two items were simulated; The effect of water pricing in the MRB and the effect of water saving techniques. The following are the key assumptions in this scenario:
1. Constant and linear population growth rate at 3.0% in the basin
2. Increased penetration of water availability within the MRB
3. 45% of the population have alternative water supply sources such as harvested rain water and springs and wells.
4. Water pricing (based on a block tiered format).
The improvement in the implementation of water saving technologies implemented as a water saving technique includes;
1.The utilization of water efficient taps within the homes, luxury camps and lodges,
2.Enhanced water transmission networks (a key factor input for urban centres within the MRB)
3.Water reuse especially grey water reuse within institutions and facilities.
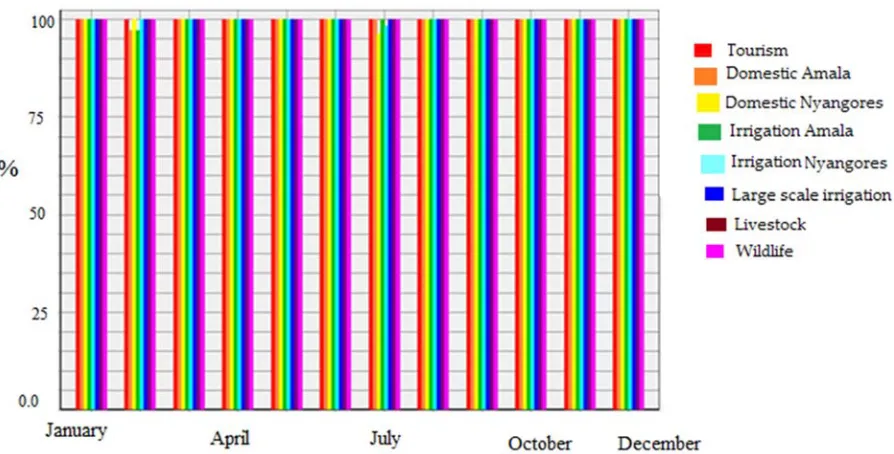
Demand site coverage. The coverage of all demand sites within this scenario was about 96% throughout the years. In terms of monthly coverage, all demand sites are sufficiently covered at 100%. However, the coverage is about 96% in February (Figure 8).
Figure 8. Demand coverage under DMS scenario.
Water demand and unmet demand
In the reference scenario, water demand in 2010, is about 126.2 MCM and it shows an increasing trend as it rises in value to 5,922 MCM in the year 2045. The increase within the period is an increase of 98% from the initial demand experienced during the base year. Conversely, under the increased DMS scenario, the initial demand in the year 2010 is 126.2 MCM, and dwindles down to 105.0 MCM in 2045.
Water demand shows a drastic decrease compared to the reference scenario. On a monthly average, February
Figure 9. Unmet annual demand.
Enhanced water transmission networks
Improving irrigation efficiency can be achieved through a proper maintenance of the intake structures, lining of the structures to reduce seepage, and utilization of more water efficient irrigation techniques such as drip irrigation instead of sprinkler irrigation. The effect of improving irrigation efficiencies reflects a reduction in water consumption from 3.8 MCM in the year 2010 to 2.9 MCM in the year 2045.
In the reference scenario, in the year 2010, 4.9 MCM is utilized for irrigation. However, 3.8 MCM is utilized in the DMS scenario, which presents a reduction of 1.1 MCM of water that is saved through the enhanced irrigation techniques.
Water pricing: In the reference scenario, water pricing is based on the current water use rates. All water abstractors pay a flat fee of 0.50 KES (Kenyan Shilling) per cubic metres upon abstraction. Recent studies within MRB [5] illustrated that water demands within the basin are price inelastic.
Block and Tiered Model
Water pricing affects all economic activities that take place within the MRB. Factors such as price elasticity of demand and water use rates were considered when simulating industry, agriculture and domestic consumption. On the other hand, increasing the charged price to sectors such as irrigation and industry will enhance water saving measures such as water reuse and rain water harvesting. The water Resources Management Authority charges about 0.50 KES per cubic meters. However, the water service providers charge a little higher and uses the block tier format.
Modelling water pricing within the scenario utilized the block tier format. The initial 10 cubic metres for irrigation and tourism/industrial demands were billed at a flat rate of 10 KES per metre. For every additional 2 cubic metres the price increases by 25 KES.
Water reuse: Water reuse rate for the demand nodes was modelled as follows; tourism 50%, irrigation 65%, domestic 60% and industrial 60%.
Table 7 presents an example of the projection of the tourism demand, which is modelled with the reuse option and showed the difference between the reference scenario and the increased DMS scenario.
Table 7. Comparison between Reference and Increased DMS on Tourism water demand.
Year Reference (MCM) Increased DMS (MCM)
2010 75 75
2015 125.6 74.9
2020 210.6 74.9
2025 352.9 74.9
2030 591.4 74.8
2035 991.3 74.8
2040 1,661.3 74.8
2045 2,784.3 74.8
Based on this analysis, the raft of interventions in the increased DMS strategy show a promise of a net positive impact on water resources management at the MRB.
4. Conclusions
Modelling water demands and resources at the MRB showed that the basin is projected to experience strain and pressure increases on its resources; water and land. This is attributed to the positive robust growth in settlements within the basin and conversion of more previously forest and range lands into farms. The proposed scenarios showed that enhancing policy implantation and raising awareness coupled with the demand management strategies will sustain water resources at all the time at the basin. However, water abstraction ceilings should be put on the water abstractors during the dry seasons to ensure that the gazette flow rates allocated to reserve flows are maintained for the sustainability of the river.
The lack of water storage facilities within the basin is a matter of urgency. A reservoir in the upper portion will enhance water security, while sand dams especially in the lower portions of the river will help in reducing water pollution that experienced in the area.
The utilisation of specific demand management strategies such as rain water harvesting at the household level, grey water reuse within the commercial facilities and use of artificial wetlands will help in the mitigation of the increasing water demand at MRB. Policy interventions targeting these strategies are needed.
References
[1] WRMA. Guidelines for Water Allocation. Kenya Water Resources Management Authority, 2009.
[2] Gereta, E.; Wolanski, E.;, Borner, M.; Serneels, S. Use of an ecohydrology model to predict the impact on the Serengeti ecosystem of deforestation, irrigation and the proposed Amala Weir Water Diversion Project in Kenya. Ecohydrology and Hydrology, 2002, 2, 135-142.
[3] Ottichilo, W. K., Leeuw, J.; Skidmore, A.; H. T, P.; Said, M. Population Trends of Large Non-Migratory Wild Herbivores and Livestock in the Masai Mara Ecosystem, Kenya, between 1977 and 1997. African Journal of Ecology, 2000, 38, 202-216.
[4] Dessu, S. B.; Melesse, A. M. Modelling the rainfall–runoff process of the Mara River basin using the Soil and Water Assessment Tool. Hydrological Processes, 2012, 26, 4038-4049.
[5] Dessu, S. B.; Melesse, A.; Bhat, M. Assessment of Water Resources Availability and Demand in the Mara River Basin, Kenya/Tanzania. Water Resources Management, 2014, 115, 104-114.
[6] Majule, A. E. Towards sustainable management of natural resources in the Mara river basin in Northeast Tanzania. Journal of Ecology and the Natural Environment, 2010, 2 (10), 213-224.
[7] Hoffman, C. M. Geospatial Mapping and Analysis of Water Availability-Demand-Use within the Mara River Basin,. Master of Science in Environmental Studies Thesis. Florida International University, Miami, Florida, 2007.
[8] Gereta, E.; Wolanski, E.; Makus, B.; Serneels. Use of hydrological model to predict the impacts on Serengeti ecosystems of deforestation, irrigation and the proposed Amala weir in Kenya, 2001, Retrieved from http//www.2gf.de/mitarbeiterbereich/pdf/AmalaStudy.pdf. [9] Mati, B. M.; Mutie, S.; Home, P.; Gadain, H.; Home, P.;
Mtalo, F. Impacts of land-use/cover changes on the hydrology of the transboundary Mara River Kenya/Tanzania. Lakes & Reservoirs: Research and Management, 2008, 13: 169-177. [10] Onjira P. Application of Remote sensing and Rainfall-Run-off
Inundation Modeling to Near-Real Time Flood Monitoring in Kenya, 2014. Thesis for: Disaster Mangement, Advisor: Dr. Takahiro Sayama, DOI: 10.13140/RG.2.1.1283.3046
[11] Van Loon, A.; Droogers, P. Water Evaluation and Planning System Kitui – Kenya, 2006.
[12] Sieber, J. M Purkey, D. Water Evaluation And Planning System (Weap ), User Guide. Stockholm Environment Institute, U. S. Center 11 Curtis Avenue 2011.
[13] Yates, D.; Sieber, J.; Purkey, D. WEAP21 – A Demand-, Priority-, and Preference-Driven Water Planning Model. International Water Resources Association. International Water Resources Association Water International, 2005, 5 (4), 487–500.
[14] Akivanga, E. M.; Otieno, F., Kipkorir, E.; Kibiiy, S. Impact of introducing reserve flows on abstractive uses in a water stressed catchment in Kenya: Application of WEAP 21 Model. International Journal of the Physical Sciences, 2010, 5 (16), 2441-2449.
[15] Jenkins, M., Marques, G. F., Lelo, F. K., & Miller, S. N. (May 15-19, 2005). WEAP as a Participatory Tool for Shared Vision Planning in the River Njoro Watershed in Kenya. World Water and Environmental Resources Congress. Anchorage, Alaska: ASCE.
[16] Mourad, K. M.; Alshihabi, O. Assessment of future Syrian water resources supply and demand by WEAP model. Hydrological Sciences Journal, 2016, 61 (2), 393-401 DOI: 10.1080/02626667.2014.999779.
[17] Sebhat, M. Y. Assessment of water demands for Juba and Shebelle rivers. Intergrated journal of British, 2 (2 MAR - APR), 16-29. Retrieved June 26/06/2016, 2016, from www.ijbritish.com.
[18] URT-NSCA-Mara. National Sample Census of Agriculture 2007/2008, Regional Report. Mara Region, Zanzibar, 2012, p. 187.
[19] King, J. Livestock water needs in pastoral Africa in relation to climate and forage. Nairobi: International Livestock Research Institute, 1983.
[20] Mduma, S. A.; Sinclair, A. R.; Hilborn, R. Food regulates the Serengeti wildebeest: a 40-year record. Journal of Animal. Ecology, 1999, 68: 1101–1122.
[21] The East African Community. Mara river basin-wide water allocation plan. The East African Community. The East African Community, 2013, Retrieved from http://hdl.handle.net/123456789/706.
[22] Du Toit, J. T. Wildlife harvesting guidelines for community based wildlife management: A Southern African perspective. Biodiversity and Conservation, 2002, 11, 1403-1416.
[23] UNEP. Mau Complex and Marmanet forests: Environmental and economic contributions Current state and trends. UNEP, NAIROBI, KENYA: United Nations Environmental Programme, 2008.
![Figure 1. Nain water basins in Kenya. [10].](https://thumb-us.123doks.com/thumbv2/123dok_us/9880454.1975528/2.595.82.512.73.632/figure-nain-water-basins-in-kenya.webp)