© Shiraz University
VALUED-BASED HVDC ENHANCEMENT ALTERNATIVE SELECTION
USING SYSTEM WELL-BEING ANALYSIS
*C. H. K. CHU
1, Z. LITIFU
2, 3* *AND B. KERMANSHAHI
21Bell Laboratories, Advanced Network Reliability and Security Assessment & Optimization 116 Persimmon Road, Holmdel, NJ 07733-3030, USA
2 Department of Electrical and Electronics, Tokyo University of Agriculture and Technology, 2-24-16, Nakamachi, Koganei-shi, Tokyo, Japan
3 Statistics and Information Department of Xinjiang Institute of Finance and Economics No. 15 South Beijing Road, Urumqi, Xinjiang, CHINA.
Email: [email protected]
Abstract– This paper presents a valued-based approach to select system enhancement alternatives based on the proposed system well-being analysis technique. The technique is used to rank the various system enhancement alternatives for an existing HVDC system. The system health states are classified according to three operating states namely, healthy, marginal and at risk. The reliability health indices with various improvement options are calculated for the HVDC transmission. The reliability health indices are then recalculated by including the outages of the generation. The options are then ranked according to their reliability benefits and their costs.
Keywords– Well-being, system reliability, system risk
1. INTRODUCTION
HVDC system is generally used to transmit electric power generation from a remote area to a more densely populated center. Due to the complexity and long distance involved, HVDC systems were designed with high availability. Historical statistics have shown that the availability of most of the HVDC systems in operation is well over 90%. This could, however, be further improved by reducing the failure rate and mean time to repair the equipment associated with such DC systems, by installing spare equipment such as spare converter transformers and reducing the restoration time etc..
The worldwide increased usage of the HVDC transmission system as a result of advances in HVDC technology, has prompted increasing needs for HVDC reliability evaluation techniques [1]. These techniques include: (1) independent analysis of individual sub-systems such as the rectifier/inverter subsystem, the transmission line and pole equipment subsystem and the AC filters subsystem etc., (2) contingency enumeration technique, (3) failure modes and effects analysis of the operational behavior of the HVDC system based on the event tree and minimal cut set approach. Various approaches were also proposed to evaluate the reliability of a composite power system including HVDC links. Value-based techniques that include both cost and benefit have also been proposed in the reliability analysis of HVDC systems.
HVDC reliability is generally expressed as the probability of the system to perform its intended function. The complement of this is called system risk and is defined as the probability that the system will fail to perform its basic design purpose. System designers and planners usually apply probabilistic techniques to design a HVDC system for an acceptable risk. A single numerical risk index such as the
loss of load expectation, however, is often difficult to interpret and understand. This difficulty can be alleviated by including deterministic criteria into the probabilistic evaluation and by additional indices such as the HVDC transmission well-being indices [2].
As the demand in the system grows, and more statistics are collected on the real-life performance of the network components within the HVDC system, it becomes necessary to enhance the system using various means. This paper addresses the issue of selecting the appropriate enhancement options taking into account their effects on the system reliability, and the cost to the utility. A valued-based approach using the system well-being indices was used to evaluate the reliability of the HVDC system and make the decision on enhancement selection.
The system under study transmits its generation from the major generation sites in the north to the populated areas in the south through two HVDC transmission lines. These transmission lines are approximately 600 miles in length and are on the same right-of-way. The northern power generation was approximately 55% of the total system generation and will be increased to approximately 70% after the addition of another generation station up north. The HVDC system therefore has become increasingly important in the economic growth and development of the province’s electric system. The actual HVDC operating data, including the reliability data, were modified before being used in this study.
2. HVDC TRANSMISSION WELL-BEING (HEALTH) FRAMEWORK
The concept of system well-being or system health combines deterministic criteria with probabilistic indices to monitor the system well-being. In the case of a power system, the system is classified into several operating states. These operating states were based on an EPRI report entitled “Composite-System Reliability Evaluation: Phase 1 - Scoping Study” (EL5290) [3]. This report provides a framework for the system operating states and associated definitions based on a composite system. This framework was introduced to evaluate the overall power system performances in terms of the degree to which reliability constraints are satisfied.
Similarly, the operation of a HVDC system can be classified into different operating states designated as normal, alert, restorative, emergency and extreme emergency states as shown in Fig. 1a. This framework was examined and redefined by Billinton et al to formulate the concept of system well-being [4, 5]. The states, normal, alert and emergency and extreme emergency, are regrouped into three operating states namely, healthy, marginal and at risk states respectively as shown in Fig. 1b. This framework has been successfully applied to generation system evaluation, composite system including HVDC transmission, and spinning reserve evaluation including operating constraints.
a) System healthy, marginal and at risk states
The basic technique evaluates the various conditions, which limit the load carrying capability of a HVDC transmission. The healthy state of the HVDC is defined as the state under which the HVDC transmission system has the ability to transfer the generation to the load point without overloading any equipment or violating any operating criteria. In this state, there is a sufficient margin or spare such that the loss of any single element will not result in a violation of operating limits. The marginal state is similar to the healthy state except that there is no longer sufficient margin to withstand certain single element outages. The system can be transferred from the healthy state to the marginal state by the outage of equipment or change in the operating conditions or vice versa by providing system improvement such as component spares.
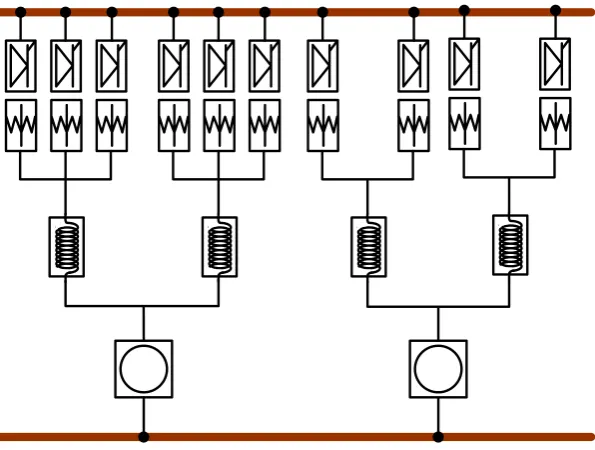
b) HVDC reliability diagram
A reliability diagram for the HVDC system is shown in Fig. 2a. or Fig. 2b. This diagram represents the functions of the HVDC components, rather than their actual physical connections. The HVDC is composed of three major parts namely, Valve Groups, Poles and Bipoles. The Valve Groups section includes all the valve groups and the converter transformers. The Pole section includes the pole station, smoothing reactors and the transmission lines. The Bipole section includes all other outages that may force the bipole into the “down” state. These may be tripping due to other AC generations or errors in AC & DC ground switching etc. All other component outages including the controlling device outage are embedded in the component outage. Bipole 1 consists of six valve groups each with two converter transformers. These valve groups were solid-state Thyristor valves. There are four smoothing reactors in each pole. Bipole 2 consists of four Thyristor valve groups each with four converter transformers. There are 2 smoothing reactors in each pole. Spare converter transformers and smoothing reactors are scheduled for both Bipole 1 and Bipole 2. Bipoles 1 and 2 have the capability to operate in parallel when either DC line is out of service.
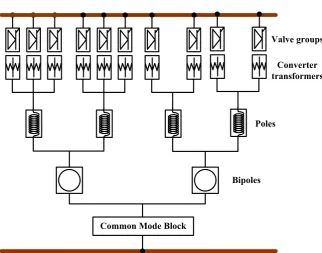
Common mode outages are modeled by a functional block in series with the network model. Both Bipoles 1 and 2 will be disconnected under common mode outage situation. The forced outage rate for the common mode outages is calculated based on the frequency and possible repair duration determined by the Transmission Line Design Department statistics collected for the HVDC system.
Valve groups
Converter transformers
Poles
Bipoles
Common Mode Block
Fig. 2b. HVDC reliability diagram (including common mode failures)
c) HVDC system health performance indices
In order to reduce the number of possible contingencies, the well-being indices for the HVDC transmission system were calculated using a hybrid approach which utilized the principle of series and parallel reduction techniques. The risk state probability, Pr, is determined by summing the probabilities for all the states that
result in a violation of the criteria or operating limits. The healthy state probability, Ph, is calculated by
selecting the contingencies related to the healthy state according to the healthy state definition. The marginal state probability, Pm, can then be determined by the following relationship:
) (
1 h r
m P P
P = − + (1)
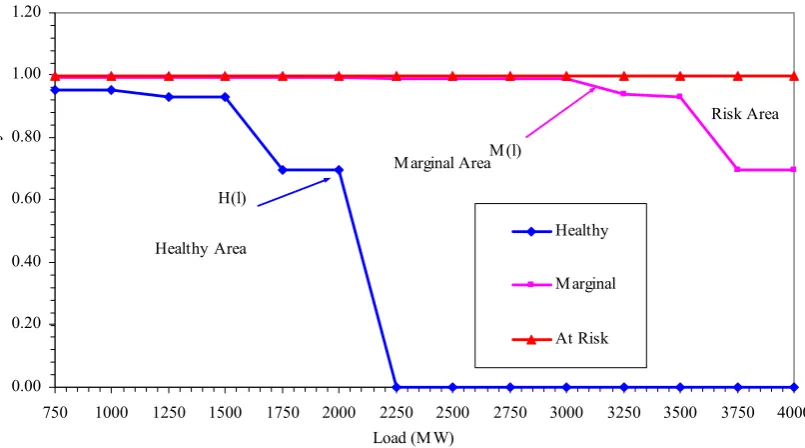
Figure 3 shows the well-being area diagram of a HVDC transmission system. This diagram helps to clarify the concept of system well-being. Up to two simultaneous HVDC component outages are considered. The probability of having three or more simultaneous HVDC element outages is very small and is included in the at risk state because when this happens, the system will most likely be in the at risk state. The diagram shows the three state probabilities of all the possible system contingencies. For a given load level, the probabilities associated with the healthy, marginal and risk states can be determined.
The area under the system healthy curve is defined as the system healthy area. The expected system healthy area, Eh, can be determined by performing integration on the system healthy curve. Similarly, the
expected marginal and risk areas, Em and Er, can be evaluated by the following equations:
∫
= max
0 ) ( L
h H l dl
E (2)
∫
∫
−= max
0 max
0
) ( )
( L
L
m M l dl H l dl
E (3)
∫
−
= max
0
max ()
L
r L M l dl
E (4)
System Well-Being Area Diagram 0.00 0.20 0.40 0.60 0.80 1.00 1.20
750 1000 1250 1500 1750 2000 2250 2500 2750 3000 3250 3500 3750 4000 Load (M W)
St at e P roba bi li t y Healthy Marginal At Risk H(l) Healthy Area Marginal Area Risk Area M(l)
Fig. 3. System Well-Being results
Two performance indices, the expected total performance index (βt), and the expected healthy
performance index (βh), are defined to reflect the ability of the system to transfer power. The expected
total performance index can be determined by adding the healthy area to the marginal area (areas in which there is no violation of operation constraints or criteria) and normalized by the maximum load as follows [2]: max max max max
1
)
(
)
(
L
E
L
E
L
L
E
E
h m r rt
=
−
−
=
+
=
β
(5)The expected total performance index, however, does not reflect the degree of health of the HVDC system. As the equation indicates, it is calculated based on Erwhich reflects the risk area. This index does
not provide any information on the individual healthy and marginal areas and therefore does not provide any information on the degree of system well-being. The system health of the HVDC system can be represented by the expected healthy performance index βh, given in Eq. (6):
max L
Eh
h =
β (6)
3. STUDY RESULTS
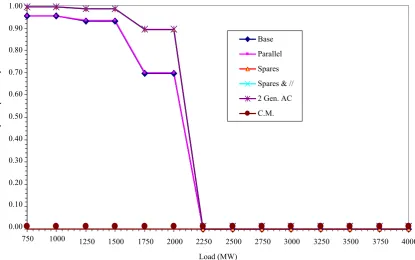
Several options were available for the HVDC system enhancement; each of these will provide a different level of reliability and costs. The six options that were available are listed below and the results are presented in Figs. 5a, 5b and 5c:
1. Case 1: Existing HVDC system (Base Case – without any enhancement). 2. Case 2: Add parallel operation.
3. Case 3: Provide spares for the converter transformers and smoothing reactors.
4. Case 4: Add parallel operation and provide spares for converter transformers and smoothing reactors. 5. Case 5: Case 4 plus transferring 2 generating units onto the AC system.
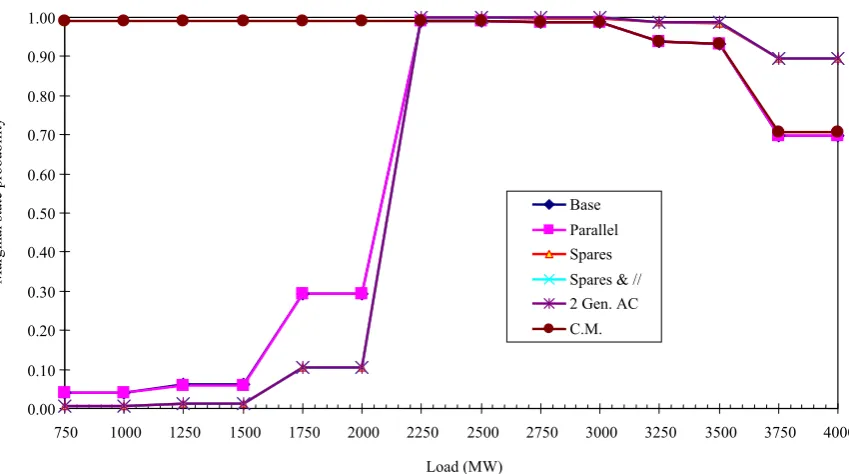
Table 1a and Table 1b show the results for all six cases. Case 6 is not an enhancement, as it deals only with the impact of common mode outage to the HVDC system. However, transferring two generating units onto the AC system, i.e. Case 5, can alleviate the adverse impact due to the common mode outage of the Bipoles. Figure 4 shows the three system well-being state probabilities for Case 1, and Figs. 5a, 5b and 5c show the system Healthy State Probability, System Marginal State Probability, and system at risk state probability of the HVDC system for all six cases in graphical form.
Table 1a. System well-being indices for the HVDC transmission system
Transfer
Cap. (MW) Healthy Marginal Risk Marginal Risk Marginal Risk
4000 0 0.6979 0.3021 0.6984 0.3016 0.8937 0.1063
3750 0 0.6979 0.3021 0.6984 0.3016 0.8937 0.1063
3500 0 0.9315 0.0685 0.9322 0.0678 0.9861 0.0139
3250 0 0.9385 0.0615 0.9391 0.0609 0.9872 0.0128
3000 0 0.9873 0.0127 0.988 0.012 0.9981 0.0019
2750 0 0.9873 0.0127 0.988 0.012 0.9981 0.0019
2500 0 0.9906 0.0094 0.9913 0.0087 0.9985 0.0015
2250 0 0.9907 0.0093 0.9914 0.0086 0.9986 0.0014
2000 0.6979 0.2939 0.0083 0.2935 0.0082 0.1058 0.0004
1750 0.6979 0.2939 0.0083 0.2935 0.0082 0.1058 0.0004
1500 0.9315 0.0603 0.0082 0.0597 0.0081 0.0136 0.0004
1250 0.9315 0.0603 0.0082 0.0597 0.0081 0.0135 0.0004
1000 0.9524 0.0394 0.0081 0.0387 0.0081 0.0059 0.0004
750 0.9524 0.0394 0.0081 0.0387 0.0081 0.0059 0.0004
βt βh
0.9564 0.9568 0.9877
0.4716 0.4719 0.5145
0.9531 0.9937 0.9531 0.9937 0.9322 0.9861 0.9322 0.9861 0.6984 0.8937 0.6984 0.8937 0 0 0 0 0 0 0 0 0 0 0 0 0 0 0 0
Base Case with Parallel Operation
Healthy Healthy
with CT & SR Spares
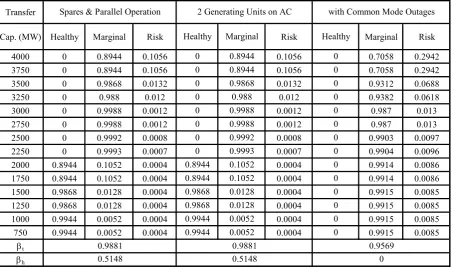
Table 1b. System well-being indices for the HVDC transmission system (continued)
Transfer
Cap. (MW) Healthy Marginal Risk Risk Marginal Risk
4000 0 0.8944 0.1056 0.1056 0.7058 0.2942
3750 0 0.8944 0.1056 0.1056 0.7058 0.2942
3500 0 0.9868 0.0132 0.0132 0.9312 0.0688
3250 0 0.988 0.012 0.012 0.9382 0.0618
3000 0 0.9988 0.0012 0.0012 0.987 0.013
2750 0 0.9988 0.0012 0.0012 0.987 0.013
2500 0 0.9992 0.0008 0.0008 0.9903 0.0097
2250 0 0.9993 0.0007 0.0007 0.9904 0.0096
2000 0.8944 0.1052 0.0004 0.0004 0.9914 0.0086
1750 0.8944 0.1052 0.0004 0.0004 0.9914 0.0086
1500 0.9868 0.0128 0.0004 0.0004 0.9915 0.0085
1250 0.9868 0.0128 0.0004 0.0004 0.9915 0.0085
1000 0.9944 0.0052 0.0004 0.0004 0.9915 0.0085
750 0.9944 0.0052 0.0004 0.0004 0.9915 0.0085
βt βh
0.9881 0.9881 0.9569
0.5148 0.5148 0
0.9944 0.0052 0
0.9944 0.0052 0
0.9868 0.0128 0
0.9868 0.0128 0
0.8944 0.1052 0
0.8944 0.1052 0
0 0.9992 0
0 0.9993 0
0 0.9988 0
0 0.9988 0
0 0.9868 0
0 0.988 0
0 0.8944 0
0 0.8944 0
Healthy Marginal Healthy
0.00 0.20 0.40 0.60 0.80 1.00 1.20
750 1000 1250 1500 1750 2000 2250 2500 2750 3000 3250 3500 3750 4000 Transfer Capability (MW)
-0.04 0.01 0.06 0.11 0.16 0.21 0.26 0.31
Healthy Marginal Risk
Ri
sk
st
at
e
pr
ob
abi
li
ty
Sta
te Pr
oba
bi
li
ty
of h
eal
th
y a
nd m
arg
in
Fig. 4. System well-being indices for the HVDC system (case 1)
0.00 0.10 0.20 0.30 0.40 0.50 0.60 0.70 0.80 0.90 1.00
750 1000 1250 1500 1750 2000 2250 2500 2750 3000 3250 3500 3750 4000
Load (MW)
Healthy state probability
Base Parallel Spares Spares & // 2 Gen. AC C.M.
0.00 0.10 0.20 0.30 0.40 0.50 0.60 0.70 0.80 0.90 1.00
750 1000 1250 1500 1750 2000 2250 2500 2750 3000 3250 3500 3750 4000
Load (MW)
Marginal state
probability
Base Parallel Spares Spares & // 2 Gen. AC C.M.
Fig. 5b. System marginal state probabilities for the HVDC transmission system
0.00 0.05 0.10 0.15 0.20 0.25 0.30 0.35
750 1000 1250 1500 1750 2000 2250 2500 2750 3000 3250 3500 3750 4000
Load (MW)
R
is
k S
ta
te
P
roba
bi
li
ty
Base Parallel Spares Spares & // 2 Gen. AC C.M.
Fig. 5c. System risk state probabilities for the HVDC transmission system
a) System well-being indices for the HVDC transmission system
state. As the load increases above 3500 MW, the marginal index starts to decrease and the risk index increases because more contingencies are moved from the marginal states into the at risk states.
Since the system well-being indices represent the probabilities of the HVDC system performing its function at various load transfer levels, unlike the loss of load expectation which does not indicate the severity of the outages, the reduction or improvement in the load transfer capability is shown. It also shows the comfort level under which the system is operating, i.e. it provides an indication of how close to the “at risk” state the system is operating. As the load increases, the system will be mostly operating in the “at risk” state.
Up to two simultaneous HVDC component outages are assumed in this study in order to reduce the number of possible contingencies. The system is assumed to be operating in the “at risk” state when a higher order of simultaneous outages occurs. The expected total performance, βt, of the HVDC is 0.9564
and the expected healthy performance index, βh, is 0.4716. The complement of the total performance
index reflects the risk of the system, and the expected healthy performance index reflects the degree of system well-being and can be considered as valuable criteria in HVDC transmission system planning. In order to select the best enhancement option for the best value, the impact of all the enhancement options were investigated and compared. A discussion is provided below.
b) Impact of system enhancements on the HVDC system well-being indices
This section illustrates how system enhancements such as providing spare converter transformers and smoothing reactors improve the HVDC system health and how factors such as common mode outages degrade the HVDC system health.
1. Impact of parallel operation on the HVDC system well-being indices: At the time the HVDC system was designed, the capacity of the HVDC lines were selected to withstand the total load transmission of the HVDC system. This design was selected in order to provide the ability for the bipoles to operate in parallel in the event of a DC line failure. Table 1a and Table 1b, as well as Figs. 5a, 5b and 5c, show that having the ability to operate the bipoles in parallel in the event of a DC line failure improves the system health slightly. Both probabilities of system healthy and marginal states are increased. The effect of parallel operation is to reduce the down time of the bipole DC line. Since the probability of having the DC line outage is quite small compared to other components such as the valve group and the transformer, the ability to parallel the DC lines in the event of a DC line outage, therefore, does not improve the performance indices significantly.
2. Impact of spares on the HVDC system well-being indices: The provision of spare converter transformers and smoothing reactors for both Bipoles 1 and 2 should improve the transfer capabilities of the bipoles. The spares reduce the forced outage rates of both components by approximately eight times. Table 1a and 1b, as well as Figs. 5a, 5b and 5c, confirm this expectation.
Adding spare converter transformers and smoothing reactors increases the probabilities of being in the comfort zone and more contingencies which reside in marginal states are shifted to the healthy states. At a load of 2000 MW, there is a close to 30% increase in the system healthy index. The expected total system performance index increases by 3.3%, and the expected healthy performance index, by about 9%.
The combined effect of having spares and parallel operation seems to be additive. The major contribution of improvement comes from the spares because of the higher outage rates for the converter transformers and the smoothing reactors.
transfer capability of the HVDC transmission. The removal of the generating units from the DC system is assumed to affect only the total system generation to be transferred through the HVDC to the south and will not affect the operation of the HVDC network. The possibility of changes in reactive power support on the HVDC system, as a result of transferring the generating unit onto the AC system, is not considered in this study.
The transfer of generating units onto the AC will, however, affect the HVDC system performance indices when the outages of the generating units are considered. This impact will be discussed in a later section.
4. Impact of common mode outages on the HVDC system well-being indices: Since the DC lines for both Bipoles 1 and 2 are on the same right of way, they are both subject to the common mode outages possibly caused by summer tornadoes or strong wind and winter ice storms. Although the probability of having a common mode failure is small, the impact, shown from previous natural disaster history, can be very severe.
Table 1a and 1b as well as Figure 5a, 5b and 5c show that, while the common mode outage does not increase the system risk index significantly due to the small probability of occurrence, it does affect the system operating states significantly. When common mode outages are considered, the system is always operating at the marginal state. This means that the system cannot tolerate any loss of elements in the HVDC system without loss of load even at very low load level. It can be concluded that the load carrying capability of the system decreases considerably due to possible common mode failures. Similar to that of the base case, the expected total system performance is 0.9569, but the system is no longer able to operate in the healthy state. This also demonstrates that examining the “loss of load” or the “at risk” state only is insufficient, as the results do not show any significant increase in the risk, and neither does it indicate that the system is now operating very close to disaster state.
c) HVDC system well-being performance index including generation outages
The function of this HVDC transmission system is to deliver the generation from the north to the south where most of the population is located. The performance of the system therefore is not only dependent on the HVDC transmission system itself, but also on the available generation to be delivered to the south. All the study results so far reflect the overall transmission capability of the HVDC transmission system under all loading conditions and have not included the possible outages of the generating units.
The northern generation consists of a total of 3500 MW of generation installed in three main locations. This study assumes up to four simultaneous generator outages since 99.99% of the possible generation states will be covered under this assumption. The probability of having five or more simultaneous generator outages is very small and is therefore negligible. The result is a set of overall northern generation and HVDC transmission performance indices as shown in Table 2.
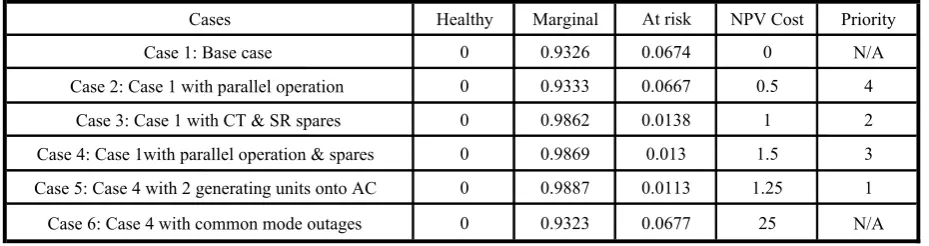
Table 2. Summary of the northern generation and HVDC transmission system well-being indices
Cases Healthy Marginal At risk NPV Cost Priority
Case 1: Base case 0 0.9326 0.0674 0 N/A
The HVDC system is always working under the marginal states. The improvements due to system enhancements are reflected in the change in the marginal state probabilities. The effect of transferring two generating units onto the AC system is now reflected in the system state indices since the analysis includes both generation and HVDC transmission outages. As noted previously, Case 6 is not a HVDC enhancement, but reflects the negative impact of common mode failure on the HVDC system. The effect of having Bipoles common mode outage is that it nullifies practically any HVDC enhancement benefits that are implemented. However, if two generating units are transferred onto the AC system, i.e. Case 5, the effect is that the “at risk” state is significantly reduced, i.e. from 0.0677 to 0.0113 and the marginal state increases from 0.9323 to 0.9887. In other words, Case 5 also provides a solution to alleviate the impact of common mode outages.
Table 2 summarizes the System well-being indices for each case and its associated NPV Capital and Operating cost (normalized by the CT & SR spare costs). The normalized NPV value for Case 6 was calculated based on the total amount of damages/repairs needed to be recovered from a severe tornado that happened previously. The preferred order of enhancement based on the improvement to the system reliability and the associated cost is shown in Table 2. Cases 3-5 all improve the marginal states from about 0.93 to 0.98 (reduces the at risk state by the same amount), it would seem that Case 3 would be the best option as the normalized NPV cost is the lowest. However, as was mentioned previously, these benefits would be nullified if a common mode outage occurs. By adding a small amount of cost, the system is also protected against the common mode outage of the Bipoles. Case 5, though slightly higher in NPV cost, would therefore be the best choice among all of these options.
The usefulness of the System well-being indices can be further illustrated by looking at the results without the generation outages. Some of the failure modes may simply push the system states from healthy to marginal and do not significantly affect the “at risk” state. This will not be reflected in the loss of load indices we usually calculate. As a result, the system well-being indices provide more relevant reliability information for decision making by system designers, planners, and management.
4. CONCLUSION
The increased utilization of HVDC transmission systems around the world has created the need for more comprehensive procedures to evaluate the reliability of this system. An approach proposed by Billinton et al. is presented in this report. This technique extends the conventional approaches to HVDC system reliability evaluation. The overall system performance is classified into three operating states designated as healthy, marginal and at risk. The load carrying capability of an HVDC transmission system can be considered based on the system healthy, marginal and at risk probabilities.
The conventional loss of load method provides information on the risk of having loss of load. It does not, however, indicate how close the system is being operated towards the loss of load situation. The system well-being indices provide this additional information. This technique has been applied in this paper in conjunction with a value-based approach in selecting the most appropriate HVDC enhancement options.
REFERENCES
1. Billinton, R., Aboreshaid, S. & Fotuhi-Firuzabad, M. (1997). Diagnosing the health of bulk generation and HVDC transmission systems. IEEE Trans. on Power System, Vol. 12, No. 4.
2. Billinton, R., Aboreshaid, S. & Fotuhi-Firuzabad, M. (1997). Well-being analysis for HVDC transmission systems. IEEE Trans. on Power System, Vol. 12, No. 2.
3. Final Report, Electrical Power Research Institute (1987). Composite-system reliability evaluation: Phase 1 – scoping study. Tech. Report EPRI EL-5290, Project 2581-1.
4. Billinton, R., Fotuhi-Firuzabad, M. & Aboreshaid, S. (1995). An approach to evaluating system well-being in engineering reliability applications. Journal of Reliability Engineering and System Safety, Vol. 50, No. 1. 5. Billinton, R., Fotuhi-Firuzabad, M. & Aboreshaid, S. (1997). Power system health analysis. Journal of
Reliability Engineering and System Safety, Vol. 55, No. 1.