Vol. 2, No. 3, pp. 197-206, July (2019)
A Comparison of Fuzzy and Brain Emotional
Learning-Based Intelligent Control Approaches for
a Full Bridge DC-DC Converter
Reza Keramat
1, Mohammad Hosein Ershadi
†,2, and Shahrokh Shojaeian
31,2,3
Department of Electrical Engineering, Khomeinishahr Branch, Islamic Azad University, Khomeinishahr/Isfahan, Iran
In this paper, a Brain Emotional Learning-Based Intelligent Controller (BELBIC) and a fuzzy controller were used to control the output voltage of a full bridge DC-DC converter. The converter was presented by its state space averaged model assuming that it operates in a continuous conduction mode (CCM). A comparison was also made between the results. The effectiveness of control approaches was demonstrated by the uncertainty of system parameters and acceptable load variations. The performance of the BEBLIC and fuzzy controller in controlling the output voltage of the full bridge DC-DC converter was satisfactory. Since these controllers are not designed to reduce error to zero, it is not possible to claim that the error rate is precisely zero. Compared to the fuzzy controller, the BELBIC showed negligible overshoots and fluctuations. Both controllers reached stabilization almost at once. It can, therefore, be concluded that the BELBIC outperforms the fuzzy controller Given the uncertainty of the system parameters (including inductance, capacitance, and input voltage and acceptable variations of load).
Article Info
Keywords:
BELBIC, DC-DC converter, Fuzzy controller, Robustness Article History:
Received 2018-07-19 Accepted 2019-01-06
I.
I
NTRODUCTIONDue to the rapid advancement of power electronics in the recent decays, modern control approaches have needed to be developed accordingly. Since the controller of a linear power supply is in the active mode, its efficiency in high powers is less than 50%. The size of linear power supplies is large owing to the large dimensions of transformers and the need for large heat sinks because of high energy dissipation of switches.
In switched mode power supplies, because the frequency is high, the transformer size can be decreased. In these power supplies, the switches operate in the saturated or threshold point and thus their dissipation is modest. Accordingly,
linear power supplies have been replaced by switched-mode power supplies in many applications over time [1]. A full bridge DC-DC converter operates in the switched mode. The performance of this converter and its state space averaged model are discussed in section II.
Based on Brain Emotional Learning-Based Intelligent Controller (BELBIC) there exist a few adjustable parameters to achieve the desired solution. In [2-10], BELBIC was used to control electric drivers or power systems.
In the present study, BELBIC was used to control a full bridge DC-DC converter and the results were compared to the results of a fuzzy controller.
After a brief review of the performance of DC-DC converters and their state space averaged model sectionII, BELBIC and fuzzy controller are described in section III and IV respectively. Section V discusses the results obtained by BELBIC and fuzzy controllers. Moreover, a comparison is also made between the system parameters and load variations of these two controllers under uncertain conditions.
A B S T R A C T
†Corresponding Author:ershadi@iaukhsh.ac.ir Tel: +98-3133660011,
converter. The circuit up transformer (with D3, and D4), and switches
-V
signal. The switching frequency is equal to the carrier signal frequency. When
the command signal turn
the command signal is zero and turned
the switches
all four switches are off, load current keeps cycling through rectifiers. The duration of this process is
the period of switching and
half cycle of the switching period, the switch pair
and in the second half cycle of the switching period, the switch pair
switches as well as the periodic signal and constant signals
Vcontrol
II.
FULL
Fig. 1 shows the circuit diagram of a full bridge DC converter. The circuit
up transformer (with D3, and D4), and
switches are created by comparing the constant signals
Vcontrol and Vcontrol
signal. The switching frequency is equal to the carrier signal frequency. When
the command signal turn
the command signal is zero and turned off.
Fig. 1. The c
Moreover, when the switches T3 and
all four switches are off, load current keeps cycling through rectifiers. The duration of this process is
the period of switching and
half cycle of the switching period, the switch pair
and in the second half cycle of the switching period, the switch pair T1 and
The command pulse signals reaching
switches as well as the periodic signal and constant signals
Vcontrol and –Vcontrol
Fig. 2. The command signals, periodic signals and constant signals for controlling
FULL
BRIDGE
DC
Fig. 1 shows the circuit diagram of a full bridge DC converter. The circuit is composed of a
up transformer (with a ratio of n:1), a diode bridge (D1, D2, D3, and D4), and a LC filter.
are created by comparing the constant signals
control with a high
signal. The switching frequency is equal to the carrier signal frequency. When Vcontrol is smaller than the periodic signal, the command signal turns T1 and
the command signal is zero and
The circuit schematic of the full bridge DC converter
Moreover, when –Vcontrol is larger than the periodic signal, 3 and T4 are on, otherwise they are off. When all four switches are off, load current keeps cycling through rectifiers. The duration of this process is
the period of switching and d
half cycle of the switching period, the switch pair
and in the second half cycle of the switching period, the 1 and T2 are off respectively [11
The command pulse signals reaching
switches as well as the periodic signal and constant signals
control are shown in Fig. 2.
ommand signals, periodic signals and constant signals for controlling
DC-DC
CONVERTER
Fig. 1 shows the circuit diagram of a full bridge DC is composed of a high frequency step
ratio of n:1), a diode bridge (D1, D2, LC filter. The command
are created by comparing the constant signals with a high-frequency periodic carrier signal. The switching frequency is equal to the carrier signal is smaller than the periodic signal,
1 and T2 switches on. Otherwise, the command signal is zero and T1 and T2 switches are
ircuit schematic of the full bridge DC converter[11]
is larger than the periodic signal, 4 are on, otherwise they are off. When all four switches are off, load current keeps cycling through rectifiers. The duration of this process is 0.5Ts
is the duty cycle. In the first half cycle of the switching period, the switch pair
and in the second half cycle of the switching period, the 2 are off respectively
[11-The command pulse signals reaching T1, T
switches as well as the periodic signal and constant signals are shown in Fig. 2.
ommand signals, periodic signals and constant signals for controlling the switches [11]
CONVERTER
Fig. 1 shows the circuit diagram of a full bridge DC-DC high frequency step-ratio of n:1), a diode bridge (D1, D2,
command signals of the are created by comparing the constant signals
periodic carrier signal. The switching frequency is equal to the carrier signal is smaller than the periodic signal,
2 switches on. Otherwise, 2 switches are
ircuit schematic of the full bridge DC-DC
is larger than the periodic signal, 4 are on, otherwise they are off. When all four switches are off, load current keeps cycling through
-d.Ts .Here Ts is is the duty cycle. In the first half cycle of the switching period, the switch pair T3 and T4 and in the second half cycle of the switching period, the
12].
T2, T3 and T4 switches as well as the periodic signal and constant signals
ommand signals, periodic signals and constant [11]
DC - ratio of n:1), a diode bridge (D1, D2, of the are created by comparing the constant signals
periodic carrier signal. The switching frequency is equal to the carrier signal is smaller than the periodic signal, 2 switches on. Otherwise, 2 switches are
is larger than the periodic signal, 4 are on, otherwise they are off. When all four switches are off, load current keeps cycling through is is the duty cycle. In the first 4 and in the second half cycle of the switching period, the
4 switches as well as the periodic signal and constant signals
III.
It is assumed 1
Conduction Mode (CCM). 2
In each duty half modes:
Duty Mode 1:
During the time
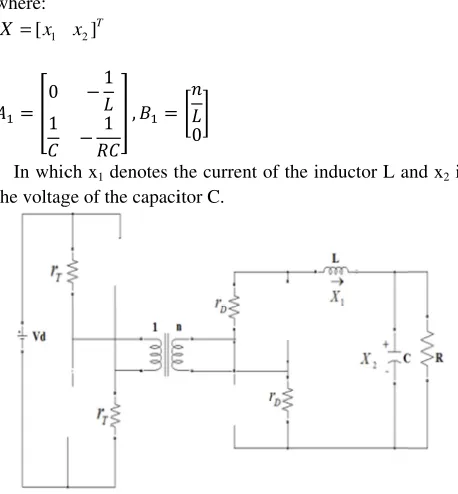
transferred to the load via the transformer and two diodes. The circuit schematic of this mode is depicted in Fig. 3. In this mode, with KVL and KCL shown in
converter state space equations can be obtained
1 2
nV L x x x C x
X& A X B V
where:
1 2
[ ]
X = x x
0 1
In which
the voltage of the capacitor C.
Duty Mode 2:
In this mode, all switches are off and
cycling via rectifiers. The circuit schematic for this mode is shown in Fig. 4. In this mode, with KVL and KCL shown in Eq.(4) and (5), the converter state space equations can be obtained as
0
1 2
x C x
= +
= +
X& =A X+B V
where:
FULL
BRIDGE
STATE
SPACE
It is assumed that:
1. the converter operates in the Continuous
Conduction Mode (CCM).
2. the transformer, diodes, and switches are
In each duty half-cycle, the converter can be shown in two
Duty Mode 1:
During the time T1 and
transferred to the load via the transformer and two diodes. The circuit schematic of this mode is depicted in Fig. 3. In this mode, with KVL and KCL shown in
converter state space equations can be obtained
1 2
2
1 2
nV L x x
d
x
x C x
R
= +
= +
&
&
1. 1. d
X& =A X+B V
1 2
[ ]T
X x x
1 1 ,
In which x1 denotes the
voltage of the capacitor C.
Fig. 3. The circuit schematic for duty mode 1
Duty Mode 2:
In this mode, all switches are off and
cycling via rectifiers. The circuit schematic for this mode is shown in Fig. 4. In this mode, with KVL and KCL shown in 4) and (5), the converter state space equations can be obtained as Eq.(6).
1 2
2
1 2
L x x
x
x C x
R
= +
= +
&
&
2. 2. d
X& =A X+B V
BRIDGE
DC-DC
SPACE
AVERAGED
he converter operates in the Continuous Conduction Mode (CCM).
he transformer, diodes, and switches are cycle, the converter can be shown in two
1 and T2 switches are on and
transferred to the load via the transformer and two diodes. The circuit schematic of this mode is depicted in Fig. 3. In this mode, with KVL and KCL shown in
converter state space equations can be obtained
1 2
nV L x x
. . d
X A X B V
0
the current of the inductor L and x voltage of the capacitor C.
ircuit schematic for duty mode 1
In this mode, all switches are off and
cycling via rectifiers. The circuit schematic for this mode is shown in Fig. 4. In this mode, with KVL and KCL shown in 4) and (5), the converter state space equations can be
d
X A X B V
DC
CONVERTER
AVERAGED
MODEL
he converter operates in the Continuous
he transformer, diodes, and switches are cycle, the converter can be shown in two
switches are on and power is transferred to the load via the transformer and two diodes. The circuit schematic of this mode is depicted in Fig. 3. In this mode, with KVL and KCL shown in Eq.(1) and (2), the converter state space equations can be obtained as Eq.
current of the inductor L and x
ircuit schematic for duty mode 1
In this mode, all switches are off and the load current keeps cycling via rectifiers. The circuit schematic for this mode is shown in Fig. 4. In this mode, with KVL and KCL shown in 4) and (5), the converter state space equations can be
CONVERTER
MODEL
he converter operates in the Continuous
he transformer, diodes, and switches are ideal. cycle, the converter can be shown in two
power is transferred to the load via the transformer and two diodes. The circuit schematic of this mode is depicted in Fig. 3. In (1) and (2), the
Eq.(3).
(1) (2) (3)
current of the inductor L and x2 is
load current keeps cycling via rectifiers. The circuit schematic for this mode is shown in Fig. 4. In this mode, with KVL and KCL shown in 4) and (5), the converter state space equations can be
A the
model of the converter described in [12] and [13], the final full bridge DC
be obtained as follow
(BELBIC) is a learning com model includes
orbitofrontal, and thalamus shown in Fig. 5 [14].
,
Fig. 4.
Since the second half
A1 and B1 can be used for the period 2dT
the period (1-2d)T
model of the converter described in [12] and [13], the final full bridge DC-DC converter state space averaged model be obtained as follow
. .
. o
X A X B V V C X
= + = & where:
. 2
. 2
IV.
BRAIN
The Brain Emotional Learning (BELBIC) is a
learning computational model of the mammals model includes
orbitofrontal, and thalamus shown in Fig. 5 [14].
0 0
Fig. 4. The circuit of duty mode 2
Since the second half-cycle is similar to the can be used for the period 2dT
2d)Ts. According to the state space averaged
model of the converter described in [12] and [13], the final DC converter state space averaged model be obtained as follows:
. . d
X = A X+B V
. 1 2
. 1 2
BRAIN
EMOTIONAL
COMPUTATIONAL
The Brain Emotional Learning
(BELBIC) is a control algorithm based on the emotional putational model of the mammals
model includes an amygdala,
orbitofrontal, and thalamus shown in Fig. 5 [14].
ircuit of duty mode 2
cycle is similar to the can be used for the period 2dTs and A
. According to the state space averaged model of the converter described in [12] and [13], the final
DC converter state space averaged model
0 1 2 0
EMOTIONAL
LEARNING
COMPUTATIONAL
MODEL
The Brain Emotional Learning-Based Intelligent Controller control algorithm based on the emotional putational model of the mammals
amygdala, a sensory cortex, orbitofrontal, and thalamus shown in Fig. 5 [14].
ircuit of duty mode 2
first half-cycle, and A2 and B2 for
. According to the state space averaged model of the converter described in [12] and [13], the final DC converter state space averaged model can
(7) (8) 1 1
LEARNING
MODEL
Based Intelligent Controller control algorithm based on the emotional putational model of the mammals brains. This sensory cortex, an orbitofrontal, and thalamus shown in Fig. 5 [14].
cycle, for . According to the state space averaged model of the converter described in [12] and [13], the final can
Based Intelligent Controller control algorithm based on the emotional brains. This an
Fig. 5. The b
The amygdala and orbitofrontal cortex have a grid structure in the computational model. There is a node in the amygdala and orbitofrontal context for
There is also a node in the amygdala for thalamus stimulus. The input to these no
inputs [15].
The outputs of the nodes in the amygdala and orbitofrontal cortex are obtained
j j j
j j j
A V S O W S
= =
where,
sensory input. Variations of are calculated
the learning coefficients of the amygdala and orbitofrontal cortex and
j j j
j j j j
V S A
W S A O R
∆ = −
∆ = − −
As seen, it is not possible to reduce
to say, learned information is not forgotten through the amygdala. In fact, forgetting or prevention is carried out in the orbitofrontal cortex. The output of the node in the amygdala is a stimulus originating from
obtained by by Eq.(14) [14]:
th j
A S
E A O A
=
= − +
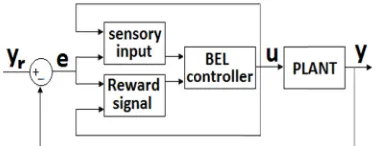
Fig. 6 shows the system control block diagram using BELBIC.
inputs S are as presented
The brain emotional learning computational model
The amygdala and orbitofrontal cortex have a grid structure in the computational model. There is a node in the amygdala and orbitofrontal context for
There is also a node in the amygdala for thalamus stimulus. The input to these nodes is equal to the maximum amount of inputs [15].
The outputs of the nodes in the amygdala and orbitofrontal cortex are obtained by Eq.
. .
j j j
j j j
A V S O W S
= =
here, V and W are the weights of nodes, and sensory input. Variations of
are calculated by Eq. (1
the learning coefficients of the amygdala and orbitofrontal cortex and R is the sensory signal.
. .max(0 , R )
. .( )
j j j
j j j j
i i
V S A
W S A O R
α
β
∆ = −
∆ =
∑
−∑
−As seen, it is not possible to reduce
to say, learned information is not forgotten through the amygdala. In fact, forgetting or prevention is carried out in the orbitofrontal cortex. The output of the node in the amygdala is a stimulus originating from
obtained by Eq. (13). Finally, the model output is calculated (14) [14]:
max( )
th j
j j th
i i
A S
E A O A
=
=
∑
−∑
+Fig. 6 shows the system control block diagram using BELBIC. The functions of emotional signal R and sensory inputs S are as presented
rain emotional learning computational model
The amygdala and orbitofrontal cortex have a grid structure in the computational model. There is a node in the amygdala and orbitofrontal context for
There is also a node in the amygdala for thalamus stimulus. des is equal to the maximum amount of
The outputs of the nodes in the amygdala and orbitofrontal by Eq. (9) and (10):
are the weights of nodes, and
sensory input. Variations of V and W in the learning process (10) and (11), where
the learning coefficients of the amygdala and orbitofrontal is the sensory signal.
. .max(0 , R )
. .( )
j j j
i
j j j j
i i
V S A
W S A O R
∆ = −
∆ = − −
∑
∑
∑
As seen, it is not possible to reduce the
to say, learned information is not forgotten through the amygdala. In fact, forgetting or prevention is carried out in the orbitofrontal cortex. The output of the node in the amygdala is a stimulus originating from
(13). Finally, the model output is calculated
j j th
E=
∑
A −∑
O +AFig. 6 shows the system control block diagram using unctions of emotional signal R and sensory inputs S are as presented in Eq. (15) and (16), respectively.
rain emotional learning computational model
The amygdala and orbitofrontal cortex have a grid structure in the computational model. There is a node in the amygdala and orbitofrontal context for sensory stimulus. There is also a node in the amygdala for thalamus stimulus. des is equal to the maximum amount of
The outputs of the nodes in the amygdala and orbitofrontal (9) and (10):
are the weights of nodes, and S
in the learning process ), where α and
the learning coefficients of the amygdala and orbitofrontal
. .max(0 , R )
. .( )
j j j
W S A O R
∑
the values of Aj. That is to say, learned information is not forgotten through the amygdala. In fact, forgetting or prevention is carried out in the orbitofrontal cortex. The output of the node in the amygdala is a stimulus originating from the thalamus. It is (13). Finally, the model output is calculated
Fig. 6 shows the system control block diagram using unctions of emotional signal R and sensory (15) and (16), respectively.
rain emotional learning computational model [14]
The amygdala and orbitofrontal cortex have a grid structure in the computational model. There is a node in the sensory stimulus. There is also a node in the amygdala for thalamus stimulus. des is equal to the maximum amount of
The outputs of the nodes in the amygdala and orbitofrontal
(9) (10)
Sj is the in the learning process and β are
the learning coefficients of the amygdala and orbitofrontal
(11) (12)
. That is to say, learned information is not forgotten through the amygdala. In fact, forgetting or prevention is carried out in the orbitofrontal cortex. The output of the node in the thalamus. It is (13). Finally, the model output is calculated
(13) (14)
controller output, respectively. In this paper, the sensory input and emotional signal are defined
similar to a conventional PI controller. K
determined for the settling time adjustment and K responsible for smoothing the system response. Also, K and K
two sources. One of the sources is the experts, who define their knowledge of the system using the natural language. The other consists of measurements and mathematical models derived from physical laws. Hence, w
incorporate these types of information into the design of systems. The question is that how it is possible to formulate human knowledge within a framework similar to mathematical models. In other words, the main question is “How is it
mathematical formula?”
such a conversion possible. Fuzzy systems are based on knowledge or rules. The core of a fuzzy system is a knowledge base following the IF
fuzzy system is used by a controller, the controller is called “fuz
converter takes two inputs: error (
The membership input functions for this controller are in the range of
input components of error and error variations are shown in Fig.7. Seven membership functions are used
input [17]
negative small (NS), zero (Z), positive big (PB), positive medium (PM), and pos
Fig. 6. The system control block diagram using BELBIC
( , , ) ( , , )
R f e y u S g e y u
= =
where e, y, and
controller output, respectively. In this paper, the sensory input and emotional signal are defined
1 2 3 4
5 6
.| | . . .e . | u |
. . .e
R K y K e dt K K
S K e dt K
= + + +
=
∫
+The control of gains K
similar to a conventional PI controller. K
determined for the settling time adjustment and K responsible for smoothing the system response. Also, K and K5 gains affect the steady
V.
In practical sys
two sources. One of the sources is the experts, who define their knowledge of the system using the natural language. The other consists of measurements and mathematical models derived from physical laws. Hence, w
incorporate these types of information into the design of systems. The question is that how it is possible to formulate human knowledge within a framework similar to mathematical models. In other words, the main question is “How is it possible to convert human knowledge to a mathematical formula?”
Basically, the main function
such a conversion possible. Fuzzy systems are based on knowledge or rules. The core of a fuzzy system is a knowledge base following the IF
fuzzy system is used by a controller, the controller is called “fuzzy controller”.
The fuzzy controller designed for the full bridge DC converter takes two inputs: error (
The membership input functions for this controller are in the range of -5 and 5. Membership functions for each of the t input components of error and error variations are shown in Fig.7. Seven membership functions are used
input [17]-[18]: negative big (NB), negative medium (NM), negative small (NS), zero (Z), positive big (PB), positive medium (PM), and pos
ystem control block diagram using BELBIC
( , , ) ( , , )
R f e y u S g e y u
, and u are the system error, system output and controller output, respectively. In this paper, the sensory input and emotional signal are defined
1 2 3 4
5 6
.| | . . .e . | u |
. . .e
R K y K e dt K K
S K e dt K
= + + +
= +
∫
∫
ontrol of gains K3 and K
similar to a conventional PI controller. K
determined for the settling time adjustment and K responsible for smoothing the system response. Also, K
gains affect the steady-state error [16].
FUZZY
CONTROLLER
In practical systems, important information originates from two sources. One of the sources is the experts, who define their knowledge of the system using the natural language. The other consists of measurements and mathematical models derived from physical laws. Hence, w
incorporate these types of information into the design of systems. The question is that how it is possible to formulate human knowledge within a framework similar to mathematical models. In other words, the main question is possible to convert human knowledge to a mathematical formula?”
Basically, the main function
such a conversion possible. Fuzzy systems are based on knowledge or rules. The core of a fuzzy system is a knowledge base following the IF
fuzzy system is used by a controller, the controller is called zy controller”.
The fuzzy controller designed for the full bridge DC converter takes two inputs: error (
The membership input functions for this controller are in the 5. Membership functions for each of the t input components of error and error variations are shown in Fig.7. Seven membership functions are used
: negative big (NB), negative medium (NM), negative small (NS), zero (Z), positive big (PB), positive medium (PM), and positive small (PS).
ystem control block diagram using BELBIC
system error, system output and controller output, respectively. In this paper, the sensory input and emotional signal are defined as below
1.| | 2. . 3.e 4. | u |
R=K y +K e dt+K +K
and K6 as well as K
similar to a conventional PI controller. K
determined for the settling time adjustment and K responsible for smoothing the system response. Also, K
state error [16].
CONTROLLER
tems, important information originates from two sources. One of the sources is the experts, who define their knowledge of the system using the natural language. The other consists of measurements and mathematical models derived from physical laws. Hence, what matters is how to incorporate these types of information into the design of systems. The question is that how it is possible to formulate human knowledge within a framework similar to mathematical models. In other words, the main question is possible to convert human knowledge to a
of a fuzzy system is to make such a conversion possible. Fuzzy systems are based on knowledge or rules. The core of a fuzzy system is a knowledge base following the IF-THEN fuzzy rules. If a fuzzy system is used by a controller, the controller is called
The fuzzy controller designed for the full bridge DC converter takes two inputs: error (e) and error variations ( The membership input functions for this controller are in the
5. Membership functions for each of the t input components of error and error variations are shown in Fig.7. Seven membership functions are used
: negative big (NB), negative medium (NM), negative small (NS), zero (Z), positive big (PB), positive
itive small (PS).
ystem control block diagram using BELBIC [14]
(15) (16)
system error, system output and controller output, respectively. In this paper, the sensory
as below: [14]
(17) (18)
.| | . . .e . | u |
as well as K2 and K5 is
similar to a conventional PI controller. K3 and K6 are
determined for the settling time adjustment and K1 is
responsible for smoothing the system response. Also, K2, K4
CONTROLLER
tems, important information originates from two sources. One of the sources is the experts, who define their knowledge of the system using the natural language. The other consists of measurements and mathematical models hat matters is how to incorporate these types of information into the design of systems. The question is that how it is possible to formulate human knowledge within a framework similar to mathematical models. In other words, the main question is possible to convert human knowledge to a
a fuzzy system is to make such a conversion possible. Fuzzy systems are based on knowledge or rules. The core of a fuzzy system is a THEN fuzzy rules. If a fuzzy system is used by a controller, the controller is called
The fuzzy controller designed for the full bridge DC-DC ) and error variations (∆e). The membership input functions for this controller are in the 5. Membership functions for each of the two input components of error and error variations are shown in Fig.7. Seven membership functions are used here for the : negative big (NB), negative medium (NM), negative small (NS), zero (Z), positive big (PB), positive
) )
system error, system output and controller output, respectively. In this paper, the sensory
) ) is are is 4
tems, important information originates from two sources. One of the sources is the experts, who define their knowledge of the system using the natural language. The other consists of measurements and mathematical models hat matters is how to incorporate these types of information into the design of systems. The question is that how it is possible to formulate human knowledge within a framework similar to mathematical models. In other words, the main question is possible to convert human knowledge to a
a fuzzy system is to make such a conversion possible. Fuzzy systems are based on knowledge or rules. The core of a fuzzy system is a THEN fuzzy rules. If a fuzzy system is used by a controller, the controller is called
DC ). The membership input functions for this controller are in the wo input components of error and error variations are shown in for the : negative big (NB), negative medium (NM), negative small (NS), zero (Z), positive big (PB), positive
Fig. 7.
The controller output is assumed to be equal to the duty cycle, which varies between 0 and 0.5. Fig. 8
controller output functions.
LI, MI, SI, NC, SD, MD and LD stand for medium i
medium
maximum duty cycle (i.e. 0.25). presented in Table 1.
The parameters of
in this paper are presented in the Appendix. It is assumed that the converter operates in the CCM mode. Simulations were carried out using Matlab/Simulink
A. Effectiveness of BELBIC for the full bridge
DC-The reference signal increases linear from to 250V, and then it stops growing.
controller obtained by trial and error for the system with this input, are shown in Table 2. As seen in Fig. 9, at t=
output voltage is stabilized with a slight overshoot. BELBIC is a model
the system remains stabilized in spite of variations values of
(Figs. 10
In Fig. 10, the reference voltage changes from 250V to 350V. In Fig. 11, the values of
(330µf, 7
Fig. 7. The membership functions for e and
The controller output is assumed to be equal to the duty cycle, which varies between 0 and 0.5. Fig. 8
controller output functions.
Fig. 8. The output membership functions
LI, MI, SI, NC, SD, MD and LD stand for increase, small
edium decrease and
maximum duty cycle (i.e. 0.25). presented in Table 1.
THE e
NB NM ∆e
NB LD LD NM LD LD NS LD LD Z LD MD PS LD MD PM LD MD PB MD SD
VI.
SIMULATION
parameters of the full bridge DC
in this paper are presented in the Appendix. It is assumed that the converter operates in the CCM mode. Simulations were carried out using Matlab/Simulink
Effectiveness of BELBIC for the full bridge -DC converter
The reference signal increases linear from to 250V, and then it stops growing.
controller obtained by trial and error for the system with this input, are shown in Table 2. As seen in Fig. 9, at t=
output voltage is stabilized with a slight overshoot.
BELBIC is a model-independent controller. Consequently, the system remains stabilized in spite of variations
s of L, C, load, input voltage and reference voltage (Figs. 10 - 13).
In Fig. 10, the reference voltage changes from 250V to 350V. In Fig. 11, the values of
, 7mH) to (700µf
embership functions for e and
The controller output is assumed to be equal to the duty cycle, which varies between 0 and 0.5. Fig. 8
controller output functions.
utput membership functions
LI, MI, SI, NC, SD, MD and LD stand for mall increase, no changes,
ecrease and large decrease in the half of the maximum duty cycle (i.e. 0.25). The f
TABLE I THE FUZZY RULES [17]
NM NS Z PS
LD LD MD MD LD MD SD MD LD MD SD SD MD SD NC Si MD SI SI MI MD MI SI MI SD MI MI LI
SIMULATION
RESULTS
the full bridge DC
in this paper are presented in the Appendix. It is assumed that the converter operates in the CCM mode. Simulations were carried out using Matlab/Simulink®.
Effectiveness of BELBIC for the full bridge DC converter
The reference signal increases linear from to 250V, and then it stops growing. The c
controller obtained by trial and error for the system with this input, are shown in Table 2. As seen in Fig. 9, at t=
output voltage is stabilized with a slight overshoot.
independent controller. Consequently, the system remains stabilized in spite of variations
, load, input voltage and reference voltage
In Fig. 10, the reference voltage changes from 250V to 350V. In Fig. 11, the values of L and
µf, 4mH), (200µ
embership functions for e and ∆e
The controller output is assumed to be equal to the duty cycle, which varies between 0 and 0.5. Fig. 8 displays
utput membership functions
LI, MI, SI, NC, SD, MD and LD stand for large increase, hanges, small decrease, ecrease in the half of the The fuzzy rules are
[17]
PS PM PB
MD SI LI MD MI LI SD MI LI Si MI LI MI LI LI MI LI LI LI LI LI
RESULTS
the full bridge DC-DC converter in this paper are presented in the Appendix. It is assumed that the converter operates in the CCM mode. Simulations were
Effectiveness of BELBIC for the full bridge
The reference signal increases linear from a voltage of zero The coefficients of the controller obtained by trial and error for the system with this input, are shown in Table 2. As seen in Fig. 9, at t=0.01s the output voltage is stabilized with a slight overshoot.
independent controller. Consequently, the system remains stabilized in spite of variations
, load, input voltage and reference voltage
In Fig. 10, the reference voltage changes from 250V to and C are changed from
µf, 5mH), and (700 The controller output is assumed to be equal to the duty
displays the
ncrease, ecrease, ecrease in the half of the uzzy rules are
DC converter used in this paper are presented in the Appendix. It is assumed that the converter operates in the CCM mode. Simulations were
voltage of zero oefficients of the controller obtained by trial and error for the system with this 0.01s the
independent controller. Consequently, the system remains stabilized in spite of variations in the , load, input voltage and reference voltage
10mH)
to 20
in the input voltage from 40V to 50V.
B.
application of
this figure, the BELBIC has a slight overshoot while the fuzzy controller has a considerable overshoot (the initial overshoot is 35 V).
10mH) respectively
Fig. 12 shows the result of an increase in load from 12.5 to 20Ω (at t=0.05s). Fig. 13
in the input voltage from 40V to 50V.
Fig. 9.
Fig. 10. The output voltage as a result of changes
Fig. 11. The output voltage as a result of changes
Fig. 12. The output voltage as a result of changes in the load
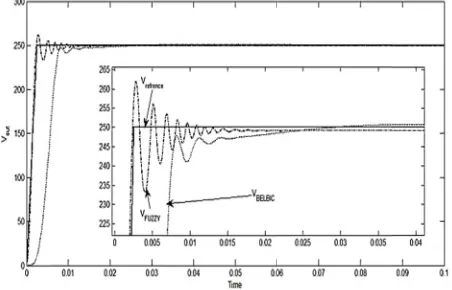
B. Comparison of BELBIC with fuzzy controller
Fig. 14 shows the system output voltage after application of the
this figure, the BELBIC has a slight overshoot while the fuzzy controller has a considerable overshoot (the initial overshoot is 35 V).
respectively.
Fig. 12 shows the result of an increase in load from 12.5 (at t=0.05s). Fig. 13 display
in the input voltage from 40V to 50V.
The output voltage of the full bridge converter
The output voltage as a result of changes in the reference voltage
The output voltage as a result of changes in the values
The output voltage as a result of changes in the load
Comparison of BELBIC with fuzzy controller
Fig. 14 shows the system output voltage after the fuzzy and BELBIC controllers. As seen in this figure, the BELBIC has a slight overshoot while the fuzzy controller has a considerable overshoot (the initial overshoot is 35 V).
Fig. 12 shows the result of an increase in load from 12.5 displays the result of an increase in the input voltage from 40V to 50V.
utput voltage of the full bridge converter
The output voltage as a result of changes in the reference voltage
The output voltage as a result of changes s of L and C
The output voltage as a result of changes in the load
Comparison of BELBIC with fuzzy controller
Fig. 14 shows the system output voltage after BELBIC controllers. As seen in this figure, the BELBIC has a slight overshoot while the fuzzy controller has a considerable overshoot (the initial
Fig. 12 shows the result of an increase in load from 12.5Ω
s the result of an increase
utput voltage of the full bridge converter
The output voltage as a result of changes
The output voltage as a result of changes
The output voltage as a result of changes in the load
Comparison of BELBIC with fuzzy controller
Fig. 14 shows the system output voltage after the BELBIC controllers. As seen in this figure, the BELBIC has a slight overshoot while the fuzzy controller has a considerable overshoot (the initial
Ω
s the result of an increase
the BELBIC controllers. As seen in this figure, the BELBIC has a slight overshoot while the fuzzy controller has a considerable overshoot (the initial
The time required for stabilization is almost the same in both cases. It is therefore c
outperforms
Figs. 15 and 16 show
values obtained from the two controller types earlier. As seen in these figures, the capacitance of is initially equal to 33
reaches 297
decrease in the capacity of the capacitor using the fuzzy controller leads to higher growth in the range of fluctuations and an overshoot of
BELBIC. Hence, the BELBIC demonstrates better
performance. When the capacitance of
output voltage obtained from the BELBIC shows a higher delay in reaching stabilization compared to the fuzzy controller. Moreover, the range
of the output voltage are higher with the fuzzy controller. Fig. 17
obtained using the aforementioned two controllers. In this figure, the initial capacitance of
and reaches 396 overshoot of
surpass those of the BELBIC controller. Hence, the BELBIC demonstrates a better performance.
Fig. 13.
Fig. 14.
The time required for stabilization is almost the same in both cases. It is therefore c
outperforms the fuzzy controller. Figs. 15 and 16 show
values obtained from the two controller types . As seen in these figures, the capacitance of is initially equal to 33
reaches 297µf and 290µ
decrease in the capacity of the capacitor using the fuzzy controller leads to higher growth in the range of fluctuations
overshoot of the
BELBIC. Hence, the BELBIC demonstrates better
performance. When the capacitance of
output voltage obtained from the BELBIC shows a higher delay in reaching stabilization compared to the fuzzy controller. Moreover, the range
of the output voltage are higher with the fuzzy controller. Fig. 17 depicts a comparison
obtained using the aforementioned two controllers. In this figure, the initial capacitance of
and reaches 396µf. Obviously
overshoot of the output voltage using the fuzzy controller surpass those of the BELBIC controller. Hence, the BELBIC demonstrates a better performance.
Fig. 13. The output voltage as a result of changes in the input voltage
Fig. 14. The comparison of the fuzzy controller with the
The time required for stabilization is almost the same in both cases. It is therefore concluded that the BELBIC
the fuzzy controller. Figs. 15 and 16 show a comparison values obtained from the two controller types
. As seen in these figures, the capacitance of
is initially equal to 330µf, reduces by 10% and 12% and and 290µf, respectively. In addition, decrease in the capacity of the capacitor using the fuzzy controller leads to higher growth in the range of fluctuations
the output voltage compar
BELBIC. Hence, the BELBIC demonstrates better
performance. When the capacitance of
output voltage obtained from the BELBIC shows a higher delay in reaching stabilization compared to the fuzzy controller. Moreover, the range of fluctuations and overshoot of the output voltage are higher with the fuzzy controller.
comparison of
obtained using the aforementioned two controllers. In this figure, the initial capacitance of C (330
Obviously the range of fluctuations and output voltage using the fuzzy controller surpass those of the BELBIC controller. Hence, the BELBIC demonstrates a better performance.
The output voltage as a result of changes in the input voltage
omparison of the fuzzy controller with the BELBIC
The time required for stabilization is almost the same in oncluded that the BELBIC
comparison of output voltages values obtained from the two controller types described
. As seen in these figures, the capacitance of C
reduces by 10% and 12% and , respectively. In addition, decrease in the capacity of the capacitor using the fuzzy controller leads to higher growth in the range of fluctuations output voltage compared to the
BELBIC. Hence, the BELBIC demonstrates better
performance. When the capacitance of C reduces by 12%, the
output voltage obtained from the BELBIC shows a higher delay in reaching stabilization compared to the fuzzy of fluctuations and overshoot of the output voltage are higher with the fuzzy controller.
output voltage values obtained using the aforementioned two controllers. In this (330µf) increases by 20% the range of fluctuations and output voltage using the fuzzy controller surpass those of the BELBIC controller. Hence, the BELBIC
The output voltage as a result of changes in the input voltage
omparison of the fuzzy controller with the
The time required for stabilization is almost the same in oncluded that the BELBIC
output voltages described
C, which reduces by 10% and 12% and , respectively. In addition, a 10% decrease in the capacity of the capacitor using the fuzzy controller leads to higher growth in the range of fluctuations ed to the
BELBIC. Hence, the BELBIC demonstrates better
reduces by 12%, the output voltage obtained from the BELBIC shows a higher delay in reaching stabilization compared to the fuzzy of fluctuations and overshoot of the output voltage are higher with the fuzzy controller.
output voltage values obtained using the aforementioned two controllers. In this ses by 20% the range of fluctuations and output voltage using the fuzzy controller surpass those of the BELBIC controller. Hence, the BELBIC
The output voltage as a result of changes
Fig. 15. The comparison of the BELBIC controller and fuzzy controller with a 10% reduction in C.
Fig. 16. The comparison
controller with a 12% reduction in capacity.
Fig.17. The comparison of the fuzzy controller and BELBIC with a 20% increase in capacitance of
Fig.18. The comparison of the BELBIC and fuzzy controllers with a 10% redu
omparison of the BELBIC controller and fuzzy controller with a 10% reduction in C.
omparison of the BELBIC controller and fuzzy controller with a 12% reduction in capacity.
omparison of the fuzzy controller and BELBIC with a 20% increase in capacitance of
omparison of the BELBIC and fuzzy controllers with a 10% reduction in inductance
omparison of the BELBIC controller and fuzzy controller with a 10% reduction in C.
of the BELBIC controller and fuzzy controller with a 12% reduction in capacity.
omparison of the fuzzy controller and BELBIC with a 20% increase in capacitance of
omparison of the BELBIC and fuzzy controllers ction in inductance
omparison of the BELBIC controller and fuzzy controller with a 10% reduction in C.
of the BELBIC controller and fuzzy controller with a 12% reduction in capacity.
omparison of the fuzzy controller and BELBIC with a 20% increase in capacitance of C
omparison of the BELBIC and fuzzy controllers ction in inductance
Fig.19.
Figs. 18 and 19 show
values obtained from the two controller
The results of
6.3mH the results are shown in
decreasing the value of inductance by 12% to 6.3mH are shown in
decrease in inductance, the range of fluctuati
overshoot of the output voltage obtained using the fuzzy controller
BELBIC shows a better performance. When inductance is reduced by 12%, the output voltage obtained by using the BELBIC controller reaches stab
Moreover, the fluctuations and overshoot of voltage obtained using the fuzzy controller than those derived from
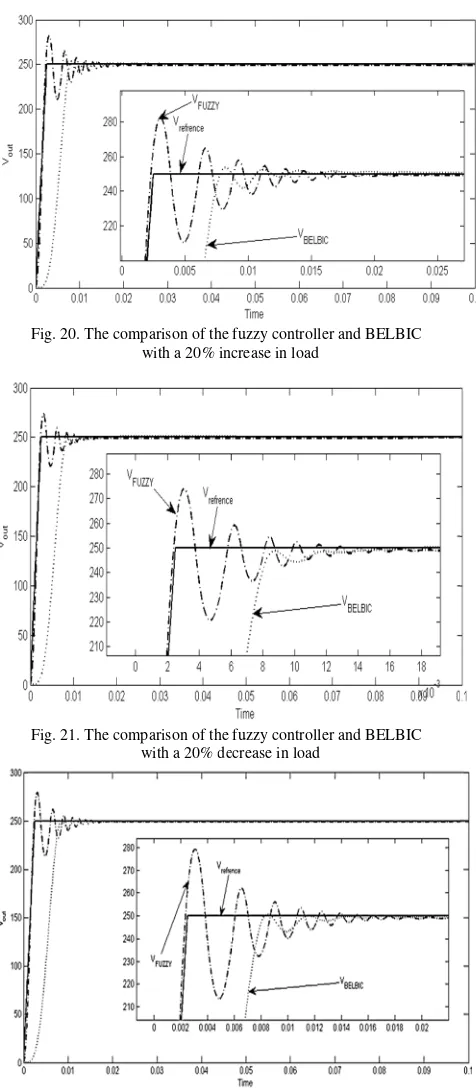
and 21 show
using the aforementioned two controllers. In these figures,the
decreased by 20% to reach 15 and 10 ohms, respectively. As seen in the figures,
higher range of fluctuations and the output voltage than
Therefore, the BELBIC functions better.The
fluctuations and overshoot of the output voltage are higher by using the fuzzy controller with a decrease and an increase in the input voltage to 39V and 41V, respectively. Hence, the system yields a more satisfactory output when the BELBIC is us
decreases and increases to 38V and 42V, the BELBIC demonstrates a higher delay in reaching stabilization. In addition, the range of fluctuations and overshoot of output voltage obtained through the fuzzy controller ar
(Figs. 24 and 25).
The comparison of the BELBIC and fuzzy controllers with a 12% reduction in inductance
Figs. 18 and 19 show
values obtained from the two controller
The results of decreasing the value of inductance by 10% to 6.3mH the results are shown in
decreasing the value of inductance by 12% to 6.3mH are shown in Fig. 19. As seen in these figures, with a 10% decrease in inductance, the range of fluctuati
overshoot of the output voltage obtained using the fuzzy controller exceed those of
BELBIC shows a better performance. When inductance is reduced by 12%, the output voltage obtained by using the BELBIC controller reaches stab
Moreover, the fluctuations and overshoot of voltage obtained using the fuzzy controller
those derived from show a comparison
the aforementioned two controllers. In these the initial load (12.5
decreased by 20% to reach 15 and 10 ohms, respectively. As seen in the figures,
range of fluctuations and the output voltage than
Therefore, the BELBIC functions better.The
fluctuations and overshoot of the output voltage are higher by using the fuzzy controller with a decrease and an increase in the input voltage to 39V and 41V, respectively. Hence, the system yields a more satisfactory output when the BELBIC is used (Figs. 22 and 23). When the voltage decreases and increases to 38V and 42V, the BELBIC demonstrates a higher delay in reaching stabilization. In addition, the range of fluctuations and overshoot of output voltage obtained through the fuzzy controller ar
(Figs. 24 and 25).
omparison of the BELBIC and fuzzy controllers % reduction in inductance
Figs. 18 and 19 show a comparison values obtained from the two controller
decreasing the value of inductance by 10% to 6.3mH the results are shown in Fig.
decreasing the value of inductance by 12% to 6.3mH are
. As seen in these figures, with a 10% decrease in inductance, the range of fluctuati
overshoot of the output voltage obtained using the fuzzy exceed those of the BELBIC. Hence, the BELBIC shows a better performance. When inductance is reduced by 12%, the output voltage obtained by using the BELBIC controller reaches stabilization in a longer time. Moreover, the fluctuations and overshoot of
voltage obtained using the fuzzy controller
those derived from the BELBIC controller.Figs. 20 comparison of the output voltages obtained the aforementioned two controllers. In these initial load (12.5Ω) is increased by 20% and is decreased by 20% to reach 15 and 10 ohms, respectively. As seen in the figures, when the fuzzy controller is used, a
range of fluctuations and overshoot the output voltage than when the BELBIC Therefore, the BELBIC functions better.The
fluctuations and overshoot of the output voltage are higher by using the fuzzy controller with a decrease and an increase in the input voltage to 39V and 41V, respectively. Hence, the system yields a more satisfactory output when ed (Figs. 22 and 23). When the voltage decreases and increases to 38V and 42V, the BELBIC demonstrates a higher delay in reaching stabilization. In addition, the range of fluctuations and overshoot of output voltage obtained through the fuzzy controller ar
omparison of the BELBIC and fuzzy controllers % reduction in inductance
comparison of output voltages values obtained from the two controllers described earlier
decreasing the value of inductance by 10% to Fig. 18. The results of decreasing the value of inductance by 12% to 6.3mH are
. As seen in these figures, with a 10% decrease in inductance, the range of fluctuations and overshoot of the output voltage obtained using the fuzzy the BELBIC. Hence, the BELBIC shows a better performance. When inductance is reduced by 12%, the output voltage obtained by using the ilization in a longer time. Moreover, the fluctuations and overshoot of the voltage obtained using the fuzzy controller, are higher
the BELBIC controller.Figs. 20 the output voltages obtained the aforementioned two controllers. In these
Ω) is increased by 20% and is decreased by 20% to reach 15 and 10 ohms, respectively. when the fuzzy controller is used, a overshoot are gained for
the BELBIC is used Therefore, the BELBIC functions better.The range of fluctuations and overshoot of the output voltage are higher by using the fuzzy controller with a decrease and an increase in the input voltage to 39V and 41V, respectively. Hence, the system yields a more satisfactory output when ed (Figs. 22 and 23). When the voltage decreases and increases to 38V and 42V, the BELBIC demonstrates a higher delay in reaching stabilization. In addition, the range of fluctuations and overshoot of output voltage obtained through the fuzzy controller are higher omparison of the BELBIC and fuzzy controllers
output voltages described earlier.
decreasing the value of inductance by 10% to The results of decreasing the value of inductance by 12% to 6.3mH are
Fig. 20. The c
Fig. 21. The c
Fig. 22. The comparison of
decrease in the input voltage (V
The comparison of the fuzzy controller and BELBIC with a 20% increase
The comparison of the fuzzy controller and BELBIC with a 20% decrease in load
omparison of the fuzzy controlle decrease in the input voltage (V
omparison of the fuzzy controller and BELBIC increase in load
omparison of the fuzzy controller and BELBIC decrease in load
fuzzy controller and BELBIC with a decrease in the input voltage (Vd=39V)
omparison of the fuzzy controller and BELBIC
omparison of the fuzzy controller and BELBIC
r and BELBIC with a =39V)
Fig. 23. The c
Fig. 24.
Fig. 25. The c
The performance of the BEBLIC and fuzzy controller in controlling the output voltage of the full bridge DC converter was satisfactory. Since these controllers are not designed to reduce error to zero, it is not possible to claim that the error rate is precisely zero. Compared to the fuzzy controller, the BELBIC shows negligible overshoots and fluctuations. Both
once.
It is, therefore, concluded that the BELBIC
the fuzzy controller. Considering the uncertainty of system parameters (including inductance, capacitance, and input
The comparison of
increase in the input voltage (V
Fig. 24. The comparison of decrease in the
The comparison of
increase in the input voltage (V
VII.
The performance of the BEBLIC and fuzzy controller in controlling the output voltage of the full bridge DC converter was satisfactory. Since these controllers are not designed to reduce error to zero, it is not possible to claim that the error rate is precisely zero. Compared to the fuzzy controller, the BELBIC shows negligible overshoots and fluctuations. Both controllers reach stabilization almost at
It is, therefore, concluded that the BELBIC
the fuzzy controller. Considering the uncertainty of system parameters (including inductance, capacitance, and input
omparison of the fuzzy controller and BELBIC with a increase in the input voltage (V
omparison of the fuzzy controller and BELBIC with a decrease in the input voltage (V
omparison of the fuzzy controller and BELBIC with a increase in the input voltage (V
CONCLUSION
The performance of the BEBLIC and fuzzy controller in controlling the output voltage of the full bridge DC converter was satisfactory. Since these controllers are not designed to reduce error to zero, it is not possible to claim that the error rate is precisely zero. Compared to the fuzzy controller, the BELBIC shows negligible overshoots and controllers reach stabilization almost at
It is, therefore, concluded that the BELBIC
the fuzzy controller. Considering the uncertainty of system parameters (including inductance, capacitance, and input
fuzzy controller and BELBIC with a increase in the input voltage (Vd=41V)
fuzzy controller and BELBIC with a input voltage (Vd=38V)
fuzzy controller and BELBIC with a increase in the input voltage (Vd=42V)
CONCLUSION
The performance of the BEBLIC and fuzzy controller in controlling the output voltage of the full bridge DC converter was satisfactory. Since these controllers are not designed to reduce error to zero, it is not possible to claim that the error rate is precisely zero. Compared to the fuzzy controller, the BELBIC shows negligible overshoots and controllers reach stabilization almost at
It is, therefore, concluded that the BELBIC outperforms the fuzzy controller. Considering the uncertainty of system parameters (including inductance, capacitance, and input
fuzzy controller and BELBIC with an
fuzzy controller and BELBIC with a
fuzzy controller and BELBIC with an
The performance of the BEBLIC and fuzzy controller in controlling the output voltage of the full bridge DC-DC converter was satisfactory. Since these controllers are not designed to reduce error to zero, it is not possible to claim that the error rate is precisely zero. Compared to the fuzzy controller, the BELBIC shows negligible overshoots and controllers reach stabilization almost at
voltage and acceptable variations of load), the BELBIC presentss better performance than the fuzzy controller. Although fuzzy control is a robust and effective method for a large number of engineering systems, but its design (and consequently its performance) is almost depend on the experience and tact of the designer. Furthermore, after design and installation, its performance is not improved, and in other word, it is not a learning-based or intelligent controller. It can be stated that a Learning Based Intelligent Control which 'may' in the first step, act not as satisfying as any another modern controller, any straight-forward-designed controller after a few iterations thanks to its learning automata feature. Based on this deduction, we felt no need to emphasize the comparison of these controllers after setting optimization.
APPENDIX
Specifications of the full bridge DC-DC converter
0 Switches and diodes
resistance(Ω) 200
0 Switching frequency (Hz)
12.5 Load resistance(Ω) 7
Filter inductance(mH)
40 Input voltage(V) 330
Filter capacitor(µf)
1:10 Transformer ration 9
Transformer rating (KVA)
BELBIC CONTROLLER COEFFICIENTS 50
K5
0.00045
K1
2
K6
0.21
K2
0.000039
α
0.000002
K3
0.0000008
β
0.0007
K4
REFERENCES
[1] G.C. Chrysis, High Frequency Switching Power Supplies, 2nd Edition, 1989, McGraw-Hill
[2] M. Samadi , A. Afzali-Kusha, C. Lucas, “Power management by brain emotional learning algorithm,” ASIC, 2007, pp77-81.
[3] M. Abd Al-Alim El-Garhy, R.I. Mubarak and M. El-Bably "Improving maximum power point tracking of partially shaded photovoltaic system by using IPSO-BELBIC,"
Journal of Instrumentation, Volume 12, August 2017
[4] E. Daryabeigi, G. Arab Markade, C. Lucase," Interior permanent magnet synchronous motor (IPMSM), with a developed brain emotional learning based intelligent controller (BELBIC) ", in Proc IEEE, IEMDC, May. 2009, pp1633 – 1640.
[5] S. Valizadeh, M. Jamali, C. Lucas. "A Particle-Swarm-Based Approach for Optimum Design of BELBIC Controller in AVR System", International Conference on Control Automation and Systems, pp. 2679-2684, 2008.
[6] N.R. Abjadi, M. Mahdavi, H. Akbari," Emotional controller (BELBIC) for positive output Luo converter " 5th International Conference on Control, Instrumentation, and Automation (ICCIA),2017
[7] E. Daryabeigi, H. Abootorabi Zarchi, Gh.R. Arab Markadeh, M. A. Rahman, C. Lucas, “Implementation of emotional controller (BELBIC) for synchronous reluctance motor drive”
IEMDC, 2011, pp 1088 – 1093.
[8] E. Bijami, R. Abshari, S.M. Saghaiannejad, J. Askari, “Load frequency control of interconnected power system using brain emotional learning based intelligent controller”, ICEE, 2011,
pp 1-6.
[9] E.Bijami, M. Jadidoleslam, , A.Ebrahimi, , M.M. Farsangi, K.Y.Lee, “Power system stabilization using brain emotional learning based intelligent controller,”Power and Energy Society General Meeting, 2011, pp 1-7.
[10] E. Daryabeigi, , A. Emanian, , M.M. NamaziRashidi, S.M. Saghaian-Nejad, , “Torque ripple reduction of switched reluctance motor (SRM) drives, with emotional controller (BELBIC)”, APEC, 2012, pp 1528-1535
[11] A. Ghadimi, A. Movali Daryani, H. Rastegar, " Detailed Modelling and Analysis of a Full Bridge PWM DC-DC Converter" Department of Electrical Engineering Amirkabir University of Technology, Tehran
[12] Mohan, Undeland, Robbins, Power Electronics Converter. Application, and Design, thired edition Wiley, 2003
[13] C. Iannello, S. Luo, and I. Batarseh, "Small-Signal and Transient Analysis of a Full-Bridge, Zero-Current-Switched PWM Converter Using an Average Model", IEEE Transaction on Power Electronics, Vol. 18, NO.3, 2003 [14] A. R. Mehrabian, C. Lucas, "a toolbox for brain emotional
learning based intelligent controller," IEEE International Conference on Engineering of Intelligent Systems, pp. 1-5, 2006.
[15] J. Moren, C. Balkenius, "A Computational Model of Emotional Learning in the Amygdala," From animals to animals 6: Proc. of the 6th International conference on the simulation of adaptive behavior, Cambridge, Mass., 2000.The MIT Press.
[16] H, A. Zarchi, E. Daryabeigi, G. R. A. Markadeh, J. Soltani, "Emotional controller (BELBIC) based DTC for encoderless Synchronous Reluctance Motor drives, " in Proc. Int. Conf. PEDSTC, pp. 478-483 2011.
[17] N.L. Diaz and J.J. Soriano, "Study of Two Control Strategies Based in Fuzzy Logic and Artificial Neural Network Compared with an Optimal Control Strategy Applied to a Buck Converter," Annual Meeting of the North American Fuzzy Information Processing Society, June 2007 [18] M.R. Rafiei, R. Ghazi, R. Asgharian, H.A. Toliyat, and S.M.
of Engineering department in electrical engineering group at Islamic Azad University, Isfahan, Iran. His research
electric motor drives, power electronics converters design and control.
electrical engineering. He is currently Electrical Engineering
University, , Isfahan, Iran. His research inter control, power system control, stability, and reliability
Reza Keramat
degrees from
Azad University, Fars, Iran, in 2010 and Khomeini-shar branch
University, Isfahan, Iran, in 2013 respectively. His research interests are DC
and inverters and intelligent controller
Mohammad Hossein Ershadi
Isfahan, Iran, in 1981. He received his B.S., M.Sc and PhD
engineering from Isfahan University of Technology, Isfahan, Iran, in 2004, 2007 and 2012 respectively. He is the faculty member of Engineering department in electrical engineering group at Islamic Azad University, Isfahan, Iran. His research
electric motor drives, power electronics converters design and
Shahrokh Shojaeian
M.Sc. degrees
Technology, Isfahan, Iran, in 1997 and 2000 respectively, and Ph.D. degree from
and Research Branch
University, , Tehran, Iran, in 2012, all in electrical engineering. He is currently
Electrical Engineering, Khomeinishahr Branch University, , Isfahan, Iran. His research inter control, power system control, stability, and reliability
Reza Keramat received the B.Sc. and M.S from Kazerun branch
Azad University, Fars, Iran, in 2010 and shar branch of
University, Isfahan, Iran, in 2013 respectively. research interests are DC
and intelligent controller
Mohammad Hossein Ershadi
Isfahan, Iran, in 1981. He received his B.S., M.Sc and PhD degrees
engineering from Isfahan University of Technology, Isfahan, Iran, in 2004, 2007 and 2012 respectively. He is the faculty member of Engineering department in electrical engineering group at Islamic Azad University, Isfahan, Iran. His research
electric motor drives, power electronics converters design and
Shahrokh Shojaeian received his B.Sc. and s from Isfahan University of Technology, Isfahan, Iran, in 1997 and 2000 respectively, and Ph.D. degree from
and Research Branch of
University, , Tehran, Iran, in 2012, all in electrical engineering. He is currently a Faculty
Khomeinishahr Branch of
University, , Isfahan, Iran. His research interests are nonlinear control, power system control, stability, and reliability
received the B.Sc. and M.Sc. Kazerun branch of Islamic Azad University, Fars, Iran, in 2010 and of Islamic Azad University, Isfahan, Iran, in 2013 respectively.
research interests are DC-DC converters and intelligent controllers.
Mohammad Hossein Ershadi was born in Isfahan, Iran, in 1981. He received his B.S., degrees in electrical engineering from Isfahan University of Technology, Isfahan, Iran, in 2004, 2007 and 2012 respectively. He is the faculty member of Engineering department in electrical engineering group at Islamic Azad University, Isfahan, Iran. His research interests are electric motor drives, power electronics converters design and
received his B.Sc. and from Isfahan University of Technology, Isfahan, Iran, in 1997 and 2000 respectively, and Ph.D. degree from Science of Islamic Azad University, , Tehran, Iran, in 2012, all in Faculty member of of Islamic Azad ests are nonlinear control, power system control, stability, and reliability.
. Islamic Azad University, Fars, Iran, in 2010 and Islamic Azad University, Isfahan, Iran, in 2013 respectively.
s
was born in Isfahan, Iran, in 1981. He received his B.S., in electrical engineering from Isfahan University of Technology, Isfahan, Iran, in 2004, 2007 and 2012 respectively. He is the faculty member of Engineering department in electrical engineering group at interests are electric motor drives, power electronics converters design and
IECO
![Fig. 5. The bThe brain emotional learning computational model rain emotional learning computational modelrain emotional learning computational modelrain emotional learning computational model [14]](https://thumb-us.123doks.com/thumbv2/123dok_us/16766.2001689/3.612.326.540.64.282/computational-emotional-computational-modelrain-emotional-computational-modelrain-computational.webp)