Nutrition Theses Department of Nutrition
Winter 11-14-2012
Association Between Vitamin D Intake and Obesity During Pre-
Association Between Vitamin D Intake and Obesity During Pre-
and Early Adolescence
and Early Adolescence
Lori A. Scholle
GSU Department of Nutrition
Follow this and additional works at: https://scholarworks.gsu.edu/nutrition_theses
Recommended Citation Recommended Citation
Scholle, Lori A., "Association Between Vitamin D Intake and Obesity During Pre- and Early Adolescence." Thesis, Georgia State University, 2012.
https://scholarworks.gsu.edu/nutrition_theses/39
This Thesis is brought to you for free and open access by the Department of Nutrition at ScholarWorks @ Georgia State University. It has been accepted for inclusion in Nutrition Theses by an authorized administrator of
ACCEPTANCE
This thesis, ASSOCIATION BETWEEN VITAMIN D INTAKE AND OBESITY DURING PRE- AND EARLY ADOLESCENCE, by Lori A Scholle was prepared under the direction of the Master’s Thesis Advisory Committee. It is accepted by the committee members in partial fulfillment of the requirements for the degree Master of Science in the Byrdine F. Lewis School of Nursing and Health Professions, Georgia State University. The Master’s Thesis Advisory Committee, as representatives of the faculty, certify that this thesis has met all standards of excellence and scholarship as determined by the faculty.
_____________________ ________________________
Anita M. Nucci, PhD, MPH, RD, LD Vijay Ganji, PhD, RD
Committee Chair Committee Member
______________________
Catherine McCarroll, MPH, RD, LD Committee Member
AUTHOR’S STATEMENT
In presenting this thesis as a partial fulfillment of the requirements for the advanced degree from Georgia State University, I agree that the library of Georgia State University shall make it available for inspection and circulation in accordance with its regulations governing materials of this type. I agree that permission to quote, to copy from, or to publish this thesis may be granted by the professor under whose direction it was written, by the Byrdine F. Lewis School of Nursing and Health Professions director of graduate studies and research, or by me. Such quoting, copying, or publishing must be solely for scholarly purposes and will not involve potential financial gain. It is understood that any copying from or publication of this thesis which involves potential financial gain will not be allowed without my written permission.
NOTICE TO BORROWERS
All theses deposited in the Georgia State University library must be used in accordance with the stipulations prescribed by the author in the preceding statement. The author of this thesis is:
Lori A Scholle 615 Ponce de Leon Place
Decatur, GA 30030
The director of this thesis is:
Anita M. Nucci, PhD, MPH, RD, LD Assistant Professor and Department Head
Department of Nutrition
Byrdine F. Lewis School of Nursing and Health Professions Georgia State University
VITA
Lori A Scholle
ADDRESS: 615 Ponce de Leon Place
Decatur, GA 30030
EDUCATION: M.S. 2012 Georgia State University
Health Sciences, Nutrition
B.A. 1998 Georgia State University
History
PROFESSIONAL EXPERIENCE:
Bookkeeper 2008-2012
Law Firm of P. Charles Scholle, Atlanta, GA
Project Manager, Meetings and Events 2006-2007
Imedex, Inc., Atlanta, GA
Senior Event Manager 2000-2005
Atlanta Marriott Marquis, Atlanta, GA
Foreign Exchange Deals Assistant 1999
Hong Kong Shanghai Banking Corporation (HSBC) London, United Kingdom
Server and Assistant Dining Room Manager 1998-2002
Seegers Restaurant, Atlanta, GA
Server and Department Trainer, Dining Room 1996-1998 Four Seasons Hotel, Atlanta, GA
PROFESSIONAL SOCIETIES AND ORGANIZATIONS:
American Dietetic Association 2011-present
Georgia Dietetic Association 2011-present
Greater Atlanta Dietetic Association 2011-present
Member of Guild of Sommeliers 2004-present
Certified Meeting Planner (CMP) 2004-2010
AWARDS AND PUBLICATIONS:
Employee of the Year – Four Seasons Hotel, Atlanta, GA 1997
Dean’s List – Georgia State University (Winter and Fall Quarter) 1997
Dean’s List – Georgia State University (Winter Quarter) 1998
Event Management Team of the Year, 2003
Atlanta Marriott Marquis, Atlanta, GA
ABSTRACT
ASSOCIATION BETWEEN VITAMIN D INTAKE AND OBESITY DURING PRE- AND EARLY ADOLESCENCE
by Lori A Scholle
Background: Prevalence of obesity in US children has increased substantially. The
influence of vitamin D intake on body mass index (BMI) is yet to be clearly defined.
Results are mixed regarding the relationship of vitamin D deficiency with obesity in
children. The objective of this study was to examine the association between vitamin D
intake and BMI over a 6 month period in pre-to early adolescent children in Pittsburgh,
PA.
Methods: Secondary analysis was done on 256 healthy 6-14 year old (54% male)
Caucasian and African American (70%) children from Pittsburgh, PA. Participants
completed a food frequency questionnaire (FFQ) and a Sun Exposure Questionnaire
(SEQ) and provided anthropometric measures at 2 time points 6 months apart. Vitamin
D intake was compared by BMI status (normal = <85th percentile, overweight = 85th to
95th percentile, obese = >95th percentile) as well as by change in BMI over 6 months.
Statistical analysis included descriptive statistics, Kruskal-Wallis analysis of variance,
Spearman’s correlation, Chi Square test, and regression analysis (vitamin D intake,
gender, race, baseline BMI, total energy intake, sun exposure and sunscreen use).
Results: Median reported vitamin D intake was 245.85 IU at baseline and 382.51 IU at 6
month follow up. After subdividing children by BMI, at baseline the obese group
reported lowest median intake (188 IU) and at 6 month follow up the normal group
intake and BMI was significant (P=0.033) but weak (r=-0.015). Regression analysis
revealed only baseline BMI status (P=<0.001) as a predictor of 6 month follow up BMI.
No relation was observed between change in BMI and vitamin D intake.
Conclusion: The results of this study do not support a strong relationship between
ASSOCIATION BETWEEN VITAMIN D INTAKE AND OBESITY DURING PRE- AND EARLY ADOLESCENCE
by Lori A Scholle
A Thesis
Presented in Partial Fulfillment of Requirements for the Degree of
Master of Science in Health Sciences
The Byrdine F. Lewis School of Nursing and Health Professions
Department of Nutrition
Georgia State University
ii
ACKNOWLEDGMENTS
I would like to extend my sincerest and deepest gratitude to Dr. Anita Nucci for her
generosity with her vast knowledge, infinite patience with my inquiries and her
unwavering and constant voice of reason throughout the creation of this thesis. I am
humbled by her wealth of knowledge and experience that provided such valuable insight
and guidance to the completion of this thesis. I would also like to thank Dr. Vijay Ganji
and Catherine McCarroll for their expert assistance in editing this thesis. A thank you is
also owed to the entire Nutrition Department at Georgia State University for their
flexibility and support in allowing non-traditional students to accomplish their
educational and career goals. I am grateful for Dr. Kumaravel Rajakumar and his staff
for beginning the initial research and for their support while writing this manuscript.
Most importantly, I am grateful to my husband Charles Scholle and my sons, Max, Jack
and Ben for their patience, understanding and support during these past years. Without
them and the rest of my loving family and friends, accomplishing this dream of higher
iii
TABLE OF CONTENTS
List of Tables ... iv
Abbreviations ...v
Chapter I. INTRODUCTION ...1
Hypotheses……….2
II. LITERATURE REVIEW ...3
Role of Vitamin D ...3
Current Vitamin D Intake Recommendations ...4
Vitamin D Status in Children ...6
Risk Factors for Vitamin D Insufficiency………..6
Relationship Between Obesity and Vitamin D ...9
Sequestration in Body Fat Stores ...9
Vitamin D Deficiency and Weight Gain………. 10
Nutrition Assessment in Children ...11
III. METHODS AND PROCEDURES………. ...13
Participants……… ………...………...13
Demographics, Anthropometrics and Sunlight Exposure ………..14
Vitamin D Intake……….14
Data Analysis………...15
IV. RESULTS…..………..16
Demographics..………16
Nutrient Intake…….………16
Sunlight Exposure………17
Influence of Vitamin D Intake on BMI Status….………17
V. DISCUSSION AND CONCLUSIONS..………19
Vitamin D Intake and BMI in Total Population……….19
Relationship of BMI Change and Vitamin D Intake ……….………22
REFERENCES ...34
iv
LIST OF TABLES
Table Page
1. Demographics: Age, Race and Gender ...24
2. Anthropometrics: Height, Weight, BMI ...25
3. Nutrient Intake ...26
4. Median Daily Vitamin D Fortified Food Intake ...27
5. Supplement Intake ...28
6. Sunlight Exposure ...29
7. Vitamin D Intake by BMI Status: Baseline and 6 Month Follow up………....…30
LIST OF FIGURES Figure 1. Regression Analysis of Vitamin D Intake and BMI at 6 Month Follow Up ...31
v
ABBREVIATIONS
BMI Body Mass Index
DRI Daily Reference Intake
DXA Dual-energy X-ray Absorptiometry
FFQ Food Frequency Questionnaire
IU International Units
LFFQ Long Food Frequency Questionnaire
NHANES National Health Examination Survey
SD Standard Deviation
SEQ Sun Exposure Questionnaire
SFFQ Short Food Frequency Questionnaire
SPF Sun Protection Factor
UPMC University of Pittsburgh Medical Center
1 CHAPTER I
ASSOCIATION BETWEEN VITAMIN D INTAKE AND OBESITY DURING PRE- AND EARLY ADOLESCENCE
Introduction
In the last 20 years the number of individuals in the United States that are
considered obese has increased substantially. Seventeen percent (12.5 million) of
children and adolescents were classified as obese in 2010 (1–3). Obesity poses a health
risk to children as they are more likely to have high blood pressure and elevated
cholesterol, which can lead to cardiovascular disease, type 2 diabetes, fatty liver disease,
and breathing and musculoskeletal problems. (2)
As the problem continues to grow, studies conducted to identify the causes and
determine the long term effects of childhood and adolescent obesity are helping to paint a
more complete picture of the disease. Some of the causes identified include energy
imbalance, lack of physical activity, the environment, and in a small percentage, genetics,
hormone imbalance diseases and pharmaceuticals(4). Scientific studies have focused on
these causes but some researchers are investigating whether other factors such as vitamin
deficiencies could be contributing to this epidemic. Vitamin D is one such factor that is
being explored to see if a deficiency might have an effect on obesity.
Positive associations between vitamin D deficiency and the prevalence of obesity
have been shown. Recent studies in the adult population suggested that adequate serum
vitamin D levels could be connected to increased adipocyte activity and oxidation of fat
7). Studies conducted in children showed a connection between vitamin D status and
BMI in that individuals with the lowest concentrations of serum vitamin D are often
obese (4,8). Individuals more likely to be at risk for deficiency includes those who are
overweight or obese, spend a large amount of time indoors, live in northern latitudes, and
have diets lacking adequate vitamin D. Studies have already established a relationship
between vitamin D in various settings however the strength and causality of those
relationships are still being investigated. The purpose of this study was to describe the
association between vitamin D intake and body mass index (BMI) over a 6 month period
in a population of pre-to-early adolescent children in Pittsburgh, PA.
Hypotheses
Hypothesis 1: Vitamin D intake is negatively related with BMI in
pre-adolescent children regardless of sunlight exposure.
Hypothesis 2: Children who are overweight or obese at baseline using
BMI percentile criteria and exhibit no change in BMI status at follow-up will
report a lower vitamin D intake than children who exhibit a normalization of BMI
3 Chapter II
Literature Review
Role of Vitamin D
Vitamin D is a fat soluble vitamin that can be obtained through diet in a few
natural and fortified food sources, in supplements and through endogenous production
with adequate sunlight exposure (9,10). Vitamin D can take the form of vitamin D2,
which occurs naturally in mushrooms exposed to sunlight and irradiated yeast sterol
ergosterol. It can also take the form of vitamin D3, which is made in the skin through sun
exposure and present in oily fish. Whether ingested or endogenously produced, vitamin
D must be hydroxylated in both the liver and the kidney before it is considered active.
Biologically active vitamin D (vitamin D 1,25 (OH)2) then binds with vitamin D
Receptors (VDR) present in various tissues throughout the body to carry out many
biological functions (11). Emerging evidence from recent studies suggest that VDR in
some tissues, including the colon, brain, breast, prostate and macrophages, are able to
complete the last hydroxylation step to produce and activate vitamin D locally (9,11).
The primary recognized role of vitamin D is to promote the absorption of calcium
in the small intestine and to maintain homeostatic serum calcium and phosphorous levels
that support bone mineralization and growth. In children and adolescents this is
especially important as it helps to prevent rickets (9,11,12). The presence of VDRs on
most body tissues allows biologically active vitamin D to have a role in cellular
stimulation of insulin and macrophage cathelicidin production and a role in gene
regulation (11). Vitamin D plays other roles whic
h include the improvement of neuromuscular and immune functions and cardiovascular
health and is being considered for its possible role in reducing risk for cancer, diabetes
and hypertension (11,13).
Current Vitamin D Intake Recommendations
The 2010 Dietary Reference Intakes (DRI) for vitamin D in children ages 1 to 18
years old is 600 IU with an upper limit of 2,500 IU/day. The American Academy of
Pediatrics issued their recommendations for 400 IU of vitamin D for children and
adolescents in 2008 and have maintained that stance even with the new recommendations
issued in 2010 (14) . The method used to ascertain vitamin D status in humans is the
measurement of the serum levels of 25-hydroxyvitamin D [25(OH)D], the circulating
form of vitamin D (1,25-hydroxyvitamin D) that has a half -life of about 2-3 weeks (11).
Measurement of the biologically active form of vitamin D is not an accurate measure as it
usually appears to be normal or above in children and adults who are actually deficient
(9). In 2010 the Institute of Medicine suggested that both children and adults with serum
levels of Vitamin D that are <20ng/ml were deficient, 21-29mg/ml are insufficient and
≥30ng/mL are sufficient which is also confirmed by the 2011 Endocrine Society Clinical
Practice Guidelines (9,11).
Vitamin D Status in Children
In 2012 the Centers for Disease Control and Health Promotion reported that
between the years of 2003 and 2006 there were approximately 442,000 children between
of vitamin D that was less than 30 nmol/L and were therefore considered deficient (15).
Data collected for the National Health and Nutrition Examination Survey (NHANES)
between the years of 2001-2006 on vitamin D status indicated that deficiency occurred in
5-10% of females between 9 and 18 years old and in 2-7% of males of the same age
group. The same data indicated that 22-24% of females between 9 and 18 years old and
19-22% of males of the same age group were considered insufficient (16) . The data
from these surveys suggest that insufficient vitamin D status in the pediatric population is
especially prevalent in the pre to early adolescent stages and puts them at risk for
deficiency during key growth periods.
Sources of vitamin D for children and adolescents include sunlight exposure,
fortified food sources, such as dairy products and juices, and taking a daily supplement.
Bailey and colleagues(17) estimated vitamin D intakes in 9-13 year olds using NHANES
2005-2006 data and found that 53% of males and 47% of females met the adequate intake
(AI) levels through diet alone. The same study showed that when a dietary supplement
containing vitamin D was added that 66% of males and 53% of females met the AI for
vitamin D(17). Fortified dairy product consumption is key to achieving AI of vitamin D
levels. A study by Fulgoni and associates(18) demonstrated that African –American
males and females ages 2-18 years old had significantly lower dairy intake than their
non-African American counterparts. This population is already at risk for vitamin D
deficiency due to their dark skin color. These findings reveal the need for education on
the importance of consuming vitamin D fortified foods as well as supplements to ensure
Risk Factors for Vitamin D Insufficiency
There are many risk factors that contribute to an individual’s risk for vitamin D
deficiency. The most important risk factor is the lack of adequate exposure to sunlight
for endogenous production of vitamin D. The amount of sun exposure is affected by
many factors including a person’s skin color, sunscreen use, geographical location and
the season of the year. African Americans and Hispanics produce less endogenous
vitamin D due the presence of higher amounts of melanin in their skin which requires
them to have 3-5 times the amount of sun exposure to produce similar amounts as
compared to Caucasians (9,19). Individuals who use sunscreen to prevent sunburn also
block the penetration of UV rays. If the sunscreen SPF is 30 or higher, it can actually
reduce vitamin D synthesis in the skin by as much as 95% (11). The amount of time for
sun exposure is limited for individuals who live in more northern latitudes due to reduced
sunlight availability, weather conditions and day length (20). All of these factors are
compounded by the season of the year as winter and fall have shorter days and cooler
temperatures and are more likely to have cloud cover and less opportunity for sunlight
exposure.
Other factors contributing to deficiency include a diet that is low in natural or
fortified vitamin D sources, such as milk, cheeses, yogurts, and the presence of certain
health conditions like fat malabsorptive disorders, nephrotic syndrome, primary
hyperparathyroidism, chronic granuloma forming disorders and lymphomas. (11)
Relationship between Obesity and Vitamin D
Obesity is another health condition that has been identified as a risk for vitamin D
obesity in child and adult populations. In 2012 Ganji and colleagues(21) explored the
overall prevalence of vitamin D deficiency in individuals between ages 12 to 70+ years
old in assay-adjusted NHANES data from 1988-2006. Their findings indicated an
overall population trend of decreased mean serum vitamin D concentrations by 9%
(60.7nmol/L in 1988-1994 to 55.2nmol/L in 2001-2006 – P=<0.001). Specifically in the
adolescent population (12-19y/o) there was an overall mean serum vitamin D
concentration decrease from 64nmol/L in 1988-1994 to 55nmol/L in 2001-2006
(P=<0.001).(21) The overall number of individuals that experienced vitamin D
deficiency (<25nmol/L) increased from 2.4% in 1988-1994 and to 4.7% in 2001-2006.
When analyzed in separate categories the adolescent group showed a dramatic the
increase from 1.12% to 3.31% (196% - P=<0.001)(21). Ganji et al(21) further explored
factors that could influence this decrease in vitamin D levels and found that there was
also an overall increase in mean BMI for all the population subsets studied (P=<0.001).
They hypothesize that the increase in overweight and obese populations in this data set
has had an influence over the lowering of vitamin D status in that these individuals are
less likely to engage in outdoor activities thereby limiting sun exposure and are more
likely to sequester vitamin D into their adipose tissue. While this very recent study
conducted by Ganji and colleagues (21) takes a comprehensive look at the entire US
population, which included some adolescents, review of the literature reveals past studies
specifically aimed at the pediatric population that also indicate a significant inverse
relationship between BMI and vitamin D status.
In a 2010 study, Dong et al(20) examined the prevalence of vitamin D
subjects between the ages of 14-18 years old. Anthropometric data were recorded for all
subjects. Dual-energy x-ray absorptiometry (DXA) was used to assess lean mass, fat
mass and proportion of body fat and serum vitamin D concentrations were used to assess
status. Descriptive statistics indicate that the subjects had an average BMI percentile of
61.6% +/-27.8% which indicates that individuals of all BMI categories (underweight –
obese) were represented in this study. The overall rate of vitamin D insufficiency was
56.4% and deficiency was 28.8% in this population. The most significant finding this
study revealed was significant inverse relationships between vitamin D status and BMI
percentile (P= 0.02) waist circumference (P=<0.01), total fat mass (P = <0.01) and
proportion of body fat (P=0.01) (20). The consistency of the strength of the inverse
relationship between all adiposity measures and vitamin D status in all subjects across the
BMI spectrum further confirms that the tendency towards vitamin D insufficiency in
overweight and obese subjects strong.
Further review of the literature with the specific aim of exploring this relationship
in an exclusively obese population revealed a study conducted by Alemzadeh et al (22)
on 127 obese (>95th BMI percentile for age) subjects between the ages 6 to 18 years old
in Wisconsin in 2008. In their study vitamin D insufficiency was found in 74% of the
total group. More specifically, the group with vitamin D insufficiency/deficiency had
higher BMI (41.1kg/m2 - P=<0.02) and higher fat mass (54 kg - P=<0.001) than the
vitamin D sufficient group (BMI – 33.9kg/m2 and 40.8kg) (22). These findings further
confirm the inverse relationship between vitamin D status and BMI and the high
prevalence of vitamin D insufficiency/deficiency in a population of obese children and
Sequestration in Body Fat Stores
The prevalence of low serum vitamin D in obese adolescents can be attributed to
sequestration of vitamin D in fat stores, whether visceral or subcutaneous, which limits
it’s bioavailability (23–25). Rodriguez-Rodriguez et al(24) conducted a prospective
study during the winter months in Spanish children in an attempt to find associations of
vitamin D status with anthropometric measurements. Some of the key findings include
that subjects with body weight (P=0.002), BMI (P=0.037), waist measurement (P=0.025)
and weight height ratios (P=0.025) that were above the 50th percentile were at greater risk
for having lower levels of vitamin D (24). Later Rajakumar et al (25) explored the
differences in adiposity in Caucasian versus African-American adolescents (n=237) and
their relationship with vitamin D status by comparing anthropometric data and
biochemical measurements. Overall findings showed that individuals with higher BMIs,
percentage of body fat and abdominal adiposity had an inverse relationship with plasma
vitamin D levels. African Americans were more likely to have lower overall serum
vitamin D levels (P<0.001) and Caucasians with higher levels of visceral fat were more
likely to experience vitamin D insufficiency/deficiency (25). Both of these studies
demonstrate that the amount and location of body fat, which could potentially sequester
vitamin D, could be determining factors in the vitamin D status of children.
Vitamin D Deficiency and Weight Gain
The literature suggests that there is a possible link between vitamin D
insufficiency/deficiency and the likelihood to gain weight leading to obesity. Moderate
to severe vitamin D deficiency has been shown to cause higher circulating levels of
calcium in adipocytes thereby increasing lipogenesis (23,26). The mechanism through
which vitamin D plays a role in this process is established when calcium levels in the
body are low and the body responds by using serum vitamin D to stimulate the release of
more parathyroid hormone which enables the release of more calcium into the blood.
Inadequate levels of vitamin D reduce the amount of parathyroid hormone release which
in turn decreases serum levels of calcium which increases lipogenesis and reduces
lipolysis (23). Because vitamin D and calcium are acquired through diet in similar foods
it is logical to assume that individuals who consume limited amounts of these foods are
likely to experience deficiencies in both.
One study conducted by Gilbert-Diamond et al(26) in Bogota, Columbia
prospectively explored the relationship of vitamin D status and linear growth on a group
of children (n=479, aged 5-12y/o) over a 2 year period. They found that children who
were vitamin D insufficient/deficient had an increase of 0.1 BMI percentile points
(P=0.05) per year, a mean increase of 0.03 subscapular-to-triceps measures (P=0.003),
and an increase of 0.8cm/year in waist circumference (P=0.03) as compared to children
who were vitamin D sufficient. (22) These findings demonstrate a progressive trend
towards increases in adiposity in children who are vitamin D insufficient/deficient and
further emphasize the inverse relationship of vitamin D status and increases in adiposity
(22). These findings suggest that perhaps maintaining adequate vitamin D status could be
a key to slowing or reversing incremental weight gain. Further studies on the influence of
both calcium and vitamin D levels in the pediatric population to assess their influence on
Nutrition Assessment in Children
Several methods are used to assess nutrient intake in children. Accurate
assessment of nutrient intake is challenging to achieve but necessary for usable outcomes
in studies. Traditional formats used in nutrient assessment include Food Frequency
Questionnaires (FFQ), which can be either long or short in length and can be self-
administered or conducted by a professional, 24 hour food recalls, 3 day dietary recalls,
observed food intake and weighted food inventories of varying lengths (27,28).
Observed food intakes and weighted food inventories, while accurate, can be time
consuming, expensive and difficult to administer due to the requirements of trained staff
and the need for equipment to administer in a large study population. Some methods,
such as the 24 hour recall and the 3 day food record are better suited for use in a large
study population because they are relatively quick and inexpensive to administer. The 24
hour recall is useful for providing information for the previous day but often exaggerates
estimates of nutrients, whereas a 3 day food record provides a better picture of habitual
dietary intake (27,29,30). For more specific nutrient information the use of a FFQ
designed to ask pointed questions specific to the nutrient and age group in a study can
also be an effective and inexpensive method to gather data. In 1995 Rockett and her
colleagues tested the reproducibility and validity of data obtained in specially designed
short FFQs (SFFQ) compared to an established long FFQ (LFFQ). The study produced
an abbreviated version of the LFFQ and included specific questions that considered not
only foods containing the nutrient but the format in which being consumed, i.e. snacks.
SFFQ were a reliable format to use when obtaining dietary nutrient intake data in a
13 Chapter III
Methods and Procedures
Participants
Study population is comprised of 296 healthy, pre-to-early adolescent, (6-14)
years old) African American and Caucasian children residing in Pittsburgh, PA. Subjects
were recruited from the Primary Care Center of the Children’s Hospital of Pittsburgh of
the University of Pittsburgh Medical Center (UPMC). Individuals excluded were those
being treated with anticonvulsants or systemic glucocorticoids or those having hepatic or
renal disease, malabsorptive disorders, cancer, disorders of vitamin D or calcium
metabolism, taking oral contraceptives or depot medoroxyprogesterone.
The study was conducted as part of Dr. Rajkumar’s National Institutes of
Health-funded (R03-K23 grants) vitamin D clinical research protocols whose objectives were to
assess the seasonal variation and racial differences in African American and Caucasian
children and refine the serum 25(OH)D thresholds for defining vitamin D insufficiency in
children. The study occurred in two phases: Phase I monitored the subjects for sunlight
exposure and vitamin D intake and was conducted in 2006-2008. Phase II randomly
assigned a vitamin D supplement (1000 IU D3) or placebo to the subjects and was
conducted between 2008 and 2011. Subjects enrolled in the randomized control trial
were either not taking a multi vitamin or willing to stop taking multivitamins for at least 1
were approved by the University of Pittsburgh Institutional Review Board and signed
parental informed consent and participants’ assent were obtained prior to enrollment.
Demographics, Anthropometrics and Sunlight Exposure
At baseline and 6 month follow-up, subjects were measured for age, height and
weight. BMI was calculated and classified as obese if age and gender based BMI was
>95th percentile. In addition to taking anthropometric measurements, a 21 question
Vitamin D and Sunlight Exposure Questionnaire (SEQ) was also administered at each
visit. Questions about ethnicity, race, supplements (multivitamin, vitamin D, calcium,
cod liver oil, and nutrition supplement drinks) with brand specification and their
frequency of consumption, and dairy consumption (includes portion and frequency of
milk, chocolate milk, cheese, yogurt), Vitamin D fortified orange juice, fish
consumption, and breakfast cereal consumption were included to estimate the amount of
vitamin D consumed through diet. Exposure to sunlight was addressed in 4 questions
with respect to how much time is spent outside each day, what area of the body is usually
exposed to the sun (face, hands, arms, legs), sunscreen application, and opportunities to
travel to sunny locations for holidays (Appendix A).
Vitamin D Intake
All subjects were asked to complete a FFQ at baseline and 6 months later. The
FFQ, titled Eating Survey, K-95-1, (Harvard Medical School, © 1995 Brigham and
Women’s Hospital) was analyzed at Brigham and Women’s Hospital. After processing
and analysis, nutrient intake data comprised 17 nutrients including total calories, dietary
calcium and vitamin D (Appendix B). Nutrition data from this FFQ were used for the
Data Analysis
Statistical analysis was performed using SPSS (version 18.0, SPSS, Inc; Chicago,
IL). Univariate frequency analysis was performed on the collected data to describe the
study population. Non-parametric methods were used as the data were found to be
skewed even with log transformation and removal of outliers. All data were expressed as
median (25%,75%). Kruskal-Wallis, Spearman’s Correlation, and Chi Square methods
were used to assess the statistical significance of an association between Vitamin D
intake status and BMI status change from baseline and 6 month follow-up. Vitamin D
intake was categorized to define status: intake of ≥400 IU was considered sufficient;
intake of <400 IU was considered insufficient. Change in BMI status was defined as any
change in the baseline BMI percentile category, whether positive or negative. A multiple
linear regression analysis was performed to explore the influence of various factors
(vitamin D intake, total energy intake, sun exposure, sunscreen use, race and gender) on
BMI status change. Additional multiple linear regression analysis were performed using
the same factors but participants were subdivided by race and gender. For all tests,
16 Chapter IV
Results
Demographics
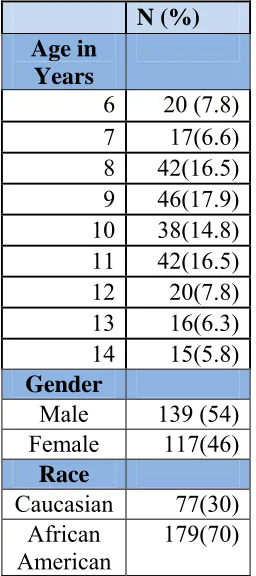
A total of 256 healthy, pre –to-early adolescents with a median age of 10 years
(range 6 to 14 years old) were enrolled in the study (Table 1). The majority of the
participants were African American (70%) and male (54%) (Table 1). Median
anthropometric measures of height, weight, and BMI increased from baseline to 6 month
follow up (Table 2).
Nutrient Intake
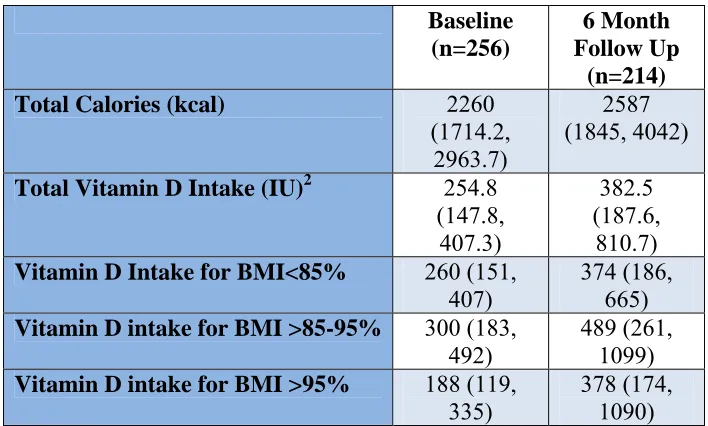
Median vitamin D intake was 245.8 IU at baseline with a slight increase to 382.5
IU at the 6 month follow up, both of which are under the American Academy of
Pediatrics 2008 recommendation of 400 IU per day (Table 3) (14). Median vitamin D
intake for subjects subdivided by BMI category (Normal, Overweight, and Obese) at
baseline revealed a significant difference with the lowest median intake (188 IU) reported
by the obese group (P=0.033) (Tables 2 and 3). The vitamin D intake reported at the 6
month follow-up visit by BMI category revealed that the normal weight group consumed
the lowest median intake (374 IU); however, this difference was not statistically
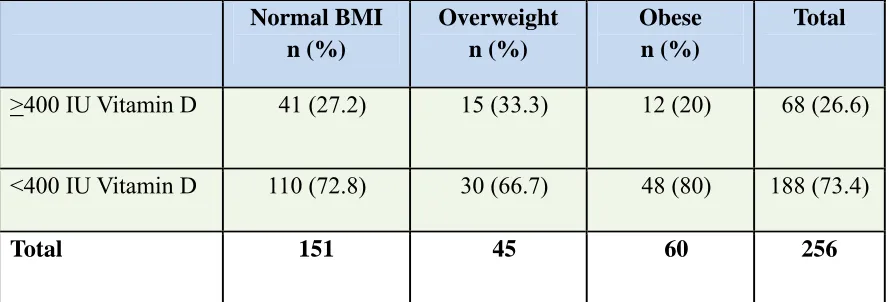
significant (P=0.435). Vitamin D intake status divided by BMI category at baseline
revealed that 73% of subjects consumed <400 IU and only 25% or that populations was
obese. Vitamin D intake status divided by BMI category at 6 month follow up revealed
and 50% of those subjects were considered obese. The statistical analysis at both time
periods revealed no significant associations. Total population median energy intake was
2260 kcal a day at baseline with a slight increase to 2587 kcal at 6 month follow up.
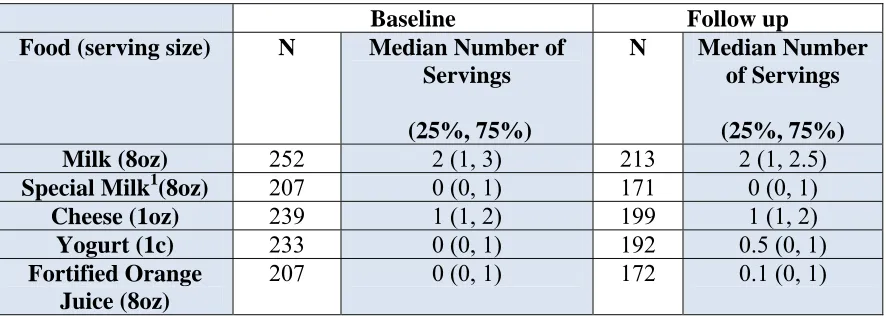
The FFQ revealed two major food sources for vitamin D in this population:
consumption of at least 2 glasses of milk (8oz) and 1 serving of cheese (1oz) per day at
baseline and 6 month follow up visit (Table 4). Intake of the other foods listed on the
questionnaire such as yogurt, fortified orange juice, and special milk was minimal.
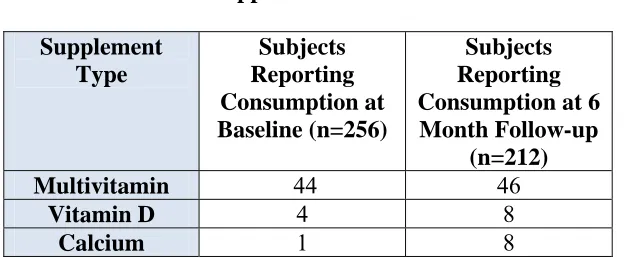
Approximately 20% of the total population reported taking a daily multivitamin and
<1% reported taking vitamin D or calcium supplements at both baseline and 6 month
follow up visits (Table 5).
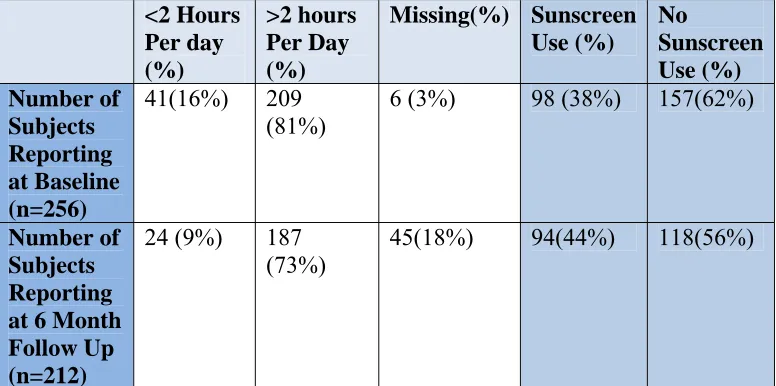
Sunlight Exposure
The majority of subjects reported sunlight exposure of > 2 hours/day with <50%
using sunscreens (Table 6). At baseline only 98 (38%) subjects reported sunscreen use
while 94 (44%) subjects reported use at 6 month follow up.
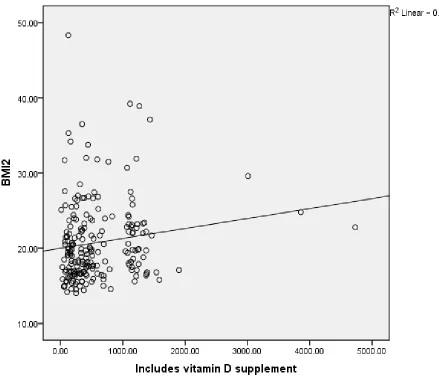
Influence of Vitamin D Intake on BMI Status
Although a relationship between vitamin D intake and BMI at the 6 month follow
up for the whole group was observed, the strength of the influence was extremely weak
(R=0.015, P =0.033) (Figure 1). Multi-factorial regression analysis revealed that the only
significant predictor of change in the 6 month follow up BMI was the subject’s baseline
BMI status (P<0.001). Gender, race, total energy, vitamin D intake, sunlight exposure
and sunscreen use did not influence change in BMI at 6 month follow up. After
subdividing the population by race and gender, the only significant predictor variable of
Analysis of the influence of adequate vitamin D intake on BMI status change in
all subjects showed that the group consumed <400 IU of vitamin D per day, 89.2%
maintained their baseline BMI status. In the same category, the subjects who
experienced change in BMI status (increase or decrease), only 8.1% showed an increase
and 2.7% showed a decrease (Figure 2 and Table 7). In the group who consumed ≥ 400
IU of vitamin D, 85.4% maintained their baseline BMI status, 9.7% increased and 4.9%
19 Chapter V
Discussion and Conclusion
Vitamin D Intake and BMI in the Total Population
The primary purpose of this study was to investigate an association between
vitamin D intake and BMI in African American and Caucasian children. We found a
weak but positive relationship between increasing BMI and increasing vitamin D intake.
This relationship is contradictory to the trend we expected to see between the variables.
The unanticipated weakness and direction of this correlation could be related to a myriad
of factors which include the short follow up period of the study which perhaps did not
allow enough time for significant change to occur and baseline BMI which is typically a
predictor of future BMI. Race and gender are other factors that could have influenced
this weakness because each subset has unique characteristics that affect vitamin D status
and weight.
Further exploration of the possible effect of some of these factors on our outcome
revealed that the only factor with significant influence on changes in follow up BMI was
the subject’s baseline BMI. This confirms results from previous studies by Whitaker et
al (31). They found that an obese BMI classification at 6 years of age made a person
50% more likely to be obese as an adult thereby indicating that current BMI can be a
predictor of future BMI status (31). This shows that current BMI can be a predictor of
change in BMI at 6 month follow up would not be likely without some drastic measures
such as dieting or extreme caloric intake.
The use of vitamin D intake as the sole predictor of BMI status in this study could
have had an effect on our outcomes. Our vitamin D intake data was compiled through
the use of a FFQ and a SEQ which included some vitamin D specific food questions and
relied on parent or subject recall for accuracy. The validity of data produced in these
types of surveys has been proven effective in previous studies but it should be noted that
there is room for error in actual food recall and therefore possible inaccurate nutrient
totals should be considered. Review of the literature reveals that in studies conducted on
the validity and reproducibility of nutrient intake data in FFQs indicated that there is
evidence of over and under reporting. Blom et al (32) reported that the frequency of
certain food groups like sweet snacks and meats were underestimated while other foods
such as fruits and vegetables were often overestimated. These trends suggest that
subjects are more likely to report what they felt would be the appropriate amount versus
recording their actual intake. In another such study Rockett and colleagues (30)
developed and subsequently administered a youth/adolescent questionnaire twice, one
year apart, on 179 children (9-18 years of age) to determine reproducibility of data. Their
findings differed from Blom et al (32) in that the data provided by the subjects were
consistent and did not show any bias towards under or over reporting of particular food
groups.
It should also be noted that the baseline overall median vitamin D intake for the
whole group in all BMI categories increased by at least 100 IU at the 6 month follow up
D (n=22) in the randomized group or a more likely explanation is heightened awareness
of the importance of vitamin D intake on the individual as a result of filling out the FFQ
at baseline which could result in greater consumption of vitamin D rich foods or the
over-estimation of intake. Interestingly median reported intakes for all vitamin D fortified
foods were almost exactly the same at baseline and 6 month follow up.
One way to overcome this possible inaccuracy is to use serum vitamin D
concentrations which could have provided a more accurate assessment of vitamin D
status at each visit. Total vitamin D intake is just one factor that would have an influence
on vitamin D status which can be affected by other lifestyle factors such as sun-exposure
and sunscreen use. A study by Wu and colleagues (33) showed that there was a highly
significant relationship between the vitamin D intake on the FFQ and serum vitamin D
status provided by the subjects thereby proving that the FFQ could be an effective tool
for assessing vitamin D status in winter months. It should be noted that their study
population included only Caucasian and Asian populations whereas ours was 70%
African American. We did use a validated FFQ that specifically addressed vitamin D
intake and in theory could say these vitamin D intake would relate to serum vitamin D
levels if they were available. Our study was not confined to one season of the year and
the variation of seasons would have an influence on the similarity of our subjects FFQ
intake data and serum vitamin D concentrations.
Because our population was comprised of 70% African Americans and was
conducted throughout the year, intake alone might not have provided the most accurate
assessment of vitamin D status. It should also be noted that the majority of our
Statistical analysis did not reveal a significant relationship between BMI and sunlight
exposure. This information would have been more useful if we were evaluating serum
vitamin D levels and compared FFQ vitamin D intake and sunlight exposure data to see if
there was a significant difference.
The only other factor that demonstrated a trend towards effecting BMI change at
6 month follow up was vitamin D intake. Further analysis of the influence of vitamin D
sufficiency on BMI change was done by dividing our study population by BMI category
(Normal, Overweight, and Obese) and median vitamin D intake (<400 IU insufficient;
>400 IU sufficient) and the results were surprising. At baseline the category with the
lowest vitamin D intake (188 IU) was the group that was considered obese, which was
expected. Interestingly, at 6 month follow up the category with the lowest median
vitamin D intake (374 IU) was the group that was considered normal. This outcome was
not anticipated and in fact is the opposite of trends that were reported in the literature
(20,21,24).
Relationship of BMI Change and Vitamin D Intake
Our analysis of the influence of adequate vitamin D intake on BMI status change
in all subjects revealed that among those who consumed adequate intake (≥400 IU) of
vitamin D, 85.4% maintained their baseline BMI status. This lack of change in the
overwhelming majority of the population is expected as any significant change in BMI
status in a 6 month time frame would likely be due to extreme measures such as strict
dieting, excess exercise or a growth spurt. Some subjects who consumed adequate
amounts of vitamin D did exhibit some BMI change; 9.7% showed an increase in BMI
statistically significant relationship between BMI change and vitamin D intake. For the
subjects who consumed <400 IU of vitamin the results are similar in that 89.2% of
subjects maintained their BMI status. Only 8.1% demonstrated a BMI increase and 2.7%
had a BMI decrease. The percentage of individuals who experienced a reduction in BMI
status in the group who had adequate vitamin D intake was higher (4.9%) than in the
group who had inadequate intake (2.7%) which was what we expected, however,
analysis did not reveal any statistical significance
Conclusion
The results of our study do not support a strong relationship between vitamin D
intake assessed through FFQ and BMI change over a 6 month time frame. Perhaps a
study of longer duration that utilized serum vitamin D status is needed to observe a more
24 Table 1
Demographics: Characteristics of Study Sample
N (%) Age in
Years
6 20 (7.8) 7 17(6.6) 8 42(16.5) 9 46(17.9) 10 38(14.8) 11 42(16.5) 12 20(7.8) 13 16(6.3) 14 15(5.8) Gender
Male 139 (54) Female 117(46)
Race
Caucasian 77(30) African
25 Table 2 Anthropometrics:
Measurements of Study Sample
Characteristic Baseline 6 Month
Follow Up
Change
Height (cm) 139.6
(130.5,150.4) (133.5, 142 155.2)
+2.4
Weight (kg) 36.8
(30,48.7)
40.2 (31.9, 53.22)
+3.4
BMI (g/kg2) 18.9
(16.6, 22.3)
19.5 (16.9,
22.9)
+0.63
BMI <85% 151 (59%) 118(56%) -33
BMI>85%-95% 45 (18%) 38 (18%) -7
BMI>95% 60(23%) 56(26%) -4
26 Table 3
Vitamin D and Energy Intake at Baseline and 6 Month Follow Up
Divided by BMI Category1
Baseline (n=256)
6 Month Follow Up
(n=214)
Total Calories (kcal) 2260
(1714.2, 2963.7)
2587 (1845, 4042)
Total Vitamin D Intake (IU)2 254.8
(147.8, 407.3)
382.5 (187.6,
810.7)
Vitamin D Intake for BMI<85% 260 (151,
407)
374 (186, 665)
Vitamin D intake for BMI >85-95% 300 (183,
492)
489 (261, 1099)
Vitamin D intake for BMI >95% 188 (119,
335)
378 (174, 1090)
1
All values are expressed as Median (25%, 75%)
2
27 Table 4
Median Daily Vitamin D Fortified Food Intake
Baseline Follow up
Food (serving size) N Median Number of
Servings
(25%, 75%)
N Median Number
of Servings
(25%, 75%)
Milk (8oz) 252 2 (1, 3) 213 2 (1, 2.5)
Special Milk1(8oz) 207 0 (0, 1) 171 0 (0, 1)
Cheese (1oz) 239 1 (1, 2) 199 1 (1, 2)
Yogurt (1c) 233 0 (0, 1) 192 0.5 (0, 1)
Fortified Orange Juice (8oz)
207 0 (0, 1) 172 0.1 (0, 1)
1
28 Table 5
Supplement Intake
Supplement Type
Subjects Reporting Consumption at Baseline (n=256)
Subjects Reporting Consumption at 6 Month Follow-up
(n=212)
Multivitamin 44 46
Vitamin D 4 8
29 Table 6
Sun Exposure Reported in Sunlight Exposure Questionnaire (SEQ)
<2 Hours Per day (%) >2 hours Per Day (%) Missing(%) Sunscreen Use (%) No Sunscreen Use (%) Number of Subjects Reporting at Baseline (n=256)
41(16%) 209
(81%) 6 (3%) 98 (38%) 157(62%)
Number of Subjects Reporting at 6 Month Follow Up (n=212)
24 (9%) 187
30 Table 7
Vitamin D Intake Status by BMI Status Baseline and 6 Month Follow Up
Baseline Normal BMI n (%) Overweight n (%) Obese n (%) Total
>400 IU Vitamin D 41 (27.2) 15 (33.3) 12 (20) 68 (26.6)
<400 IU Vitamin D 110 (72.8) 30 (66.7) 48 (80) 188 (73.4)
Total 151 45 60 256
6 Month Follow up
Normal BMI n (%) Overweight n (%) Obese n (%) Total
>400 IU Vitamin D 55 (46.2) 20 (52.6) 28 (49.1) 103 (48.1)
<400 IU Vitamin D 64 (53.8) 18 (47.4) 29 (50.9) 111 (51.9%)
31 Figure 1
Regression Analysis of Vitamin D Intake and BMI at 6 Month Follow up
32 85.4%
9.7% 4.9%
>400
IU
Vitamin
D
No Change BMI
BMI Increased
BMI Decreased
89.2% 8.1%
2.7%
<400
IU
Vitamin
D
No Change BMI
BMI Increased
[image:44.612.43.577.248.541.2]BMI Decreased
Figure 2
33
REFERENCES
1. Bell J, Rogers V, Dietz, W, Ogden C, Schuler C, Popovic T. CDC Grand Rounds: Childhood Obesity in the United States. Available at:
http://www.cdc.gov/mmwr/preview/mmwrhtml/mm6002a2.htm?s_cid=mm6002a2_w [Accessed March 2, 2012].
2. Obesity and Overweight for Professionals: Childhood: Basics | DNPAO | CDC. Available at: http://www.cdc.gov/obesity/childhood/basics.html [Accessed March 2, 2012].
3. QuickStats: Prevalence of Overweight* and Obesity† Among Youths Aged 6--19 Years, by Race/Ethnicity and Sex --- National Health and Nutrition Examination Survey, United States, 2007--2008. Available at:
http://www.cdc.gov/mmwr/preview/mmwrhtml/mm5940a7.htm?s_cid=mm5940a7_w [Accessed March 2, 2012].
4. Anderson PM, Butcher KE. Childhood obesity: trends and potential causes. Future Child. 2006;16(1):19–45.
5. Rosenblum JL, Castro VM, Moore CE, Kaplan LM. Calcium and vitamin D supplementation is associated with decreased abdominal visceral adipose tissue in overweight and obese adults. Am. J. Clin. Nutr. 2012;95(1):101–108.
6. Mai X-M, Chen Y, Camargo CA Jr, Langhammer A. Cross-Sectional and Prospective Cohort Study of Serum 25-Hydroxyvitamin D Level and Obesity in Adults: The HUNT Study. American Journal of Epidemiology. 2012. Available at:
http://www.ncbi.nlm.nih.gov/pubmed/22312120 [Accessed March 10, 2012].
7. Soares MJ, Murhadi LL, Kurpad AV, Chan She Ping-Delfos WL, Piers LS.
Mechanistic roles for calcium and vitamin D in the regulation of body weight. Obesity Reviews: An Official Journal of the International Association for the Study of Obesity. 2012. Available at: http://www.ncbi.nlm.nih.gov/pubmed/22385576 [Accessed March 10, 2012].
8. Gordon CM, DePeter KC, Feldman HA, Grace E, Emans SJ. Prevalence of Vitamin D Deficiency Among Healthy Adolescents. Arch Pediatr Adolesc Med. 2004;158(6):531– 537.
9. Holick MF. The D-lightful vitamin D for child health. JPEN J Parenter Enteral Nutr. 2012;36(1 Suppl):9S–19S.
11. Holick MF, Binkley NC, Bischoff-Ferrari HA, Gordon CM, Hanley DA, Heaney RP, Murad MH, Weaver CM. Evaluation, treatment, and prevention of vitamin D deficiency: an Endocrine Society clinical practice guideline. J. Clin. Endocrinol. Metab.
2011;96(7):1911–1930.
12. Shils ME, Shike M, Ross AC, Caballero B, Cousins RJ eds. Modern Nutrition in Health and Disease (Modern Nutrition in Health & Disease. Tenth. Lippincott Williams & Wilkins; 2005.
13. Rajakumar K, Holick MF, Jeong K, Moore CG, Chen TC, Olabopo F, Haralam MA, Nucci A, Thomas SB, Greenspan SL. Impact of season and diet on vitamin D status of African American and Caucasian children. Clin Pediatr (Phila). 2011;50(6):493–502.
14. Wagner CL, Greer FR. Prevention of rickets and vitamin D deficiency in infants, children, and adolescents. Pediatrics. 2008;122(5):1142–1152.
15. Anonymous. Second National Report on Biochemical Indicators of Diet and Nutrition in the US Population 2012. Available at:
http://www.cdc.gov/nutritionreport/pdf/Nutrition_Book_complete508_final.pdf.
16. Anne C. Looker, Ph.D.; Clifford L. Johnson, M.P.H.; David A. Lacher, M.D.;
Christine M. Pfeiffer, Ph.D.; Rosemary L. Schleicher, Ph.D.; and Christopher T. Sempos, Ph.D. NCHS Data Brief, Vitamin D Status: United States, 2001-2006. Available at: http://www.cdc.gov/nchs/data/databriefs/db59.htm [Accessed July 18, 2012].
17. Bailey RL, Dodd KW, Goldman JA, Gahche JJ, Dwyer JT, Moshfegh AJ, Sempos CT, Picciano MF. Estimation of total usual calcium and vitamin D intakes in the United States. J. Nutr. 2010;140(4):817–822.
18. Fulgoni V 3rd, Nicholls J, Reed A, Buckley R, Kafer K, Huth P, DiRienzo D, Miller GD. Dairy consumption and related nutrient intake in African-American adults and children in the United States: continuing survey of food intakes by individuals 1994-1996, 1998, and the National Health And Nutrition Examination Survey 1999-2000. J Am Diet Assoc. 2007;107(2):256–264.
19. Rajakumar K, Holick MF, Jeong K, Moore CG, Chen TC, Olabopo F, Haralam MA, Nucci A, Thomas SB, Greenspan SL. Impact of season and diet on vitamin D status of African American and Caucasian children. Clin Pediatr (Phila). 2011;50(6):493–502.
20. Dong Y, Pollock N, Stallmann-Jorgensen IS, Gutin B, Lan L, Chen TC, Keeton D, Petty K, Holick MF, Zhu H. Low 25-hydroxyvitamin D levels in adolescents: race, season, adiposity, physical activity, and fitness. Pediatrics. 2010;125(6):1104–1111.
22. Alemzadeh R, Kichler J, Babar G, Calhoun M. Hypovitaminosis D in obese children and adolescents: relationship with adiposity, insulin sensitivity, ethnicity, and season. Metab. Clin. Exp. 2008;57(2):183–191.
23. Harel Z, Flanagan P, Forcier M, Harel D. Low Vitamin D Status Among Obese Adolescents: Prevalence and Response to Treatment. Journal of Adolescent Health. 2011;48(5):448–452.
24. Rodriguez-Rodriguez E, Navia-Lomban B, Lopez-Sobaler AM, Ortega RM.
Associations between abdominal fat and body mass index on vitamin D status in a group of Spanish schoolchildren. Eur J Clin Nutr. 2010;64(5):461–467.
25. Rajakumar K, de las Heras J, Chen TC, Lee S, Holick MF, Arslanian SA. Vitamin D status, adiposity, and lipids in black American and Caucasian children. J. Clin.
Endocrinol. Metab. 2011;96(5):1560–1567.
26. Gilbert-Diamond D, Baylin A, Mora-Plazas M, Marin C, Arsenault JE, Hughes MD, Willett WC, Villamor E. Vitamin D deficiency and anthropometric indicators of
adiposity in school-age children: a prospective study. Am. J. Clin. Nutr. 2010;92(6):1446–1451.
27. Rockett HRH, Breitenbach M, Frazier AL, Witschi J, Wolf AM, Field AE, Colditz GA. Validation of a Youth/Adolescent Food Frequency Questionnaire. Preventive Medicine. 1997;26(6):808–816.
28. Roman‐Viñas B, Ortiz‐Andrellucchi A, Mendez M, Sánchez‐Villegas A, Quintana LP, Aznar LAM, Hermoso M, Serra‐Majem L. Is the food frequency questionnaire suitable to assess micronutrient intake adequacy for infants, children and adolescents? Maternal & Child Nutrition. 2010;6(s2):112–121.
29. Rockett HRH, Wolf AM, Colditz GA. Development and reproducibility of a food frequency questionnaire to assess diets of older children and adolescnts. Journal of the American Dietetic Association. 1995;95(3):336–336.
30. Rockett HRH, Berkey CS, Colditz GA. Comparison of a short food frequency
questionnaire with the Youth/Adolescent Questionnaire in the Growing Up Today Study. Int J Pediatr Obes. 2007;2(1):31–39.
31. Whitaker RC, Wright JA, Pepe MS, Seidel KD, Dietz WH. Predicting obesity in young adulthood from childhood and parental obesity. N. Engl. J. Med.
1997;337(13):869–873.
32. Blom L, Lundmark K, Dahlquist G, Persson LA. Estimating children’s eating habits. Validity of a questionnaire measuring food frequency compared to a 7-day record. Acta Paediatr Scand. 1989;78(6):858–864.
37 APPENDICES
Appendix Page
A. Vitamin D & Sunlight Exposure Questionnaire 38
B. Eating Survey, K-95-1
1
Table 1. Vitamin D & Sunlight Exposure Questionnaire*
Subject ID: __________ Subject Initials: __________ Interview Date: __________
1. Date of Birth: ___________
2. What is your child’s age: ___________
3. Height (cm): ___________
4. Weight (kg): ___________
5. Ethnic Group: Is your child Hispanic or Latino?
Yes No Unknown/Declined to answer
6. Race: what do you consider your child’s race to be?
American Indian/ Alaskan Native Asian American
Native Hawaiian/ Pacific Islander Black or African American
White or Caucasian More than one race
7. Does your child take a multivitamin? Yes No
If yes,
Specific brand (s):
How often does he/she take the Multivitamin?
8. Does your child take a calcium supplement? Yes No
If yes,
Specific brand (s):
How often does he/she take the Calcium supplement?
9. Does your child take a vitamin D supplement? Yes No If yes,
Specific brand (s):
How often does he/she take the Vitamin D supplement?
10. Does your child take Cod Liver Oil? Yes No If yes,
2
11. On average, how many glasses (8 ounce/glass) of milk does your child drink per day?
12. Besides milk, does your child drink/eat other dairy foods that may have been fortified with vitamin D?
If yes,
How many glasses (8ounce/glass) of Soymilk or Lactaid® milk or Chocolate milk does your child drink per day?
How many servings of cheese (1 ounce or 1 slice/serving) does your child eat per day?
How many servings (1 cup/serving) of yogurt does your child eat per day?
13. Does your child drink vitamin D-fortified orange juice?
If yes,
How many glasses (8 ounce/glass) of vitamin D fortified orange juice does your child drink per day? ______
14. On average, how many times per month does your child eat the following foods?
None (0) 1x/ month 2x/ month 3x/ Month 4x/ month
More than 4 times/month 14a Baked/fried fish
14b Lox (cured salmon)
14c Herring
14d Salmon
14e White fish
14f Sardines
14g Mackerel
14h Dried Mushrooms
15. Does your child drink a nutrition supplement like Ensure®, PediaSure® or Carnation® Instant Breakfast? Yes No
If yes,
How many servings (8 ounces or 1 package/serving) per day: Specify brand(s): _____________
16. Does your child eat breakfast cereal? Yes No
If yes,
3
17. Does your child eat breakfast bars or protein bars? Yes No If yes,
How many servings (1 bar/serving) per week: Specify brand(s): ____________
18. On average in the summer how many hours per day does your child spend outside in the sun each day?
2 hours or less More than 2 hours
If more than 2 hours, how many hours: _________________________
19. When your child spends time outside, which of the following body parts are usually exposed?
19a. Face ……… Yes No
19b. Hands ……… Yes No
19c. Arms ……… Yes No
19d. Legs ……… Yes No
20. Do you apply sunscreen on your child when he or she goes outside? Yes No
If yes,
20a. What brand (s) do you use?
20b. What SPF (Sun Protection Factor) do you use? 20c. How often do you use sunscreen on your child?
Often Sometimes Seldom
21. Did your child travel to a sunny location for a holiday? Yes No If yes,
21a. Where did your child visit:
21b. When last did your child travel: _______ year ________ month ________
21c. How many days did your child spend in the sunny location: ____________
*Adapted from Dr. Michael Holick’s vitamin D questionnaire
Vitamin D content of foods used in nutrient analysis:
Multivitamin (each, if specific brand not listed) 400 IU
Cod liver oil (tsp) 453 IU
Milk (8 oz) 124 IU
Soy milk (8 oz ) 114 IU
Lactaid® milk (8 oz) 100 IU
Chocolate milk (8 oz) 128 IU
Cheese (1 oz) 6 IU
Vitamin D fortified orange juice (8 oz) 100 IU
4
Lox (1 oz) 119 IU
Herring (3 oz) 182 IU
Salmon (3 oz) 233 IU
Whitefish (3 oz) 130 IU
Sardines (3 oz) 164 IU
Mackerel (3 oz) 88 IU
Dried mushrooms (3 oz) 146 IU