www.hydrol-earth-syst-sci.net/14/383/2010/ © Author(s) 2010. This work is distributed under the Creative Commons Attribution 3.0 License.
Earth System
Sciences
Spatial mapping of leaf area index using hyperspectral remote
sensing for hydrological applications with a particular focus on
canopy interception
H. H. Bulcock and G. P. W. Jewitt
School of Bioresources Engineering and Environmental Hydrology, University of KwaZulu-Natal, Pietermaritzburg, South Africa
Received: 2 June 2009 – Published in Hydrol. Earth Syst. Sci. Discuss.: 14 September 2009 Revised: 18 February 2010 – Accepted: 19 February 2010 – Published: 25 February 2010
Abstract. The establishment of commercial forestry
plan-tations in natural grassland vegetation, results in increased transpiration and interception which in turn, results in a streamflow reduction. Methods to quantify this impact typi-cally require LAI as an input into the various equations and process models that are applied. The use of remote sensing technology as a tool to estimate leaf area index (LAI) for use in estimating canopy interception is described in this paper. Remote sensing provides a potential solution to effectively monitor the spatial and temporal variability of LAI. This is illustrated using Hyperion hyperspectral imagery and three vegetation indices, namely the normalized difference vege-tation index (NDVI), soil adjusted vegevege-tation index (SAVI) and Vogelmann index 1 to estimate LAI in a catchment af-forested with Eucalyptus, Pinus and Acacia genera in the KwaZulu-Natal midlands of South Africa. Of the three veg-etation indices used in this study, it was found that the Vogel-mann index 1 was the most robust index with anR2and root mean square error (RMSE) values of 0.7 and 0.3 respectively. However, both NDVI and SAVI could be used to estimate the LAI of 12 year old Pinus patula accurately. If the intercep-tion component is to be quantified independently, estimates of maximum storage capacity and canopy interception are re-quired. Thus, the spatial distribution of LAI in the catchment is used to estimate maximum canopy storage capacity in the study area.
Correspondence to: H. H. Bulcock ([email protected])
1 Introduction
To the water resources planner who is ultimately interested in the amount of water available, the vegetation canopy is a barrier for precipitation to cross before reaching the soil and possibly making its way to the river or dam (Davies, 2003). In South Africa, it has been estimated that commer-cial forestry uses about 5% of the total available water sup-ply (GCIS, 2007). By virtue of their physiology, extent of coverage and location in the high rainfall catchment areas of South Africa, commercially grown tree species impact on the hydrological resources of the country with an even more significant impacts at smaller spatial and temporal scales. Between 1986 and 1998, the area under forestry in South Africa increased by 27% to 1.44×10⁶ha, which constitutes 1.18% of the arable land (Gush, 2000), but is reported to have decreased to approximately 1.27×10⁶ha over the past five years, because of fire and withdrawal of some land from production (Godsmark, 2008).
Vegetation cover or land cover influences hydrological processes in many ways. Interception and transpiration is a loss or sink term in the water balance of a catchment, and evaporation and transpiration losses have been shown to in-fluence downwind rainfall at regional scales (Shultz and En-gman, 2000). Forest stand description typically includes fac-tors related to the eco-physiological processes responsible for forest growth. One of those factors is the stand leaf area index (LAI). LAI is related to processes such as canopy inter-ception, transpiration, photosynthesis, and leaf litterfall, and used as an input to various ecosystem and hydrological mod-els (Sprintsin et al., 2007) such as the ACRU Agrohydrolog-ical model (Schulze, 1995), the 3PG model (Landsberg and
384 H. H. Bulcock and G. P. W. Jewitt: Spatial mapping of leaf area index Waring, 1997) and SIMPLE model (H¨ormann, 2007).
Ne-mani et al. (1993) found that LAI varies with microclimate and soil water conditions. In their study, hilltops showed a lower LAI owing to less available water and therefore more stress, while the bottom of hill slopes had more wa-ter, less stress, higher temperatures, possibly more nutrients, and therefore higher LAI values.
Accurate monitoring and assessment of water resources is necessary for sustained water resource management. Earth observation data have formed the basis for acquiring data remotely for many years (Landgrebe, 1999) and are now viewed as a time and cost-effective way to undertake large-scale monitoring (Okin et al., 2001). Remote sensing has been widely recognised as a valuable tool for the detection and analyses of data, both spatially and temporally, with sig-nificant advantages over point sources (Bongonko, 2005) and is becoming increasingly useful in southern Africa, where components of the hydrological cycle, such as rainfall, evap-oration, plant water use and runoff show great variation in both time and space (Jewitt, 2002), and where traditional monitoring is extremely limited. The past decade has seen a particularly rapid increase in the number of launched satel-lites, as well as an improvement in both spatial and spec-tral resolution of data they produce. The planned launch of several new satellites will lead to further improvements in the quality of remotely sensed data (Dye et al., 2002). The ability to rapidly assess LAI using vegetation indices (VIs) from remotely sensed imagery provides a means to rapidly assess stand productivity over a wide geographic area. There are a growing number of studies that are using hyperspec-tral remote sensing to estimate the LAI of forest and crop canopies such as those by Delegido et al. (2008), Haboudane et al. (2004) and Zhang et al. (2005). In addition to pro-viding alternative means to estimate forest productivity in the long term, this approach may complement existing ap-proaches aimed at estimating water use of various crops in fulfilment of the National Water Act of 1998. The Act makes provision for the classification of various crops and land use practices as streamflow reduction activities (SFRA), which are then subject to controls to ensure equity in water allo-cation (Ghebremicael et al., 2004). Current tools to assess water use by commercial afforestation tend to focus on total evaporation and are limited in their consideration of intercep-tion from forest canopies as a separate process.
In this study, data from the Hyperion sensor on board the EO-1 satellite, the first hyperspectral sensor to operate from space was used to estimate LAI in a small afforested catchment in the KwaZulu-Natal Midlands of South Africa. The satellite estimates were verified using measurements ob-tained from the field site using a handheld LI-COR LAI-2000 plant canopy analyzer. The information from this analysis was then used to map interception storage capacity over the same area. Ultimately, this approach will provide for bet-ter spatial estimation of canopy inbet-terception, which is a little studied aspect of forest water use in South Africa.
2 Canopy interception and leaf area index
Interception is one of the most neglected and underestimated processes in rainfall-runoff analysis. Some models disregard it completely, based on the assumption that it is generally a small portion of the total evaporation (Savenije, 2004). How-ever, Beven (2001) states that evaporation from intercepted water on leaf surfaces in rough canopies can be very effi-cient and could form a significant component of the total wa-ter balance in some environments. In a forest with a closed canopy, the interception of precipitation is a major compo-nent of the influence that forests exert on the hydrological cycle (Jewitt, 2005) and may be simply defined as the dif-ference between gross rainfall and net rainfall (net rainfall being the sum of stemflow and throughfall). A broader defi-nition by Savenije (2004) is that interception accounts for the part of the rainfall that is captured before it can take part in the subsequent runoff and sub-surface processes. This defi-nition is more useful for hydrological modelling, where the focus is surface runoff, the soil moisture budget, transpira-tion, recharge and ground water processes.
Interception loss from forests depends on the atmospheric conditions that drive evaporation and rainfall characteristics, but also the nature and density of the forest stand. This de-pends on the tree physiology, but also management practice and the age of the trees, older trees have denser canopies and correspondingly higher canopy storage, and higher intercep-tion loss than younger trees (Jewitt, 2005). The dependence of the storage capacity on the LAI is highlighted by con-sidering Eq. (1) developed by von Hoyningen-Huene (1981) which is still recognised as an accurate, non-crop specific estimate of maximum storage capacity (Scmax) (mm) as high-lighted by Kozak et al. (2007).
Smaxc =0.935+0.498(LAI)−0.00575(LAI2) (1) The subsequent process of throughfall is the water that falls to the ground either directly through gaps in the canopy, or indirectly by having dripped off leaves, stems and branches after the storage capacity has been reached. The amount of direct throughfall and, conversely indirect throughfall is controlled by the canopy coverage (c), a mea-sure of which is the LAI (Davies, 2003).
Van Dijk and Bruijnzeel (2001a, b) modified the well-known Gash et al. (1995) revised model allowing it to be applied to rapidly growing vegetation where the LAI is changing through time. For this model, LAI is defined as the cumulative one-sided area of (healthy) leaves per unit area. LAI and c, can be related to one another via the Beer-Lambert equation which describes the attenuation of radiation (i.e. photosynthetically active radiation, PAR) as a function of LAI. PAR however, does not penetrate far through leaves, therefore the Beer-Lambert equation may be expressed in terms of canopy cover fraction using similar
H. H. Bulcock and G. P. W. Jewitt: Spatial mapping of leaf area index 385
Figure 1. Location of Mistley-Canema Estate in KwaZulu-Natal, South Africa.
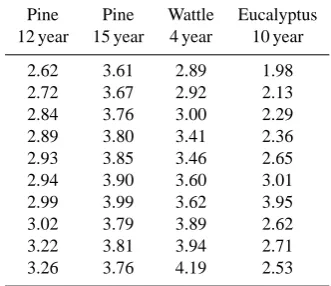
Table 1. LAI measurements taken with the LI-COR LAI 2000 canopy analyzer in four
commercial forest stands at Mistley-Canema on 21 June 2007 at 4:30pm on a clear and sunny
day, used for model validation.
Pine
12year
Pine
15year
Wattle
4year
Eucalyptus
10year
2.62
3.61
2.89
1.98
2.72
3.67
2.92
2.13
2.84
3.76
3.00
2.29
2.89
3.80
3.41
2.36
2.93
3.85
3.46
2.65
2.94
3.90
3.60
3.01
2.99
3.99
3.62
3.95
3.02
3.79
3.89
2.62
3.22
3.81
3.94
2.71
[image:3.595.98.494.62.325.2]3.26
3.76
4.19
2.53
Fig. 1. Location of Mistley-Canema Estate in KwaZulu-Natal, South Africa.
parameters. The relationship betweencand LAI is thus given by Eq. (2).
c=1−e−K.LAI (2)
whereK is the extinction coefficient. The value ofK for a particular radiation wavelength depends on the inclination angle and distribution of the leaves, and for PAR usually ranges between 0.6 and 0.8 in forests (van Dijk and Brui-jnzeel, 2001a, b).
The water that is retained on the leaves is then evapo-rated from the wet canopy surface, which has been found to evaporate at rates in excess of available net radiation and potential evaporation because of advection and the low aero-dynamic resistance of wet canopies (Schulze, 1995; Davids et al., 2005). Equation (3) provides a conservative estimate of enhanced wet canopy evaporation rate,Ew (mm day−1) (Schulze, 1995), which incorporates LAI as a governing pa-rameter.
Ew=Er(0.267LAI+0.33) for LAI>2.7 (3) where:Er– A-pan equivalent reference potential evaporation (mm day−1), LAI – Leaf area index (dimensionless)
By implication, wet canopy evaporation proceeds at a rate of 1.67 times that of potential evaporation for LAI=5.
Considering canopy interception is dependant on the storage capacity (Sc), canopy cover (c) and wet canopy evaporation (Ew), all of which are related to the LAI. Von Hoyningen-Huene (1983) in Schulze (1995) developed
Eq. (4) based on extensive research conducted on a num-ber of agricultural crops and related their interception loss (mm day−1)to gross daily rainfall (Pg) and LAI as:
Il=0.30+0.27Pg+0.13LAI−0.013Pg2
+0.0285Pg.LAI−0.007LAI2. (4)
The LAI and gross precipitation are used as the canopy structure and climatic descriptors respectively. Al-though the equation was developed for agricultural crops, Schulze (1995) found that the equation performed well on Pinus patula, and therefore it was deduced that the Von Hoyningen-Huene approach has potentially widespread ap-plication and is encouraged as the interception loss estimator in the ACRU agrohydrological model (Schulze, 1995).
3 Methodology 3.1 Site description
The Mistley-Canema estate is situated in the Seven Oaks district in the KwaZulu-Natal Midlands, South Africa as shown in Fig. 1. According to Camp (1997) the South African Bioresource Group (BRG) is “moist midlands mist-belt”. The climate is humid, with an annual rainfall ranging from 800mm to 1280 mm per annum and the mean annual temperature is 17◦C. The natural vegetation of the area was previously indigenous Themeda triandra grassland. Only a few relic patches of Themeda triandra grassland remain, as
386 H. H. Bulcock and G. P. W. Jewitt: Spatial mapping of leaf area index the high potential of the arable areas has meant that little
value has been placed on the natural vegetation. Commercial afforestation has long been practiced in the area and is the most widespread land use, with gum (Eucalyptus), pine (Pi-nus) and wattle (Acacia) being the species of choice. Sugar-cane is also grown at sites where drainage of cold air is good, ensuring that no frost or only light frost occurs (Everson et al., 2006).
3.2 Hyperion hyperspectral satellite
Hyperspectral images acquire many, very narrow, contigu-ous spectral bands, covering the visible, near-infrared, mid-infrared, and thermal infrared regions of the electromagnetic spectrum, allowing for the construction of an almost contin-uous spectrum for every pixel in the scene. The Hyperion sensor on board the EO-1 satellite was the first hyperspec-tral sensor to operate from space and orbits at an altitude of 705 km. This sensor has a spectral resolution of 10 nm and covers 242 bands from 380–2500 nm. The spatial reso-lution of the image is 30 m and the swath width of an image is 7.5 km. The Hyperion data used in this study were acquired on 21 July 2006 (Govender et al., 2007).
3.3 LAI measurement and model development
The LI-COR LAI-2000 plant canopy analyzer (LAI-2000, LI-COR, Inc., Lincoln, Nebraska, USA) was used to measure plantation forest LAI in each of the three tree species. Due to the height of the trees, it was not possible to take measure-ments above the canopy. Thus the “remote mode” method was used, i.e. two control units are used to log the above and below canopy readings respectively. At each of the four study sites (i.e. 12 year old pine, 15 year old pine, 4 year old wattle and 10 year old eucalyptus) ten sets of four reading were taken at each plot for model development and then re-peated for model validation. Each of the points were taken at random beneath the canopy. A separate syncronised instru-ment was located in an open area and was taking readings every 15 s, representing the above canopy readings. Dur-ing the data processDur-ing stage the above and below canopy readings were compared to determine the fraction of light transmitted or absorbed by the canopy. A sunlit canopy was avoided by taking readings just before sunset when the solar elevation is low (below 45◦). A 45◦ view lens was used to restrict the view of the sensor. The models were developed by overlaying the points where the LAI readings were taken on the images that had been corrected with each of the three vegetation indices (i.e. NDVI, SAVI and Vogelmann 1). The pixel values for each point were then extracted and related to its corresponding LAI value. A linear regression model was then fitted to the data using Microsoft® Excel 2003.
3.4 Atmospheric correction of Hyperion image
Atmospheric correction is a pre-processing procedure that is undertaken to compensate for the effects of atmospheric par-ticles through absorption and scattering of the radiation. The objective of performing an atmospheric correction is to re-trieve the surface reflectance from the remotely sensed im-age by removing atmospheric effects. The conversion in-volved the removal of atmospheric absorptions and scattering as well as removal of the shape of the solar irradiance spec-trum. Atmospheric and radiometric corrections were per-formed using the ENVI 4.3 remote sensing software pack-age using the empirical line method of atmospheric correc-tion. This method compares radiance values reflected from the surface to reflectance values measured on the ground with a calibrated hand-held spectrometer (Research Systems Inc., 2005). Using several ground truth data targets, the re-lationship between radiance at sensor and reflectance on the ground can be extracted. Since the effect of the atmosphere is multiplicative (by gasses) and additive (by aerosols) linearity is assumed in each wavelength (i.e. image layer) and a gain and offset are used as estimates of these atmospheric effects on radiance. After calculating these for all wavelengths, the gains and offsets could be applied to the image as a whole and the reflectance in all pixels can be estimated.
3.5 Vegetation indices
The relation between remotely sensed measurements and vegetation parameters is captured by various vegetation in-dices. A vegetation index is defined as a mathematical com-bination of channels or bands that indicates the presence or condition of green vegetation (Lillesand and Kiefer, 1999). Much work has centered on seeking correlations between various plant canopy attributes and a variety of vegetation indices (Dye et al., 2002). The most commonly used veg-etation indices utilize the information contained in the red and near infrared reflectances; either as ratios or differences (Dye et al., 2002). Live green plants absorb solar radiation in the photosynthetically active radiation (PAR) spectral re-gion (between 400 and 700 nm), which they use as a source of energy in the process of photosynthesis. Leaf cells have also evolved to scatter (i.e. reflect and scatter) solar radiation in the near-infrared (NIR) region (700 to 1300 nm) because the energy is not sufficient to synthesize organic molecules. If the plant absorbed strongly in the NIR, the result would be that the plant would overheat (Gates, 1980). Vegetation indices are routinely used to determine green biomass, green leaf area, LAI, stand biomass, percent ground cover, amount of photosynthetically active vegetation, photosynthesis activ-ity and productivactiv-ity (Baret and Guyot, 1991). Hundreds of vegetation spectral indices have been reported in the litera-ture, but few are commonly used and have been tested in dif-ferent vegetation studies. Near infrared/Red (NIR/R) spec-tral band ratios such as the Soil Adjusted Vegetation Index
(SAVI), Eq. (5) and Normalized Difference Vegetation Index (NDVI), Eq. (8) are widely used to estimate LAI over large areas.
The SAVI is expressed as follows: SAVI=(1+L)(NIR−R)
NIR+R+L (5)
whereL=0.5, and is an adjustment factor to minimize the backscatter effect of soil background reflectance through the canopy.
According to Schultz and Engman (2000), LAI is related to SAVI as follows:
SAVI=c1−c2e−c3.LAI (6)
where:
c1=0.69; c2=0.59; c3=0.91
Therefore: LAI=−ln(SAVI+0.371)
0.48 (7)
The Normalized Difference Vegetation Index (NDVI) is one of the oldest, most well known, and most frequently used VIs having been used to study vegetation and phenology since the early 1970’s. The combination of its normalized difference formulation and use of the highest absorption and reflectance regions of chlorophyll make it robust over a wide range of conditions and because it minimises the effects of topography, no prior knowledge of the ground conditions are required, and it is sensitive to the photosynthetically active vegetation (McGwire et al., 2000). It can, however “saturate” in dense vegetation conditions when LAI becomes high. Sat-uration occurs when the vegetation index value no longer in-creases with an increase in biomass or LAI (Dye et al., 2002). The NDVI ratio is the ratio of shortwave infrared and red re-flectance. NDVI is defined by the following equation: NDVI=NIR−red
NIR+red (8)
Another vegetation index is the Vogelmann Red Edge In-dex 1 (VOG1) (Vogelmann, 1993), which is a narrowband reflectance measurement that is sensitive to the combined ef-fects of foliage chlorophyll concentration, canopy leaf area, and water content. Applications include vegetation phenol-ogy (growth) studies, precision agriculture, and vegetation productivity modelling. VOG1 is defined by the following equation:
VOG1=Reflectance at 740 nm
Reflectance at 720 nm (9)
Narrowband greenness VIs are a combination of re-flectance measurements sensitive to the combined effects of foliage chlorophyll concentration, canopy leaf area, foliage clumping, and canopy architecture. Narrowband greenness VIs are designed to provide a measure of the overall amount and quality of photosynthetic material in vegetation, which is
essential for understanding the state of vegetation. These VIs use reflectance measurements in the red and near-infrared regions to sample the “red edge” portion of the reflectance curve. The “red edge” is a term used to describe the steeply sloped region of the vegetation reflectance curve between 690 nm and 740 nm that is caused by the transition from chlorophyll absorption and near-infrared leaf scattering. Use of near-infrared measurements, with much greater penetra-tion depth through the canopy than red measurements, al-lows estimation of the total amount of green material in the column (RSI, 2005).
Narrowband greenness VIs are more sophisticated mea-sures of general quantity and vigor of green vegetation than the broadband greenness VIs. Making narrowband measure-ments in the red edge allows these indices to be more sensi-tive to smaller changes in vegetation health than the broad-band greenness VIs, particularly in conditions of dense veg-etation where the broadband measures can saturate. Narrow-band greenness VIs are intended for use with high spectral resolution imaging data, such as that acquired by hyperspec-tral sensors (RSI, 2005).
3.5.1 Accuracy assessment
To evaluate how well the estimated values obtained from the remotely sensed data compare to the observed data mea-sured using the LI-COR LAI canopy analyser, the Root Mean Squared Error (RMSE) (Eq. 10) statistic was used. The closer the RMSE is to zero, the better the result.
RMSE= v u u u t
n P
(E−O)2
n (10)
Where: E – The estimated value, O – the observed value, andn– the number of samples.
4 Results
The LAI values were measured on the 21 June 2007 us-ing the LI-COR LAI- 2000 canopy analyzer as described in Sect. 3.3. These were used to develop the relationships with the three vegetation indices and are shown in Table 1.
The relationships established between the measured LAI of all the sampled species and the three vegetation indices used are shown in Figs. 2–4.
From Fig. 2 it can be seen that the Pine 12 yr and the Wattle 4 yr can be estimated well when using the NDVI. The LAI of Pine 15 will be underestimated and Eucalyptus 10yr will be overestimated using the regression model obtained.
From Fig. 3 it can be observed that Pine 12 can be fairly well estimated, but the other species are scattered both above and below the regression model.
388 H. H. Bulcock and G. P. W. Jewitt: Spatial mapping of leaf area index
22
y = 6.1239x - 0.6567 R2 = 0.394
0 0.5 1 1.5 2 2.5 3 3.5 4 4.5
0.5 0.55 0.6 0.65 0.7 0.75
NDVI
L
A
I
(m
2/m 2)
Wattle 4yr Pine 12yr Pine 15yr Eucalyptus 10yr
Figure 2. Relationship between observed LAI and NDVI at Mistley-Canema Estate on 21
June 2007.
y = 5.4354x + 1.5416
R2 = 0.4647
0 0.5 1 1.5 2 2.5 3 3.5 4 4.5
0.2 0.25 0.3 0.35 0.4 0.45
SAVI
L
A
I
(m
2/m 2)
Wattle 4yr Pine 12yr Pine 15yr Eucalyptus 10yr
Figure 3. Relationship between observed LAI and SAVI at Mistley-Canema Estate on 21
[image:6.595.104.489.72.246.2]June 2007.
Fig. 2. Relationship between observed LAI and NDVI at Mistley-Canema Estate on 21 June 2007.
22
y = 6.1239x - 0.6567 R2 = 0.394
0 0.5 1 1.5 2 2.5 3 3.5 4 4.5
0.5 0.55 0.6 0.65 0.7 0.75
NDVI
L
A
I
(m
2/m 2)
Wattle 4yr Pine 12yr Pine 15yr Eucalyptus 10yr
Figure 2. Relationship between observed LAI and NDVI at Mistley-Canema Estate on 21
June 2007.
y = 5.4354x + 1.5416
R2 = 0.4647
0 0.5 1 1.5 2 2.5 3 3.5 4 4.5
0.2 0.25 0.3 0.35 0.4 0.45
SAVI
L
A
I
(m
2 /m 2 )
Wattle 4yr Pine 12yr Pine 15yr Eucalyptus 10yr
Figure 3. Relationship between observed LAI and SAVI at Mistley-Canema Estate on 21
June 2007.
Fig. 3. Relationship between observed LAI and SAVI at Mistley-Canema Estate on 21 June 2007.
23
y = 4.8625x - 4.0908
R2 = 0.7014
0.00 0.50 1.00 1.50 2.00 2.50 3.00 3.50 4.00 4.50
1.30 1.40 1.50 1.60 1.70
VOG 1
L
A
I
(m
2 /m 2 )
Wattle 4yr Pine 12yr Pine 15yr Eucalyptus 10yr
Figure 4. Relationship between observed LAI and the Vogelmann Index 1 at Mistley-Canema
Estate on 21 June 2007.
Table 2: Accuracy assessment results
Vegetation
Index
R
2RMSE
NDVI
0.39
0.43
SAVI
0.46
0.41
VOG 1
0.70
0.30
Fig. 4. Relationship between observed LAI and the Vogelmann Index 1 at Mistley-Canema Estate on 21 June 2007.
[image:6.595.108.484.285.470.2] [image:6.595.107.481.513.697.2]H. H. Bulcock and G. P. W. Jewitt: Spatial mapping of leaf area index 389
24
0 0.5 1 1.5 2 2.5 3 3.5 4
Wattle 4yr Pine12yr Pine15yr Eucalyptus10yr
Species
L
A
I
(m
2/m 2)
observed SAVI NDVI VOG 1
[image:7.595.105.490.64.247.2]Figure 5. Average LAI estimated using three different vegetation indices.
Fig. 5. Average LAI estimated using three different vegetation indices.
Table 1. LAI measurements taken with the LI-COR LAI 2000
canopy analyzer in four commercial forest stands at Mistley-Canema on 21 June 2007 at 04:30 p.m. on a clear and sunny day, used for model validation.
Pine Pine Wattle Eucalyptus 12 year 15 year 4 year 10 year
2.62 3.61 2.89 1.98 2.72 3.67 2.92 2.13 2.84 3.76 3.00 2.29 2.89 3.80 3.41 2.36 2.93 3.85 3.46 2.65 2.94 3.90 3.60 3.01 2.99 3.99 3.62 3.95 3.02 3.79 3.89 2.62 3.22 3.81 3.94 2.71 3.26 3.76 4.19 2.53
[image:7.595.356.493.316.371.2]Figure 4 shows that the LAI of all species can be estimated with a fair degree of accuracy using the Vogelmann index 1. Pine 12 shows the best correlation with the regression model. Based on the analyses above, of the three vegetation in-dices used in this study, the Vogelmann index 1, was the most successful for estimating the LAI for all species. TheR2and the RMSE values as shown in Table 2, for each of the three vegetation indices used, confirm that the Vogelmann index 1 is the most suitable index to use for the estimation of LAI in this case study. The Vogelmann index 1 performed better than the NDVI and SAVI because it is a narrowband index as apposed to a broadband index. The NDVI and SAVI are susceptible to saturating in dense vegetation. This saturation occurs when the vegetation index no longer increases signif-icantly with an increase in biomass or LAI as can be seen when using the SAVI for wattle 4 yr and eucalyptus 10 yr
Table 2. Accuracy assessment results.
Vegetation Index R2 RMSE
NDVI 0.39 0.43
SAVI 0.46 0.41 VOG 1 0.70 0.30
where the slope of the of the data points increases steeper than the trendline. The narrowband VOG 1 index penetrates deeper through the canopy and allows for better estimations of biomass or LAI in denser vegetation. A comparison of the estimated and observed LAI values for each land use is shown in Fig. 5.
Figure 5 shows that the average estimated LAI values cor-respond well with the observed values.
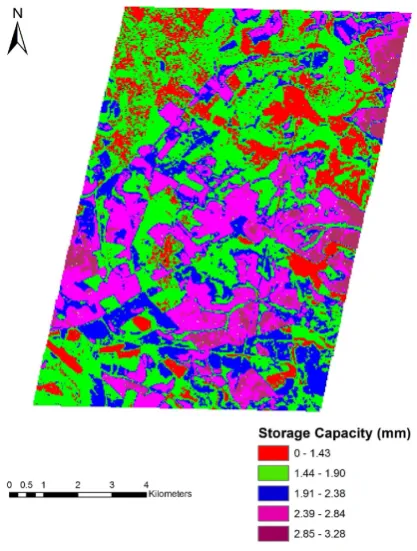
Using this information, the data obtained from the Hype-rion image can be converted into an image of LAI for the study area as shown in Fig. 6, which has been performed us-ing the Vogelmann index 1. Furthermore, the image that has been created for the LAI (Fig. 6) can be used to estimate the maximum storage capacity as shown in Fig. 7, by applying the von Hoyningen-Huene (1981) equation (Eq. 1). Simi-larly, the daily interception could be estimated if the daily rainfall was known by using Eq. (4), described in Sect. 2.
Figure 7 represents the maximum storage capacity for the same classes (i.e. using the same LAI values) as represented in Fig. 6.
5 Discussion and conclusion
Field based methods of estimating LAI and biomass of forestry plantations are expensive and time consuming. Re-motely sensed LAI values provide a means of gaining spatial
[image:7.595.82.248.347.490.2]390 H. H. Bulcock and G. P. W. Jewitt: Spatial mapping of leaf area index
25
Figure 6. The LAI distribution over the Mistley-Canema Estate using the Vogelmann index 1
on 21 June 2007.
Fig. 6. The LAI distribution over the Mistley-Canema Estate using
the Vogelmann index 1 on 21 June 2007.
information about various plant biophysical attributes that can be used in hydrological and process based growth mod-els and can be determined relatively cheaply and easily us-ing satellite imagery (Megown et al., 2000). The ability to remotely predict LAI and eventually water use over a large area is sought after by various stakeholders and the forestry industry, as well as water resources managers and planners. Due to the future availability and accessibility of hyperspec-tral sensors in southern Africa there should be an increased interest in using high spectral resolution data for a wide vari-ety of environmental applications
There has however been a reluctance to use remote sens-ing for hydrological applications by the hydrology commu-nity at large and in southern Africa in particular. This can be attributed to reasons such as, the unavailability to the rel-evant hardware and software, lack of knowledge of the ap-plication of remote sensing techniques and the reluctance to change conventional and well established methods (Shultz and Engman, 2002). Now in its 4th decade, the use of earth
26
Figure 7. The maximum storage capacity over the Mistley-Canema Estate using the
Vogelmann index 1 on 21 June 2007.
Fig. 7. The maximum storage capacity over the Mistley-Canema
Estate using the Vogelmann index 1 on 21 June 2007.
observation data in water resources is however becoming increasingly popular and has been used by researchers such as Dye et al. (2002), Ghebremicael et al. (2004), Sprintsin et al. (2007), Kongo and Jewitt (2007), to mention but a few.
The results obtained from this study show that the use of remote sensing for the estimation of LAI is possible with a relatively high degree of accuracy. The potential to use re-mote sensing to estimate LAI on a large scale and link this to water resources studies at various scales is just one pos-sible application. For example, with this data, the canopy interception can be estimated using the equations described in Sect. 2 and represented visually to obtain a better under-standing of the spatial variability of canopy interception or maximum storage capacity, as shown in Fig. 7. The method-ology used in this study is repeatable elsewhere, but the mod-els developed are site and image specific and should not be used elsewhere. This is because the reflectance values would vary in different images depending on which satellite was used to acquire the image and how the image was corrected. It can be concluded from this study that remote sensing is a valuable tool for the estimation of LAI for applications in hydrology, such as modelling canopy interception. With a limited amounted of field work, LAI measurements can
[image:8.595.62.284.83.437.2] [image:8.595.327.536.111.387.2]be utilised at large spatial scales, and with the launch of southern African satellites, data availability should improve. Although remote sensing may reduce the amount of field work needed, it cannot be excluded completely without a detrimental impact and high levels of uncertainty on the out-come of the task. It is important to accurately estimate LAI as Xiao et al. (1998) found that modelling canopy interception was most sensitive to storage capacity and LAI as the storage capacity is directly related to the LAI. Similarly, Limousin et al. (2008) found that a 25% reduction in storage capacity re-duces interception loss by 8.6%
The most robust vegetation index in this study was found to be the Vogelmann index 1 having anR2value of 0.7 and RMSE of 0.3. The Vogelmann index 1 was developed to be used with high spectral resolution data such as the hy-perspectral data used in this study and justifies the good re-sults obtained. Also, the Vogelmann index 1 performed bet-ter than the NDVI and SAVI because it is a narrowband in-dex as apposed to a broadband inin-dex. NDVI and SAVI are susceptible to saturating in dense vegetation. This satura-tion occurs when the vegetasatura-tion index no longer increases significantly with an increase in biomass or LAI. This can be seen when using the SAVI for wattle 4yr and eucalyptus 10yr where the slope of the of the data points increases steeper than the trendline. The narrowband VOG 1 index penetrates deeper through the canopy and allows for better estimations of biomass or LAI in denser vegetation. The SAVI and NDVI hadR2values of 0.46 and 0.39, and RMSE of 0.43 and 0.41 respectively. However, the SAVI and NDVI were able to be used to estimate certain species accurately. For example, NDVI can be used to estimate the LAI of 12 year old Pinus patula and 4 year old wattle accurately, even though it is not as robust for all species as the Vogelmann index 1. Although the SAVI and NDVI might not have produced results that are as good as the Vogelmann index 1, it can be seen from Fig. 5 that the difference between the observed and predicted values using the SAVI and NDVI are acceptable and suitable to use in the estimation of canopy interception. Although the results obtained in this study indicate that remote sensing techniques can be used in interception studies, further fieldwork to ver-ify the model is needed. Such field work on interception at compartment scale as well as national scale are ongoing, and form a second complementary phase to this study.
Acknowledgements. The authors would like to thank the CSIR for
the loan of equipment. Furthermore, thanks are extended to the Water Research Commission for the funding and imagery for this project, and to Mondi for access to the study site.
Edited by: N. Verhoest
References
Baret, F. and Guyot, G.: Potentials and limits of Vegetation Indices for LAI and APAR assessment, Remote Sens. Environ., 35, 161– 173, 1991.
Beven, K. J.: Rainfall-Runoff modelling: the primer, John Wiley & Sons, Chichester, UK, 2001.
Bongonko, M. N.: Hyperspectral Remote Sensing of Soil Moisture Gradients in Millingerwaard, The Netherlands, http://phylares.vub.ac.be/Thesissen/2005%20Michael% 20Ndemo%20Bogonko.pdf, last access: 24 February 2009, 2005.
Burger, C., Everson, C. S., and Savage, M. J.: Comparative evap-oration measurements above commercial forestry and sugarcane canopies in the KwaZulu-Natal Midlands, Ninth South African National Hydrology Symposium, 1–9, 1999.
Camp, K. G. T.: The Bioresources Groups of KwaZulu-Natal, Cedara Report N/A/97/6, KwaZulu-Natal Department of Agri-culture, Pietermaritzburg, 1997.
David, J., Valente, F., and Gash, J. H. C.: Evaporation of intercepted rainfall. In: ed. Anderson, M.G. Encyclopedia of Hydrological Science, John Wiley & Sons Ltd, West Sussex, England, chap-ter 43, 627–634, 2005.
Delegido, J., Fernandez, G., Gandia, S., and Moreno, J.: Retrieval of chlorophyll content and the LAI of crops using hyperspectral techniques: applications of PROBA/CHRIS data, Int. J. Remote Sens., 29(24), 7107–7127, 2008.
Dye, P., Megown, R., Jacobs, S., Drew, D., Megown, K., Dicks, M., Mthembu, S., and Pretorius, C.: Determining the water use and growth of forest plantations through the GIS-based integration of remote sensing and field data in the 3-PG model, Water Research Commission, Report No. 1194/1/02. Pretoria, 2002.
Everson, C., Moodley, M., Gush, M., Jarmain, C., Govender, M., and Dye, P.: Can effective management of riparian zone vegeta-tion significantly reduce the cost of catchment management and enable greater productivity of land resources, Water Research Commission, Pretoria, Report K5/1284, 2006.
Gash, J. H. C., Lloyd, C. R., and Lachaud, G.: Estimating sparse forest rainfall interception with an analytical model, J. Hydrol., 170, 79–86, 1995.
Gates, D. M.: Biophysical Ecology, Springer-Verlag, New York, 611 pp., 1980
GCIS: South African Yearbook 2006/7: Water affairs and forestry, http://www.gcis.gov.za/resource centre/sa info/yearbook/2007/ chapter23.pdf, last access: 14 April 2009, 2007.
Ghebremicael, S. T., Smith, C. W., and Ahmed, F. B.: Estimating the leaf area index (LAI) of black wattle from Landsat ETM+ satellite imagery, Southern African For. J., 201, 3–12, 2004. Godsmark, R.: The South African forestry and forest production
industry 2007, http://www.forestry.co.za/, last access: 17 March 2009, 2008.
Govender, M., Chetty, K. T., and Bulcock, H. H.: A review of hy-perspectral remote sensing and its application in vegetation and water resources studies, Water SA, 33, 145–151, 2007.
Gush, M. B.: Estimation of Streamflow Reduction Resulting from Commercial Afforestation in South Africa, Unpublished Manuscript, University of Natal. Pietermaritzburg, 2000.
392 H. H. Bulcock and G. P. W. Jewitt: Spatial mapping of leaf area index
Haboudane, D., Miller, J. R., Pattey, E., Zarco-Tejada, P. J., and Strachan, I. B.: Hyperspectral vegetation indices and novel algo-rithms for predicting green LAI of crop canopies: Modeling and validation in the context of precision agriculture, Remote Sens. Environ., 90, 337–352, 2004.
H¨ormann, G.: SIMPEL: A family of simple soil wa-ter models, http://www.hydrology.uni-kiel.de/∼schorsch/simpel/ englisch/simpel english.pdf, 2003.
Jewitt, G. P. W.: 8%–4% debate: Commercial afforestation and wa-ter use in South Africa, Southern African J. For., 194, 4–6, 2002. Jewitt, G.P.W.: Water and forests, in: Encyclopedia of Hydrological Science, edited by: Anderson, M. G., John Wiley & Sons Ltd., West Sussex, England, chapter 186, 1–15, 2005.
Kongo, V. M. and Jewitt, G. P. W.: Evaporative water use of dif-ferent landuses in the Thukela river basin assessed from satellite imagery, 13th SANCIAHS Symposium, Cape Town, 2007. Kozak, J. A., Ahuja, L. R., Green, T. R., and Ma, L.: Modelling crop
canopy and residue rainfall interception effects on soil hydrolog-ical components for semi-arid agriculture, Hydrol. Process., 21, 229–241, 2007.
LI-COR.: LAI-2000 Plant canopy analyser: Instruction Manual Ed.I, LI-COR Lincoln, Nebraska, USA, 1992.
Landsberg, J. J. and Waring, R. H.: A generalised model of forest productivity using simplified concepts of radiation use efficiency, carbon balance and partitioning, For. Ecol. and Manag., 95, 209– 228, 1997.
Langrebe, D.: Some fundamentals and methods for hyperspectral image data analysis, P. Soc. Photo-Opt. INS., 3603, 104–113, 1999.
Lillesand, T. M. and Kiefer, R. W.: Remote Sensing and Image Interpretation, John Wiley & Sons Inc., New Jersey, 1999. Limousin, J.-M., Rambal, S., Ourcival, J.-M., and Joffre, R.:
Modelling rainfall interception in a Mediterranean Quercus ilex ecosystem: Lessons from a throughfall exclusion experiment. J. Hydrol., 357, 57–66. 2008.
McGwire, K., Minor, T., and Fenstermaker, L.: Hyperspectral mix-ture modeling for quantifying sparse vegetation cover in arid en-vironments, Remote Sens. Environ., 72, 360–374, 2000. Nemani, R., Keeling, C., Hashimoto, H., Jolly, W., Piper, S., Tucker,
C., Myneni, R., and Running, S.: Climate-Driven Increases in Global Terrestrial Net Primary Production from 1982 to 1999, Science, 300, 1560–1563, 2003.
Okin, G. S., Roberts, D. A., Murray, B, and Okin, W. J.: Practi-cal limits on hyperspectral vegetation discrimination in arid and semiarid environments, Remote Sens. Environ., 77, 212–225, 2001.
Research Systems Inc.: ENVI 4.3: Narrowband Greeness, Boulder, Colorado, 2005.
Savenije, H. H. G.: The importance of interception and why we should delete the term evapotranspiration from our vocabulary, Hydrol. Process., 18, 1507–1511, 2004.
Schultz, G. A. and Engman, E. T.: Remote Sensing in Hydrology and Water Management, Springer, Heidelberg, Germany, 2000. Schulze, R. E.: Hydrology and Agrohydrology: A Text to
Ac-company the ACRU 3.00 Agrohydrological Modelling System. Water Research Commission, Pretoria, RSA, WRC Report No. TT69/95, 1995.
Sprintsin, M., Karnieli, A., Berliner, P., Rotenberg, E., Yakir, D., and Cohen, S.: The effect of spatial resolution on the accuracy of leaf area index estimation for a forest planted in the desert transition zone, Remote Sens. Environ., 109, 416–428, 2007. Van Dijk, A. I. J. M. and Bruijnzeel, L. A.: Modelling rainfall
in-terception by vegetation of variable density using an updated an-alytical model. Part 1. Model description, J. Hydrol., 247, 230– 238, 2001a.
Van Dijk, A. I. J. M. and Bruijnzeel, L. A.: Modelling rainfall interception by vegetation of variable density using an updated analytical model. Part 2. Model validation for a tropical upland mixed cropping system, J. Hydrol., 247, 239–262, 2001b. Vogelmann, J. E., Rock, B. N., and Moss, D. M.: Red Edge Spectral
Measurements from Sugar Maple Leaves. Int. J. Remote Sens., 14, 1563–1575, 1993.
Von Hoyningen-Huene, J.: Die interzeption des Nieder-schlages in landwirtschaftlichen Pflanzenbest¨anden. Arbeits-bericht Deutscher verband fur Wasserwirtschaft und Kulturbau, DVWK, Braunschwig, Germany, 1981.
Von Hoyningen-Huene, J.: Die interzeption des Niederschlages in landwirtschaftlichen Pflanzenbest¨anden, Deutscher Verband fur Wasserwirtschaft und Kulturbau, Verlag Paul Parey-Hamburg, Schirften, 57, 1–66, 1983.
Xiao, Q., McPherson, E. G., Ustin, S. L., and Grismer, M. E.: A new approach to model tree rainfall interception, AGU Fall meeting, San Francisco, CA, 1998.
Zhang, B., Song, K., Zhang, Y., and Wang, Z.: Study on the re-lationship between hyperspectral reflectance and soybean LAI, above ground biomass, Int. Geosci. Remote Se., 5, 3583–3586, 2005.