Georgia State University Georgia State University
ScholarWorks @ Georgia State University
ScholarWorks @ Georgia State University
Public Health Theses School of Public Health
Spring 5-15-2010
An Examination of the Socio-Demographic Characteristics
An Examination of the Socio-Demographic Characteristics
Associated with Adult Vaccination Prevalence for Preventable
Associated with Adult Vaccination Prevalence for Preventable
Diseases in the United States
Diseases in the United States
Jessica Mastrodomenico
Georgia State University
Follow this and additional works at: https://scholarworks.gsu.edu/iph_theses
Recommended Citation Recommended Citation
Mastrodomenico, Jessica, "An Examination of the Socio-Demographic Characteristics Associated with Adult Vaccination Prevalence for Preventable Diseases in the United States." Thesis, Georgia State University, 2010.
https://scholarworks.gsu.edu/iph_theses/93
ABSTRACT
JESSICA MASTRODOMENICO
An Examination of the Socio-Demographic Characteristics Associated with Adult Vaccination Prevalence for Preventable Diseases in the United States
(Under the direction of Christine Stauber, Faculty Member)
Background: An estimated 50,000 adults in the United States (U.S.) die each year from one of 10 vaccine preventable diseases. For those who survive vaccine preventable infections, health care costs and loss of income become more significant. While children in the U.S. aged 0-2 exhibit vaccine prevalence rates of almost 90%, some adult vaccine prevalence rates in the U.S. population are reported to be nearly 30-40% less than the goals set forth by Healthy People 2010. The purpose of this study was to examine the associations between socio-demographic
characteristics of U.S. adults and adult vaccination prevalence for pneumococcal, hepatitis A, hepatitis B, tetanus, and pertussis.
Methods: Data from the2008 National Health Interview Survey were assessed examining various health indicators and characteristics of non-institutionalized adults and children. The sample was restricted to adults ≥18 years of age. Odds ratios were calculated and multivariate logistic regression was also conducted. P-values of <0.05 and 95% confidence intervals were used to determine statistical significance.
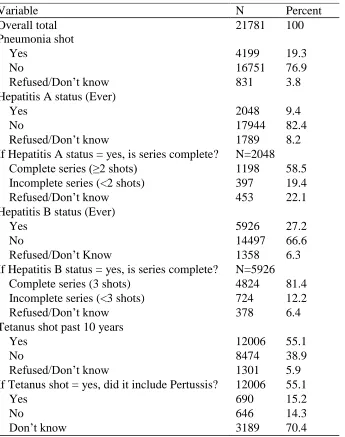
Results: There were 21781 total observations; 19.3% received the pneumococcal vaccine, 9.4% received the hepatitis A vaccine, 27.2% received the hepatitis B vaccine, 55.1% received the tetanus vaccine, and 15.2% received the pertussis vaccine. Of the socio-demographic
characteristics examined, age, health insurance, marital status, and education were significant for either all five or at least four of the vaccines included in this study. As one might expect those who reported health insurance and those who had a higher level of education usually had a higher likelihood of vaccine receipt as compared to those without health insurance and those with less than a high school education. Age associations varied due to age-related
recommendations for certain vaccines such as pneumococcal (recommended for adults ≥65). Compared to the married population (referent), marital status results varied, but for reasons unclear. Whites, the referent group, were the most likely to be vaccinated as compared to Blacks, Hispanics/Latinos, and Asians. Hispanics/Latinos typically had the lowest likelihood of vaccination in this examination.
Conclusions: This study further explores the impact of socio-demographic disparities on
AN EXAMINATION OF THE SOCIO-DEMOGRAPHIC CHARACTERISTICS
ASSOCIATED WITH ADULT VACCINATION PREVALENCE FOR PREVENTABLE
DISEASES IN THE UNITED STATES
By
JESSICA MASTRODOMENICO
B.S., BOSTON UNIVERSITY
A Thesis Submitted to the Graduate Faculty of Georgia State University in Partial Fulfillment
of the Requirements for the Degree
MASTER OF PUBLIC HEALTH
ATLANTA, GEORGIA
iii
AN EXAMINATION OF THE SOCIO-DEMOGRAPHIC CHARACTERISTICS
ASSOCIATED WITH ADULT VACCINATION PREVALENCE FOR PREVENTABLE
DISEASES IN THE UNITED STATES
By
JESSICA MASTRODOMENICO
Approved:
Christine Stauber, PhD Committee Chair
Sheryl Strasser, PhD Committee Member
iv
ACKNOWLEDGEMENTS
I would like to sincerely thank my thesis committee members, Dr. Christine Stauber and Dr. Sheryl Strasser. This process would not have been possible without their guidance, feedback, insight, and soothing encouragement. Additionally I would like to thank Dr. Ike Okosun. While he did not officially sign up for this, Dr. Okosun graciously and selflessly stepped forward to provide me with invaluable assistance.
To Nancy Pope and Shannon Kraft, you are the best thesis buddies ever. We’ve spent countless hours together while we wrote, complained, stared blankly at our computer screens, and laughed. I celebrate the completion of this process, but more-so the fact that I can call you my friends.
To my family and friends, I’ve missed you! Your love, distractions, and support have meant everything. I can’t imagine my life without you. My social calendar is now open.
Finally, I’d like to recognize the following people/places:
Bruce Springsteen: your music, your lyrical genius, your comforting voice…most of this thesis was written while listening to your albums over and over.
Caribou Coffee on Northside Parkway: you gave me hours of table space, free wi-fi, and lots of delicious soy lattes. Enough said.
v
AUTHOR’S STATEMENT
In presenting this thesis as a partial fulfillment of the requirements for an advanced degree from Georgia State University, I agree that the Library of the University shall make it available for inspection and circulation in accordance with its regulations governing materials of this type. I agree that permission to quote from, to copy from, or to publish this thesis may be granted by the author or, in her absence, by the professor under whose direction it was written, or in his
absence, by the Associate Dean, College of Health and Human Sciences. Such quoting, copying, or publishing must be solely for scholarly purposes and will not involve any potential financial gain. It is understood that any copying from or publication of this dissertation which involves potential financial gain will not be allowed without written permission of the author.
vi
NOTICE TO BORROWERS
All theses deposited in the Georgia State University Library must be used in accordance with the stipulations described by the author in the preceding statement.
The author of this thesis is: Jessica Mastrodomenico C/o Institute of Public Health Georgia State University P.O. Box 3995
Atlanta, GA 30302-3995
The Chair of the committee for this thesis is: Christine Stauber, Ph.D., M.S.
Institute of Public Health Georgia State University P.O. Box 3995
Atlanta, GA 30302-3995
Users of this thesis who not regularly enrolled as student as Georgia State University are
required to attest acceptance of the preceding stipulation by signing below. Libraries borrowing this thesis for the use of their patrons are required to see that each user records here the
information requested.
NAME OF USER
ADDRESS DATE TYPE OF USE
vii
CURRICULUM VITAE
Jessica Mastrodomenico
C/o Institute of Public Health, Georgia State University P.O. Box 3995
Atlanta, GA 30302-3995 [email protected]
EDUCATION
Georgia State University, Atlanta, GA 2008 - 2010
Master of Public Health; Concentration – Prevention Sciences
Boston University, Boston, MA 1996 - 2000
Bachelor of Science, Rehabilitation and Human Services; Minor – Clinical Exercise Physiology
PROFESSIONAL EXPERIENCE
CDC Foundation, Atlanta, GA 2008 – Present
Program Assistant (part time)
Georgia State University, Atlanta, GA 2008 – 2010 Graduate Research Assistant
TalentQuest, Atlanta, GA 2006 – 2008
Client Specialist
Imedex, Inc., Atlanta, GA 2004 – 2006
Manager
FourSquare Research, Inc., Atlanta, GA 2001 – 2007
Research Associate (part time)
Feminist Women’s Health Center, Atlanta, GA 2000 – 2002
Program Coordinator
COMMUNITY EXPERIENCE
Condominium Association, Atlanta, GA President and Board Member
viii
TABLE OF CONTENTS
ACKNOWLEDGEMENTS ... iv
LIST OF TABLES ... x
LIST OF FIGURES ... xi
INTRODUCTION ... 1
1.1 Background ... 1
1.2 Purpose of Study ... 5
1.3 Research Questions ... 6
REVIEW OF THE LITERATURE ... 7
2.1 History of Vaccines in the U.S. ... 7
2.2 Healthy People 2010 ... 8
2.3 Social Determinants of Health ... 9
2.4 Pneumonia ... 11
2.5 Hepatitis A... 15
2.6 Hepatitis B ... 17
2.7 Tetanus ... 19
2.8 Pertussis ... 22
2.9 Summary ... 24
METHODOLOGY ... 26
3.1 Data Source ... 26
3.2 Study Population ... 28
3.3 Study Measures ... 29
ix
RESULTS ... 33
4.1 Frequencies and Descriptive Statistics ... 33
4.2 Pneumonia ... 36
4.3 Hepatitis A... 39
4.4 Hepatitis B ... 41
4.5 Tetanus ... 43
4.6 Pertussis ... 45
4.7 Consistent Significant Associations ... 46
DISCUSSION AND CONCLUSION ... 58
5.1 Discussion ... 58
Race/Ethnicity ... 59
Gender ... 61
Age... 62
Access to Health Insurance... 64
Region of the U.S. ... 65
Marital Status ... 66
Education ... 67
Poverty to Income Ratio ... 68
5.2 Study Limitations ... 69
5.3 Recommendations ... 72
5.4 CONCLUSION ... 73
x
LIST OF TABLES
Table 1. Socio-demographic variables and coding ... 31
Table 2. Socio-demographic characteristics of eligible adult subjects who completed the 2008
NHIS ... 34
Table 3. Vaccination status of eligible adults who completed the 2008 NHIS ... 36
Table 4. Summary of statistically significant demographic characteristics for each vaccine based
on the multivariate analysis results ... 47
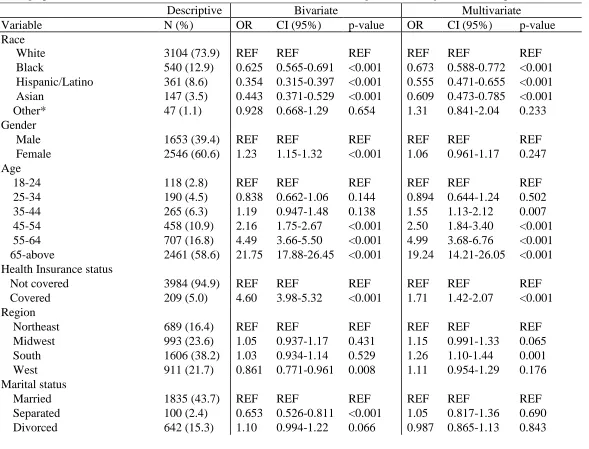
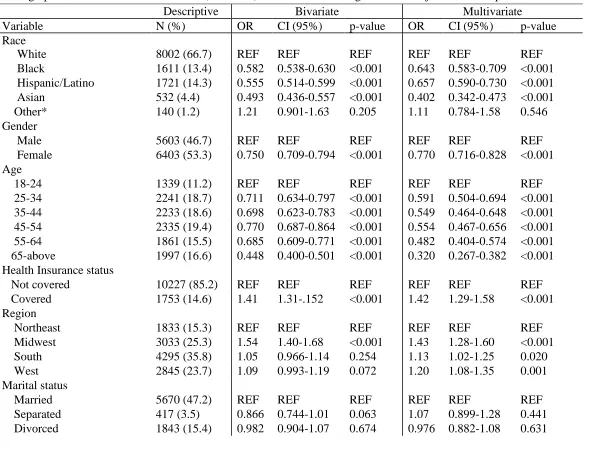
Table 5. Descriptive characteristics and bivariate versus multivariate analysis using logistic
regression assessing the association of demographic characteristics with Pneumonia
(N=4199) vaccine status in eligible adult subjects who completed the 2008 NHIS .... 48
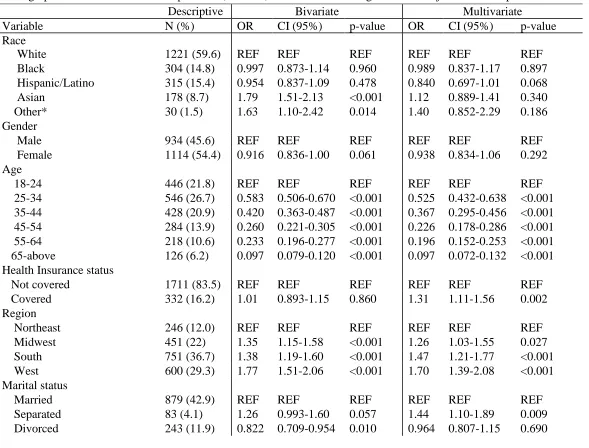
Table 6. Descriptive characteristics and bivariate versus multivariate analysis using logistic
regression assessing the association of demographic characteristics with Hepatitis A
(N=2048) vaccine status in eligible adult subjects who completed the 2008 NHIS ... 50
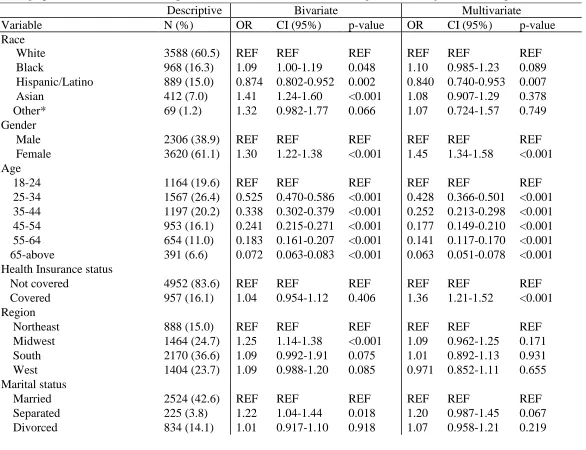
Table 7. Descriptive characteristics and bivariate versus multivariate analysis using logistic
regression assessing the association of demographic characteristics with Hepatitis B
(N=5926) vaccine status in eligible adult subjects who completed the 2008 NHIS .... 52
Table 8. Descriptive characteristics and bivariate versus multivariate analysis using logistic
regression assessing the association of demographic characteristics with Tetanus
(N=12006) vaccine status in eligible adult subjects who completed the 2008 NHIS .. 54
Table 9. Descriptive characteristics and bivariate versus multivariate analysis using logistic
regression assessing the association of demographic characteristics with Pertussis
xi
LIST OF FIGURES
Figure 1. U.S. recommended adult immunization schedule, 2010 ... 25
Figure 2. Map of the U.S. with NHIS grouping of regions... 30
1
CHAPTER I
INTRODUCTION
1.1 Background
The development and subsequent success of vaccinations has been touted as one of the
“greatest public health achievements” to date and the science of vaccines accomplished what no
other science could: the eradication of smallpox and the elimination of polio in the United States
(U.S.) (André, 2003; Trust for America's Health, 2010; U.S. Department of Health and Human
Services, 2000). Vaccines have the ability to prevent infectious diseases and also to reduce the
morbidity and mortality associated with some diseases. Currently, there are vaccines available to
prevent 26 infectious diseases (André, 2003). However, they often remain under-utilized
especially when one considers vaccines for adults which are recommended but not required (U.S.
Department of Health and Human Services, 2000). It is estimated that approximately 50,000
adults in the U.S. die annually due to one of 10 vaccine preventable diseases (Marks, 2009; Trust
for America's Health, 2010).
Vaccine preventable diseases (VPDs) in the U.S., albeit not the largest public health
threat, continue to create additional healthcare expenses for and pose significant risks to the
health of the public (Allen, 2010). Low vaccination rates are important to address in general;
however, an interesting combination of challenges arise when one considers the adult population.
This is a population vulnerable to preventable diseases that are controllable via vaccinations, but
such vaccinations are not required by law. In contrast, many vaccine mandates and laws exist
with regards to the child and adolescent populations in the U.S. For example, while the specific
2
unless they provide proof of certain immunizations (Zimet, Maehr, Constantine, & English,
2008). In the state of Georgia, all children attending either school or childcare must receive a
full series of the diphtheria, tetanus, pertussis combination vaccine before the age of seven
(Georgia Department of Human Resources, 2007). For children younger than seven, parents or
guardians must prove that children have started the series of shots and are following a particular
vaccination schedule that will result in full vaccination by approximately 5-6 years of age
(Georgia Department of Human Resources, 2007). These requirements have been effective in
terms of ensuring both proper vaccination rates and subsequent lower morbidity and mortality
rates amongst these populations (Zimet et al., 2008). In fact, at the end of the Healthy People
2010 timeframe it was estimated that more than 90% of children aged 0-2 had received the
recommended series of vaccinations with the exception of hepatitis B and varicella (U.S.
Department of Health and Human Services, 2000).
The success of child immunization practices is positive and it is important to strive to
achieve similar vaccine coverage rates in adult populations since adults are exposed to many of
the same VPDs that children face. Many factors impact the current vaccine coverage for adult
populations. For example, healthcare professionals are not required to remind adults of optional
vaccinations and updates/boosters and as a result many adults are either under-vaccinated or not
vaccinated at all (Schaffner, 2008). This creates an interesting cycle because these adults, just
like children, are at risk for increased morbidity and mortality. In a 2003 study researchers stated
that less than 500 child vaccine-preventable deaths were reported annually in the U.S. versus
nearly 39,000 adult vaccine-preventable deaths (Adult Immunization Consensus Panel, 2003).
The primary reason attributed to this difference was the strong childhood immunization
3
unvaccinated adults can be carriers (symptomatic or asymptomatic) of many VPDs, they pose
additional infection risks for infants and children who might not yet be fully vaccinated.
Just as children can transmit diseases to adults (and vice versa), vaccines have the ability
to protect adults from child disease carriers via herd immunity. Herd immunity means that even
though certain groups of people might not be vaccinated, they have immunity from a disease
because a large enough proportion of the population is vaccinated either by acquired or inherent
immunization and therefore the overall risk of disease spreading throughout the population is
low (“Herd Immunity,” 2010). Herd immunity is important to consider when reviewing the
benefits of vaccinations for both children and adults as a vaccine not only protects the person
receiving the vaccine, but it also has the potential to protect surrounding people. It is plausible to
state, for example, that if enough of the U.S. child and adult populations were vaccinated against
pertussis there would be a much lower risk of non-vaccinated individuals contracting pertussis
due to the effects of herd immunity. Even with public service announcements that explain the
benefits of vaccines along with vaccine mandates and/or recommendations, there will always be
a subset of the population who declines receipt of vaccinations because of religion, personal
preferences, and certain freedom of choice issues (Poland & Jacobson, 2001). However, even
with this subset of the population, as more people become vaccinated the strength of the overall
herd immunity becomes more protective. If vaccines are safe, effective, and accessible then one
needs to consider why the U.S. loses 50,000 adults each year to various preventable diseases.
In a report by Schaffner (2008), it was stated that there are three primary reasons why
adults underutilize vaccines: 1) missed opportunities, 2) no national programs for adults, 3)
public misunderstanding and misconceptions. In his report, Schaffner also suggested that the
4
educate and vaccinate their patients. The Healthy People 2010 report supported Schaffner’s
work, as it stated that not knowing what immunizations are recommended, lacking immunization
recommendations from healthcare professionals, and a gap in general knowledge about
immunizations are all barriers that impede adult immunization rates (U.S. Department of Health
and Human Services, 2000). To further elucidate the reasons for low adult vaccination rates,
another 2008 study stated that independent variables of having a “usual” place of care and
having a “usual” healthcare provider were positively associated with receipt of preventive care –
information that implies continuity of care is associated with adult vaccination rates (Blewett,
Johnson, B. Lee, & Scal, 2008).
Reports that discuss a need for healthcare professionals to recommend vaccines along
with a patient benefit from continuity of care are not scarce. These results agree with the
intuitive concept that as a person visits the same healthcare facility over a period of time, an
adequate medical record will be compiled and trends related to the need for annual screenings
and vaccination boosters will be more apparent. As a patient’s anniversary for a certain
screening or treatment approaches, healthcare facilities can implement a patient reminder system
so as to encourage the patient to return for his/her regular preventive care. While the solution of
encouraging healthcare providers to be more proactive about patient reminders could prove to be
successful, it does not account for the portion of the population who either has no access to
healthcare or who does not see the same health care provider each time medical attention is
needed. If the reasons adults choose to either decline or not seek out optional vaccinations are
neither identified nor addressed, the number of annual illnesses and deaths attributed to vaccine
5
1.2 Purpose of Study
Vaccine preventable diseases such as pneumonia, hepatitis A and B, tetanus, and
pertussis can account for significant days of hospitalization, healthcare costs, missed work days,
and overall morbidity and mortality rates (Trust for America's Health, 2010). It can be
hypothesized that if adult vaccination rates for these diseases were to increase, the impact of
hospitalizations, healthcare costs, missed work days, and overall morbidity could potentially
decrease. Even with the proven success and safety of vaccines these vaccines remain
underutilized in the adult, American population (Allen, 2010; U.S. Department of Health and
Human Services, 2000). Vaccines not only protect individuals from infectious disease related
disability or death, but they also help to protect entire communities by stopping the spread of
infections amongst the people (U.S. Department of Health and Human Services, 2000). Existing
research has shown that both patient reminder systems and healthcare providers’ roles regarding
vaccination efforts can increase the percent of adults who receive complete vaccine series and
recommended updates. While this is important information, this type of intervention does not
assist those who are not part of a primary care network, those who do not seek regular medical
care, and those who are under- or un-insured. The purpose of this examination is to assess what
demographic characteristics influence adult vaccination receipt and what
socio-demographic characteristics act as barriers to adult vaccination receipt. Literature related to
adult vaccination rates must be enhanced and expanded so that public health professionals may
better understand what interventions to implement in order to increase the prevalence of fully
immunized adults in the U.S. This will in turn help the U.S. experience a reduction in vaccine
6
1.3 Research Questions
To further investigate the reasons why adults in the U.S. choose to either receive or
decline vaccines for preventable diseases, the following questions will be examined:
1. What are the demographic characteristics of individuals who choose to receive
recommended vaccinations?
2. What are the socio-demographic characteristics of individuals who choose to receive
recommended vaccinations?
3. Do the typical trends of social determinants of health (those who are more educated,
7
CHAPTER II
REVIEW OF THE LITERATURE
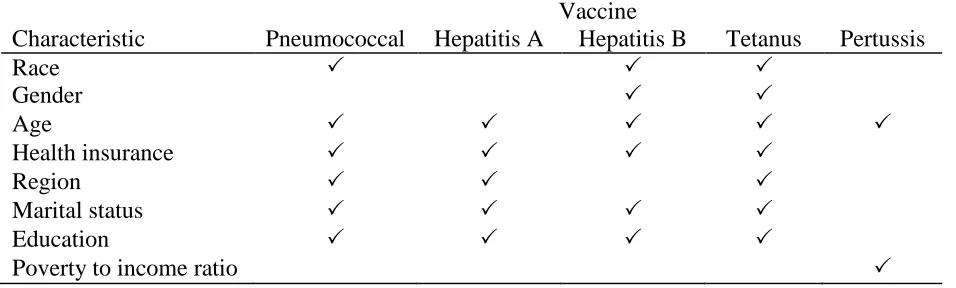
The purpose of this study is to analyze the potential association between vaccination
status (for pneumonia, hepatitis A, hepatitis B, tetanus, and pertussis) and access to healthcare,
poverty to income ratio, race/ethnicity, age, gender, region of residence, marital status, and level
of education. To support the need for this study a review of existing literature will illustrate the
benefits of adult vaccines, the epidemiology of each vaccine in this examination, and the
disparities (or determinants of health) that exist in the U.S. While a lot of progress has been
made with regards to targeting specific at-risk populations who need optional vaccines, less is
understood about the characteristics of the general adult population and overall vaccination
prevalence rates and trends.
2.1 History of Vaccines in the U.S.
The oldest vaccine with published accounts of use was a vaccine for smallpox in 1798,
and the first vaccine in the U.S. that was licensed for use was the influenza vaccine in 1945
(“Vaccine History: license and/or first manufacture,” 2010). Since then numerous additional
vaccines have been developed and licensed for use in both adults and children. Vaccines are
broadly regarded as one of the most important advances in medicine, and vaccines have been
called a “cornerstone” of the success of medicine in general (Baeyens & Michel, 2010). Even
the most general literature search will yield reports of the success of vaccines in terms of
8
be even more impactful when the prevalence of vaccine receipt increases. For example between
the years of 1940-1945, approximately 175,000 cases of pertussis were reported per year
(Atkinson, Wolfe, Hamborsky, & McIntyre, 2009). After the pertussis vaccine was introduced
into clinical practice in the mid-1940s, pertussis incidence rates steadily declined and went from
15,000 cases per year in 1960 to 5,000 cases per year in 1970 to 2,900 cases per year between the
years of 1980-1990 (Atkinson et al., 2009). The success of vaccines contributed, in part, to the
fact that the U.S. no longer considers infectious diseases the primary source of morbidity and
mortality in the country (Turnock, 2009). Additionally, vaccines have been included on the list
of reasons why the life expectancy of adults worldwide has increased (Baeyens & Michel, 2010).
2.2 Healthy People 2010
Healthy People, an initiative aimed at establishing health objectives for the U.S., was first
developed after the release of the 1979 Surgeon General’s Report titled “Healthy People: The
Surgeon General’s Report on Health Promotion and Disease Prevention” (U.S. Department of
Health and Human Services, 2000). Subsequent Healthy People editions were released in 1990,
2000, and 2010. The Healthy People initiative creates new goals and objectives related to the
improving the health and reducing health disparities for Americans. Updated or new goals and
objectives are published every 10 years and during each decade, progress related to the goals is
tracked nationwide.
Healthy People 2010 included 467 objectives within 28 focus areas for residents in the
U.S. The overall mission of the 2010 initiative, released in 2000, was to improve the health of
the American public via prevention efforts focused on the reduction of illness and disability as
9
2000). With that mission in mind, two primary goals were declared: to increase quality and
length of life and to eradicate health disparities (U.S. Department of Health and Human Services,
2000). In the initiative 10 leading health indicators were selected because they affect the general
public and because they can be measurably tracked for progress. Additionally, the leading health
indicators must also have an ability to influence action.
The Healthy People initiative lists immunizations as one of the top 10 leading health
indicators for the nation. The most recent reports of vaccination levels show significantly
different accomplishments for children versus adults (Trust for America's Health, 2010; U.S.
Department of Health and Human Services, 2000). The results of Healthy People 2010 indicate
that while definite progress has been made, the U.S. did not accomplish its immunization goals
overall. For example, the goal for pneumococcal vaccine coverage of adults in the U.S. was set
at 90% yet as of 1998, only 46% of this population reported receipt of the vaccine (U.S.
Department of Health and Human Services, 2000). Additionally, the Healthy People 2010 goals
for DTap (diphtheria, tetanus, and pertussis), polio, MMR (measles, mumps, rubella), and Hib
(Haemophilus influenzae type b) vaccine coverage were set at 80% of the population, yet as of
1998 only 73% of the population received these vaccines (U.S. Department of Health and
Human Services, 2000). These incomplete immunization outcomes illustrate the divide between
what vaccines are recommended for adults and what vaccines adults are actually receiving.
2.3 Social Determinants of Health
Along with immunization goals the Healthy People 2010 report also focused on
10
race/ethnicity, gender, income, educational attainment, and access to health care/health insurance
(U.S. Department of Health and Human Services, 2000). While these social determinants of
health exist in general terms, they also exist specifically in terms of immunization rates. For
example, much research has been conducted regarding racial differences and vaccination
prevalence. During a focus group study in San Francisco, California researchers addressed
attitudes about vaccination and found that African Americans were less trusting of vaccines and
healthcare in general as compared to any other race (N. A. Daniels, Juarbe, Rangel-Lugo,
Moreno-John, & Pérez-Stable, 2004). Additionally, the Adult Immunization Consensus Panel
developed a report specifically addressing immunization rates in African-American adults
because there was such a noted difference in both their use of health care as well as their
immunization rates (Adult Immunization Consensus Panel, 2003). In a study that addressed
issues of immunization and inner-city populations, a racial disparity was noted for pneumococcal
vaccination rates in older adults (Nowalk, Zimmerman, Tabbarah, Raymund, & Jewell, 2006).
There is vast research demonstrating the various health disparities experienced in the U.S.
The Healthy People 2010 report detailed the following examples of certain health disparities: on
average, women in the U.S. live 6 years longer than men even after adjusting for genetic
rationale. Race/ethnicity remains a disparity as death attributed to heart disease affects 40%
more African Americans than Caucasians. There is a positive relationship between income and
health status, meaning those who earn less money tend to be in poorer health. A similar pattern
holds true for level of education achieved in that those with higher educational attainment tend to
have better health statuses. People with disabilities tend to have less access to medical care or to
medical services. Geographic location continues to be a disparity as we note residents in rural
11
urban environments. Finally, in terms of sexual orientation, males in the United States who
identify as homosexuals have a 2-3 times increased risk of attempting suicide as compared to
their heterosexual counterparts.
In order to properly address these disparities as well as any trends related to the
vaccination rates in this examination, it is important to first understand the diseases: their
infectious agents, their transmission routes, the associated symptoms (acute and long term), the
applicable treatments available, and prevention – specifically their related vaccines.
Additionally, it is important to grasp the burden of each disease in terms of prevalence rates
within the U.S. along with how vaccines have affected prevalence rates over time.
2.4 Pneumonia
Pneumococcal disease can result in pneumonia, bacteremia, or meningitis (Atkinson et
al., 2009). Pneumococcal pneumonia is the most common syndrome of pneumococcal disease
infection and community-acquired pneumonia, regardless of age, is most often attributed to
infection from pneumococcal disease bacteria (Atkinson et al., 2009; Heymann, 2008).
Pneumococcal pneumonia is also often a secondary complication from influenza or measles
infection (Atkinson et al., 2009). For the purposes of this examination, we will focus primarily
on pneumococcal pneumonia instead of bacteremia or meningitis.
In 2006 in the United States, the Centers for Disease Control and Prevention stated that
1.2 million people were hospitalized due to pneumonia and 55,477 people died from pneumonia
12
of pneumonia per 100,000 people occur across Europe and North America and 10,000-14,000
people in the U.S. die from pneumococcal disease (Heymann, 2008; U.S. Department of Health
and Human Services, 2000). Pneumonia primarily affects the elderly population, infants, and
those with certain pre-existing conditions such as cardiovascular disease, diabetes, cirrhosis, HIV
infection, and chronic renal failure (Heymann, 2008). While antibiotic treatment for
pneumococcal pneumonia exists, studies have shown there is an approximate case-fatality rate of
5-7% for community-acquired pneumonia; this number is likely to significantly increase when
only focusing on those most at risk such as the elderly (Atkinson et al., 2009; Marks, 2009). In
addition to potential treatment, there is growing concern for infection with antibiotic resistant
organisms. Recently researchers estimated that up to 40% of the pneumococcal isolates in the
U.S. are resistant to penicillin therefore requiring stronger antibiotics to treat these infections
(Atkinson et al., 2009).
The bacteria of pneumococcal disease, Streptococcus pneumonia, has at least 90
serotypes and 10 of the most commonly found serotypes account for an estimated 62% of
pneumococcal disease globally (Atkinson et al., 2009). S. pneumonia can be found in the upper
respiratory tract, most commonly in the nasopharynx, and is often found in otherwise healthy
humans (Heymann, 2008, p. 473). As a result, many people are able to transmit the disease even
though they are asymptomatic. The rate of asymptomatic carriage of S. pneumonia can vary
depending on multiple socio-demographic and health status characteristics (Atkinson et al.,
2009). For example, military establishments note the highest rate of asymptomatic carriers, with
students and orphanages following a close second (Atkinson et al., 2009). Adults with no
children seem to have the lowest rate of asymptomatic carrying, but more research is needed to
13
Once a person is a carrier for S. pneumonia, pneumococcal pneumonia can easily be
transmitted via droplet spread from sneezing, coughing, and general close human contact
(Heymann, 2008). While large outbreaks of pneumonia are not common, they are possible, and
they most often occur in overcrowded environments such as nursing homes, hospitals,
correctional facilities, and military bases (Atkinson et al., 2009). The combination of
asymptomatic carriers along with the ease of disease transmission is concerning in terms of the
potential rate of new pneumonia cases each year.
Pneumococcal pneumonia infects the lungs and symptoms include high fever, chest pain,
dyspnea, malaise, weakness, and a “rusty” sputum producing cough (Atkinson et al., 2009;
Marks, 2009). Onset of symptoms is usually sudden; however, the elderly population sometimes
experiences a more gradual onset. Along with the acute symptoms, additional complications
from pneumonia infections are possible and include: infections of the pleural space, pericarditis,
and even lung abscesses (Atkinson et al., 2009). Pneumonia can affect people of all ages, but as
per usual with many illnesses, certain populations are at higher risk such as: children, the elderly,
and those with compromised immune systems (Heymann, 2008).
The U.S. licensed the first pneumococcal disease vaccine in 1977. This original vaccine
addressed 14 serotypes of pneumococcal disease. It was replaced by a new version in 1983
(Atkinson et al., 2009). The 1983 vaccine, named PPSV23 (Pneumovax 23 by Merck and
Company, and Pnu-Immune 23 by Lederle Laboratories) was designed to protect against 23
types of pneumococcal bacteria; however, it is important to note that it is more effective against
pneumococcal bacteremia versus pneumonia (Atkinson et al., 2009). According to the CDC,
14
The vaccine is also safe for people between the ages of 2 - 65 as well as who are at an increased
risk for the disease due to compromised immune systems, residence at long-term care facilities,
and those with certain pre-existing conditions (Marks, 2009). PPSV23 antibody levels remain
constant for approximately 5-10 years and revaccination is not typically recommended, though
this can vary depending on the person’s age at time of initial vaccination as well as the person’s
health status (MMWR, Centers for Disease Control and Prevention, 1997). The PPSV23 vaccine
has proven to be successful and CDC estimates that the PPSV23 vaccine prevents approximately
60-70% of pneumonia cases in adults who are vaccinated (Marks, 2009).
While the purpose of this examination focuses on adults, it should be noted that an
additional pneumococcal vaccine for children was released in 2000. This vaccine, PCV7,
protects against seven serotypes of S. pneumonia and is recommended for children under 24
months as well as children between 24-59 months who have pre-existing conditions (Atkinson et
al., 2009). The PCV7 vaccine for children has had a positive effect on the adult population,
because as children are vaccinated, the chance of them passing the disease to surrounding adults
decreases and therefore less adults become infected (Schaffner, 2008).
The pneumococcal vaccination is underutilized (Allen, 2010). After tracking vaccination
rates from 1991-1998, a Healthy People report estimated that only about 46% of the U.S.
population over the age of 65 received the pneumococcal disease vaccine (U.S. Department of
Health and Human Services, 2000). When the Healthy People 2010 goals were set in 2000, the
hope was that after a ten year effort to increase vaccine coverage, 90% of adults over 65 years of
age would be vaccinated against pneumococcal disease (U.S. Department of Health and Human
15
People 2010 goal was not met. In fact, some studies show that these vaccination rates fell nearly
30% short of the 2010 goal (Marks, 2009). Given the number of public health efforts to
vaccinate people against pneumococcal disease, especially the efforts aimed at ensuring the
elderly population is vaccinated, reasons for the unmet Healthy People 2010 goals remain
unclear.
2.5 Hepatitis A
Before the 1940s there was no distinction between hepatitis A and hepatitis B; however,
around 1940 new serologic tests enabled researchers to define a difference between the two
disease types (Atkinson et al., 2009). While hepatitis A is not consistently prevalent in the U.S.
this country experiences an epidemic approximately once every decade (Heymann, 2008).
Hepatitis A became a reportable disease in 1966 and in 1971 the U.S. experienced a record
breaking (high) number of 59,606 reported cases in a single year (Atkinson et al., 2009).
Between the years 1987-1997 hepatitis A was named one of the U.S.’ most frequently reported
diseases from the notifiable diseases list, and during this time the U.S. experienced an average
28,000 hepatitis A cases (D. Daniels, Grytdal, & Wasley, 2009).
Hepatitis A is caused by Hepatitis A Virus (HAV), a virus that is transmitted via a
fecal-oral route. This can be a result of direct human contact and lack of hygiene as well as a result
due to poor water or food quality; the latter being more common in developing nations with
inherent water and food quality challenges. From 1990-2000 the most frequent source of
16
identify the source of infection the most common transmission route was via sexual and/or
household contact with an infected person (14%) (Atkinson et al., 2009).
Symptoms of hepatitis A include fever (with quick onset), malaise, lack of appetite,
abdominal pain, darkened urine, and jaundice. When symptoms are present they can last up to
six months with an average duration of two months (Atkinson et al., 2009; Heymann, 2008).
Given the potentially long duration of these debilitating symptoms, hepatitis A infection has the
potential to be significant in terms of lost wages, funds spent on prolonged medication for
treatment, hospitalization, and other medically-related expenses. In fact studies have suggested
that approximately 11-22% of people who contract hepatitis A become hospitalized, resulting in
unexpected healthcare costs as well as time spent unable to work or take care of daily life
activities (Atkinson et al., 2009).
A vaccine for hepatitis A was introduced in 1995 at which point, it was recommended for
international travelers (Atkinson et al., 2009). The vaccine consists of two injections; one initial
shot and one booster dose (Atkinson et al., 2009; D. Daniels et al., 2009; Heymann, 2008). In
1996 Advisory Committee on Immunization Practices (ACIP) expanded the recommendation for
hepatitis A vaccine to include men who have sex with men as well as drug users (D. Daniels et
al., 2009). In 1999, ACIP once again the broadened the hepatitis A vaccination
recommendations to include all children older than two years of age who lived in areas of the
U.S. where annual hepatitis A rates were two times higher than the national average (listed as
prevalence rates ≥ 20 cases per 100,000 people) (Atkinson et al., 2009). ACIP again updated its
recommendations so that as of 2005, all children in the U.S. between the ages of 12-23 months
17
guidelines for children 2 years or older who were not yet vaccinated. The hepatitis A vaccine
became part of the routine child vaccination plan as of 2006 (D. Daniels et al., 2009).
In a recent publication from the Morbidity and Mortality Weekly Report, incidence of
hepatitis A experienced a significant decline, as rates went from 12/100,000 people to 1/100,000
people between 1995-2007 (D. Daniels et al., 2009). This report also stated that the 2007
hepatitis A incidence rates were the lowest that the U.S. has ever experienced (D. Daniels et al.,
2009). There are currently two forms of the hepatitis A vaccine available in the U.S. and their
efficacy in terms of preventing hepatitis A infection ranges from 94%-100% (Atkinson et al.,
2009). It is estimated that the vaccine remains protective for at least 20 years; however, because
the vaccine has only been in existence since 1995 additional research regarding long-term
efficacy is currently underway (Atkinson et al., 2009). Per the aforementioned statistics, it is
appears that the hepatitis A vaccination efforts in general have been successful; however, the
published rates of hepatitis A incidence do not distinguish between adult versus child cases.
Therefore it remains unclear as to whether adults are either appropriately or under-vaccinated.
2.6 Hepatitis B
The CDC estimates that 2 billion people throughout the world have been infected with
the hepatitis B virus at some point in their lives and that 350+ million people suffer from chronic
infection (Atkinson et al., 2009). In the U.S., most adult acute hepatitis B infections are
18
year the U.S. sees 5,000-8,000 new cases of chronic hepatitis B and that the adult population
accounts for 95% of new cases (Atkinson et al., 2009).
Hepatitis B is caused by the hepatitis B virus (HBV), a virus that can be transmitted
either via a perinatal route or via bodily fluids such as blood and serum. HBV is also known to
penetrate mucosal surfaces, therefore allowing infections to occur not only from obvious routes
such as needle sticks/sharing and sexual contact, but also from hand-to-eye or mucosal lesion
contact with an infected source of blood or bodily fluid (Atkinson et al., 2009; Heymann, 2008).
In the U.S. the most commonly reported route of transmission is via sexual contact (Atkinson et
al., 2009). Even though injection drug use accounts for only 15% of the primary risk factors
associated with hepatitis B infection, this risk factor can be quite significant over time. After one
year of injection drug use, approximately 40% of drug users will become infected with the virus
and after 10 years of drug use, approximately 80% of drug users will become infected with the
virus (Atkinson et al., 2009).
Symptoms of acute hepatitis B infection include general malaise (which can last for
weeks and months), vomiting, upper abdominal pain towards the right side of the body, and skin
rashes. Jaundice often occurs after the aforementioned symptoms appear, followed by light or
gray stools and hepatic tenderness (Atkinson et al., 2009). There is no specific treatment for
hepatitis B other than management of symptoms and monitoring of a patient’s overall health
(Heymann, 2008). It should be noted that in approximately 50% of adults, acute infection is
asymptomatic. Aside from chronic symptoms in some patients, other long-term effects of
19
attributed to approximately 80% of the global burden of hepatocellular carcinoma (Heymann,
2008).
In 1982 the first hepatitis B vaccine was released. There are now two types of hepatitis B
vaccines available, including a combination hepatitis B/hepatitis A vaccine option (Heymann,
2008). The hepatitis B vaccine includes a series of three shots and a person is not considered
fully immunized until the full series has been completed (Heymann, 2008). The vaccines have
been shown to protect against hepatitis B infections for at least 15 years and there is no schedule
or recommendation for re-vaccination once a full series of the vaccine has been administered
(Atkinson et al., 2009). The hepatitis B vaccines have proven efficacy; however, their impact
has not been as drastic as researchers originally hoped since targeting the highest risk
populations (injection drug users, heterosexuals with multiple partners, and men who have sex
with men) is difficult (Atkinson et al., 2009). Therefore, in order to eliminate hepatitis B
transmission the U.S. now recommends the following: screening for HBV in pregnant women
and subsequent treatment for newborns; full immunization for at risk populations based on
employment hazards (i.e. healthcare or laboratory workers) and sexual habits; immunization for
all infants; and catch up immunization plans for any adolescents who did not complete a
vaccination series during infancy (Heymann, 2008). It has been shown that countries with a high
rate of infant hepatitis B vaccination coverage exhibit the largest decline of hepatitis B incidence
and prevalence rates (Heymann, 2008).
20
Tetanus is one of the most serious preventable diseases in this examination, as fatality
rates are often high depending on the person and the environment. It has been reported that 11%
of all reported tetanus cases result in death and that number increases for those over the age of 60
and for those who are not vaccinated (Atkinson et al., 2009). Some of the tetanus-related deaths
can be attributed to secondary issues such as nosocomial infections and pulmonary embolisms,
but 20% of all tetanus deaths are due to the tetanus toxin (Atkinson et al., 2009). Tetanus is most
often noted in environments that are hot and humid, as well as those that have soil which
contains high concentrations of organic matter (Atkinson et al., 2009).
Tetanus is caused by the bacteria Clostridium tetani, a naturally occurring and
spore-forming bacterium found in soil, animal feces, some skin surfaces, and heroin that has been
contaminated (Atkinson et al., 2009). C. tetani produces two toxins, but the primary fatal toxin
is called tetanospasmin. Tetanospasmin is a neurotoxin that causes severe symptoms and
complications when introduced to an under-vaccinated or non-vaccinated human.
Tetanospasmin is lethal and CDC states that a dose of 2.5ng/kg of tetanospasmin can kill a
human weighing approximately 70 kg (or 154lbs) (Atkinson et al., 2009). Transmission of C.
tetani from the environment into the human body typically occurs via a bodily wound. This can
be a result of an accident or other injury as well as via needles used for injection drug “popping”
– a process in which a drug, often heroin, is injected just under the skin (Atkinson et al., 2009).
A tetanus infection and subsequent potential tetanus-related death is not because of the bacteria
alone, but rather, is attributed to the bacteria’s production of the tetanospasmin toxin (Atkinson
21
Symptoms of an acute tetanus infection include lockjaw, muscle contractions or rigidity,
muscle spasms, difficulty with swallowing, and seizures. Muscle spasms can last for 3-4 weeks
and longer term effects such as hypertension, sepsis from catheters, and other nosocomial
infections are secondary risks. Treatment for a tetanus infection includes wound cleaning,
removal of necrotic tissue as applicable, and other therapies to address muscle spasms and
airway restriction challenges. Additionally, tetanus immune globulin (TIG) can be administered
which helps the body rid itself of any tetanospasmin toxin that has not yet bound to nerve
endings. It does not, on the other hand, remove any toxin that has already bound itself to nerve
endings or reverse the toxin’s negative affects (Atkinson et al., 2009). Once the person’s health
is stable the tetanus vaccine should also be administered to protect against future infections.
The tetanus vaccine was first added to the routine child immunization schedule in the
1940s, when 0.4 cases per 100,000 people were diagnosed with tetanus in the U.S. annually
(Atkinson et al., 2009). In 2003, the U.S. experienced the lowest number of reported cases in
history: 0.01 cases per 100,000 people. Almost all of the reported cases of tetanus in the U.S.
can be linked to people who are either not vaccinated, or, people who are overdue for a booster
shot. The initial vaccination schedule includes 4 doses between 2-18 months of age. The
primary vaccine used is a combination vaccine that includes protection against diphtheria,
tetanus, and pertussis. The initial vaccination schedule can vary depending on the age at which a
child receives his first dose of the vaccine. A vaccine without pertussis may also be used if the
child has an adverse reaction to the pertussis vaccine. A booster dose of tetanus and diptheria is
needed every 10 years to ensure proper immunization levels exist. While the recommendations
22
reminding patients to receive their boosters remains a challenge (Jacobson Vann & Szilagyi,
2008).
2.8 Pertussis
In countries where the vaccine is either unavailable or not used widespread, pertussis
causes a significant number of deaths annually (Atkinson et al., 2009). In the U.S. pertussis has
had a curious pattern of incidence, as it is one of the only vaccine preventable diseases
experiencing a rise in incidence (Judelsohn & Koslap-Petraco, 2007). Pertussis was one of the
primary causes of child mortality until the development of a vaccine in the 1940s (Atkinson et
al., 2009). In the 1960s the U.S. noted approximately 8 pertussis cases per 100,000; this number
decreased to 5 per 100,000 in 1970 and during the 1980-1990 decade, the U.S. saw
approximately 1 case per 100,000 people (Atkinson et al., 2009; Heymann, 2008). Overall, it is
estimated that the incidence of pertussis has decreased by at least 80% since the development of
a vaccine(Atkinson et al., 2009); however, since the 1980s the incidence of pertussis cases has
started to increase and in 2004 the nation witnessed the highest number of cases (25,827 cases)
since 1959 (Atkinson et al., 2009). While some researchers attribute at least a portion of this
increase in reported cases to better diagnostic, surveillance, and reporting tools no definitive
reason for this increased incidence has been identified (Atkinson et al., 2009; Judelsohn &
Koslap-Petraco, 2007).
Pertussis is caused by the bacteria Bordetella pertussis which isa toxin-releasing
23
via airborne droplets. The toxins excreted from B. pertussis paralyze the cilia in the human
respiratory tract and also cause inflammation; both actions therefore making it difficult for a
person’s respiratory system to tolerate and rid itself of secretions and mucus. This lessened
ability to clear secretions and mucus results in an initial round of symptoms similar to a cold:
sneezing, runny nose, mild fever, and mild cough. These symptoms increase in severity and the
mild cough transitions to one that is episodic, often involving thick mucus that is difficult to
expel and that creates shortness of breath for the patient. Additionally, after some of the
coughing episodes, a “high-pitched whoop” can be heard (Atkinson et al., 2009, p. 200).
Sometimes the coughing attacks are either frequent or violent enough to result in vomiting.
Coughing attacks are more common during the night hours, so general malaise and exhaustion
often accompany a pertussis infection.
Infected adults often encounter a milder form of pertussis but it is important to keep in
mind that anyone infected with pertussis (regardless of the severity of the infection) is able to
infect others – especially those who are either under or not vaccinated. The CDC has stated that
in a household where more than one pertussis case is identified, the source case is often the older
person in that household (Atkinson et al., 2009). In terms of treatment for pertussis, supportive
therapy is the most common plan and patients are monitored so that undesirable symptoms can
be managed. Antibiotics are sometimes administered in order to reduce communicability and
duration of disease, but this is not always effective. Antibiotics are more often administered as a
prophylaxis to the close contacts of the pertussis case (Sandora, Gidengil, & G. M. Lee, 2008).
The first pertussis vaccine was introduced in the 1940s, but many newer vaccines have
24
concentrations which are applicable to specific age groups. All pertussis vaccines are of the
combination variety and are mixed with tetanus and diphtheria vaccines. The child schedule for
pertussis vaccinations includes 4 series of injections between the ages of 2-18 months.
Depending on the type of vaccine administered and the schedule followed, booster shots are
sometimes needed when the child enters school – typically between the ages of 4-6. After the
initial series is completed, a booster shot is usually recommended between the ages of 11-12
years and adults who might not have received pertussis vaccines as children should consider a
booster shot between the ages of 19-64 (Atkinson et al., 2009; “CDC Features - Pertussis
(Whooping Cough) – What You Need To Know,” 2009; Heymann, 2008). Healthcare workers
are classified as a priority group when considering pertussis vaccination since they are at a
higher risk of infection due to patient contact, and since they could also transmit the disease to
their patients (Sandora et al., 2008). This same recommendation holds true for those in close
contact with infants younger than one year of age (Brooks & Clover, 2006).
2.9 Summary
Even though the aforementioned diseases are all unique they have one primary
commonality: they are preventable via safe and effective vaccines available in the U.S.
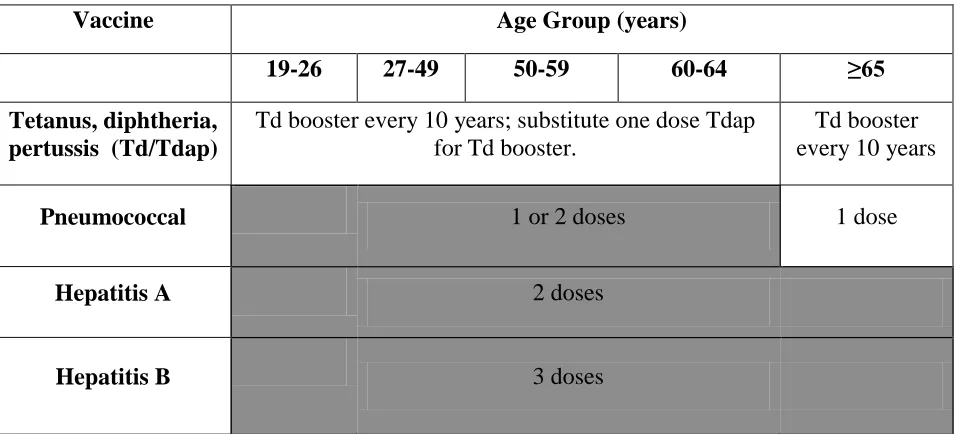
Organizations such as CDC have prepared multiple vaccination schedules, as seen in the
modified recommended immunization schedule for adults (Figure 1) below. While the
recommendations are clear to researchers and scientists, the fact that vaccination rates for U.S.
25
also clear to the general public. It is imperative that more research is done to investigate the
[image:37.612.69.548.206.423.2]reasons for low vaccination rates so that better interventions can be designed.
Figure 1. U.S. recommended adult immunization schedule, 2010
Vaccine Age Group (years)
19-26 27-49 50-59 60-64 ≥65
Tetanus, diphtheria, pertussis (Td/Tdap)
Td booster every 10 years; substitute one dose Tdap for Td booster.
Td booster every 10 years
Pneumococcal 1 or 2 doses 1 dose
Hepatitis A 2 doses
Hepatitis B 3 doses
26
Chapter III
METHODOLOGY
3.1 Data Source
The data used in this study were obtained from the National Health Interview Survey
(NHIS), a publicly available database that contains de-identified information. The NHIS is part
of the National Center for Health Statistics (NCHS), a division of the Centers for Disease
Control and Prevention (CDC). The NHIS first began in July of 1957 as a result of the 1956
National Healthy Survey Act. This act “provided for a continuing survey and special studies to
secure accurate and current statistical information on the amount, distribution, and effects of
illness and disability in the U.S. and the services rendered for or because of such conditions”
(National Center for Health Statistics, 2010). The NHIS collects information from the U.S.
non-institutionalized and civilian population. NHIS’ primary goal is to monitor the health of the U.S.
The sampling design of the NHIS is based on each decennial census and updated as needed. The
sampling design begins with 428 primary sample units (PSU’s) which represent a county, a
combination of neighboring counties, or a metropolitan statistical area. Overall, the PSU’s
represent the 50 States in the U.S. as well as the District of Columbia. Additionally, each PSU is
divided into two partitions: area segments and permit segments. Area segments are delineated
via geographic cut points and permit segments focus on housing units. This is done to ensure
that multiple family dwellings such as apartment complexes are not under-represented in the
27
It is important to keep in mind that the NHIS includes an oversampling process for the
Black, Asian, and Hispanic/Latino populations. This is managed via an initial oversampling plan
for certain area segments within a PSU. Oversampling is also accomplished via a screening
process during the time of a household interview. If the household does not have one or more
Black, Hispanic/Latino, or Asian person that interview is stopped and the household is
considered “screened out”. NHIS also oversamples the elderly portion of these groups so that
adults aged ≥65 in the Black, Hispanic/Latino, or Asian populations are adequately represented.
Along with oversampling, NHIS implemented weighting methodology. The 2008 NHIS sample
included 29,421 families in 28,790 households with a total of 74,236 people. Of the total
number of people, 29,421 were eligible to complete the Sample Adult questionnaire. A total of
21,781 adults completed these questionnaires. In order to ensure this sample was representative
of the nation, data for certain variables were weighted accordingly.
Surveys are conducted continuously throughout each year and data become available to
the public annually. Surveys are conducted by trained interviewers who are employees of the
U.S. Bureau of the Census. Surveys contain two main sections: a Core questionnaire and a
Supplemental questionnaire. The Core questionnaire is subdivided into an overall household
section, a family section, a sample adult section, and a sample child section. The two “sample”
sections are completed by one adult and one child within the household and the questions are
based on more of an individual concept than a family or household concept. The Core
questionnaire addresses basic information such as demographics and health status. The
Supplemental questionnaire allows for the reporting of new public health data as needed.
Examples of Supplemental data include Healthy People 2010 data, complementary and
28
computer assisted personal interviewing (CAPI) process – in other words, a person completing a
survey enters his or her answers directly into a laptop computer provided by the interviewer.
NHIS presents the data online in ASCII format. Users are able to download the files and
input them into a variety of statistical software programs. Sample syntax files for SPSS, SAS,
and STATA are provided on the NHIS website. For this examination, data files were
downloaded from the NHIS website and converted to Statistical Package for Social Sciences
(SPSS)® version 17.0 files. SPSS 17.0 was used for all analytics in this examination.
3.2 Study Population
The NHIS includes the civilian and non-institutionalized population residing in the U.S.
at the time of the survey. Adults and dependents who reside in a household with an active
member of the Armed Forces are able to be included in the survey; however, the active military
person is excluded. Along with the incarcerated and active duty military populations, patients in
long term care facilities and U.S. citizens who reside in other countries are also excluded from
the survey. Age is not an exclusion factor, except in the case of a sample adult or sample child
questionnaire. In these cases, age becomes an important inclusion factor though it should be
noted that with regards to the sample child questionnaire, an adult in the household is allowed to
answer on behalf of a minor, if that preference exists. Survey participation is voluntary and
confidential.
In this examination data from 2008 were used; specifically the household, family, person,
and sample adult files. Adults greater than or equal to 18 years of age were the only respondents
29
3.3 Study Measures
The primary dependent variable for this analysis was receipt of vaccination, which was
analyzed by specifically looking at five different vaccines: hepatitis A vaccine, hepatitis B
vaccine, pneumococcal disease vaccine, tetanus vaccine, and pertussis vaccine. To address these
dependent variables, subjects were typically asked if they had ever received each of these
vaccines. In the case of hepatitis A and B, subjects were also asked to quantify how many shots
they received if they responded “yes” to whether they had ever received the vaccine. Finally,
pertussis vaccination status was asked only to those who had answered affirmatively to the
receipt of a tetanus shot within the past 10 years. This is because the pertussis vaccination never
stands alone and if offered, is always in combination with tetanus and/or tetanus and diphtheria.
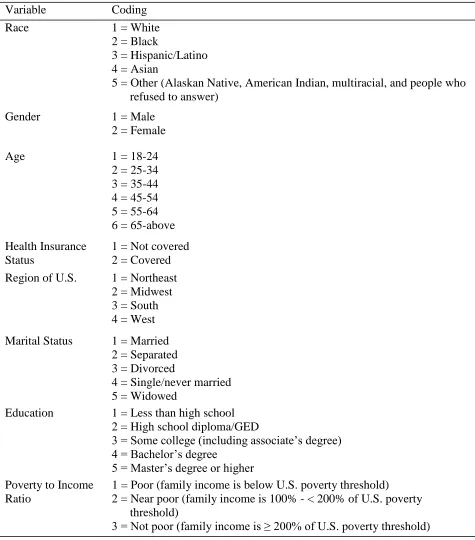
The socio-demographic independent variables used in this study were as follows: race,
gender, age, health insurance status, region of the U.S., marital status, education, and poverty to
income ratio. Details related for each independent variable including coding are listed in Table
1. Additional information regarding the specific states per region of the U.S. variable can be
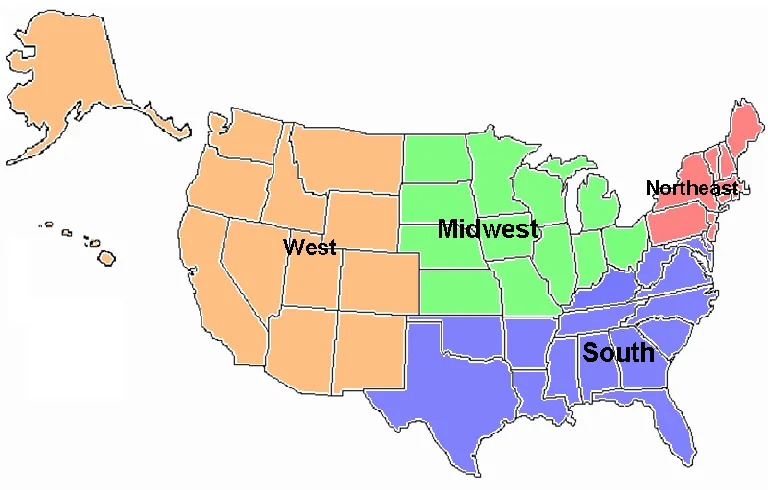
30
Figure 2. Map of the U.S. with NHIS grouping of regions.
Northeast: Maine, Vermont, New Hampshire, Massachusetts, Connecticut, Rhode Island, New York, New Jersey, Pennsylvania.
South: Delaware, Maryland, District of Columbia, West Virginia, Virginia, Kentucky, Tennessee, North Carolina, South Carolina, Georgia, Florida, Alabama, Mississippi, Louisiana, Oklahoma, Arkansas, Texas
Midwest: Ohio, Illinois, Indiana, Michigan, Wisconsin, Minnesota, Iowa, Missouri, North Dakota, South Dakota, Kansas, Nebraska
31
Table 1. Socio-demographic variables and coding
Variable Coding
Race 1 = White
2 = Black
3 = Hispanic/Latino 4 = Asian
5 = Other (Alaskan Native, American Indian, multiracial, and people who refused to answer)
Gender 1 = Male
2 = Female
Age 1 = 18-24
2 = 25-34 3 = 35-44 4 = 45-54 5 = 55-64 6 = 65-above
Health Insurance Status
1 = Not covered 2 = Covered
Region of U.S. 1 = Northeast 2 = Midwest 3 = South 4 = West
Marital Status 1 = Married 2 = Separated 3 = Divorced
4 = Single/never married 5 = Widowed
Education 1 = Less than high school 2 = High school diploma/GED
3 = Some college (including associate’s degree) 4 = Bachelor’s degree
5 = Master’s degree or higher Poverty to Income
Ratio
1 = Poor (family income is below U.S. poverty threshold) 2 = Near poor (family income is 100% - < 200% of U.S. poverty
threshold)
32
3.4 Statistical Analysis
Descriptive statistics were created to describe the overall population sample. To better
understand the population with regards to each vaccine, descriptive tables were also produced
per immunization type. An odds ratio calculation was performed to test the association between
receipt of each vaccine and the aforementioned social and demographic characteristics. Using a
binary logistic regression analysis, odds ratios were calculated along with 95% confidence
intervals and p-values. A p-value of less than 0.05 was considered a statistically significant
association between the socio-demographic factor and the receipt of the vaccine.
To further examine potential association between the dependent and independent
variables, multivariate logistic regression analyses were performed for each vaccine where all
socio-demographic factors were considered at once. Odds ratios were once again calculated,
33
Chapter IV
RESULTS
4.1 Frequencies and Descriptive Statistics
Frequency and descriptive statistics about the study sample are detailed in Table 2.
Overall the sample size included 21,781 people; 56.3% were female and 43.7% were male.
Caucasian people were the most represented race/ethnicity among the study population (61%)
and Asian people were the least represented race/ethnicity (5.7%). The delineation of “other”
within the race/ethnicity category consisted of Alaskan Natives, American Indians, multiracial
people, and people who refused to state their race/ethnicity. For statistical purposes, the total N
for this was group so small (1.2%) that the delineation will not be addressed in the results section
of this examination. While the study aimed to have an even representation of people from each
region of the U.S., the South had the highest representation (36.9%). For the purpose of this
study, which focused on adults, all respondents were adults over the age of 18. The age of
participants was approximately evenly distributed except for the age range of 18-24 (9.8% -
lowest) and the age range of 65-above (20.4% - highest). Most respondents reported having
some type of health insurance (83.2%). Region of residence in the U.S. was lowest for the
northeast (16.4%) and highest for the south (36.9%). Almost half of the respondents were
married (45.5%) and more than half had either high school or some college education (56.3%).
With regards to the poverty to income ratio, the majority of the population fell into the not poor
category (55.6%). It should be noted that the poverty to income variable had the highest reported
34
refused to provide specific family income data or family income data in general, and the
[image:46.612.70.327.192.727.2]calculated poverty to income ratio processed by the 2008 NHIS depended on family income data.
Table 2. Socio-demographic characteristics of eligible adult subjects who completed the 2008 NHIS
Variable N Percent
Overall total 21781 100
Race
White 13289 61.0
Black 3365 15.4
Hispanic/Latino 3673 16.9
Asian 1238 5.7
Other* 216 1.0
Gender
Male 9514 43.7
Female 12267 56.3
Age
18-24 2130 9.8
25-34 3944 18.1
35-44 3947 18.1
45-54 3970 18.2
55-64 3346 15.4
65-above 4444 20.4
Health Insurance status
Covered 18122 83.2
Not covered 3601 16.5
Refused/Don’t know 58 0.3 Region
Northeast 3562 16.4
Midwest 4924 22.6
South 8033 36.9
West 5262 24.2
Marital status
Separated 772 3.5
Divorced 3247 14.9
Married 9903 45.5
Single/never married 5613 25.8
Widowed 2159 9.9
Unknown 87 0.4
Education