Georgia State University Georgia State University
ScholarWorks @ Georgia State University
ScholarWorks @ Georgia State University
Chemistry Dissertations Department of Chemistry
Summer 8-18-2010
Rational Drug Design for Neglected Diseases: Implementation of
Rational Drug Design for Neglected Diseases: Implementation of
Computational Methods to Construct Predictive Devices and
Computational Methods to Construct Predictive Devices and
Examine Mechanisms
Examine Mechanisms
Catharine Jane Collar Georgia State University
Follow this and additional works at: https://scholarworks.gsu.edu/chemistry_diss
Part of the Chemistry Commons
Recommended Citation Recommended Citation
Collar, Catharine Jane, "Rational Drug Design for Neglected Diseases: Implementation of Computational Methods to Construct Predictive Devices and Examine Mechanisms." Dissertation, Georgia State University, 2010.
https://scholarworks.gsu.edu/chemistry_diss/48
This Dissertation is brought to you for free and open access by the Department of Chemistry at ScholarWorks @ Georgia State University. It has been accepted for inclusion in Chemistry Dissertations by an authorized
administrator of ScholarWorks @ Georgia State University. For more information, please contact
RATIONAL DRUG DESIGN FOR NEGLECTED DISEASES: IMPLEMENTATION
OF COMPUTATIONAL METHODS TO CONSTRUCT PREDICTIVE DEVICES
AND EXAMINE MECHANISMS
by
CATHARINE JANE COLLAR
Under the Direction of Dr. W. David Wilson
ABSTRACT
Over a billion individuals worldwide suffer from neglected diseases. This equates to
approximately one-sixth of the human population. These infections are often endemic in remote
tropical regions of impoverished populations where vectors can flourish and infected individuals
cannot be effectively treated due to a lack of hospitals, medical equipment, drugs, and trained
personnel. The few drugs that have been approved for the treatments of such illnesses are not
widely used because they are riddled with inadequate implications of cost, safety, drug
availability, administration, and resistance. Hence, there exists an eminent need for the design
and development of improved new therapeutics. Influential world-renowned scientists in the
Consortium for Parasitic Drug Development (CPDD) have preformed extensive biological
testing for compounds active against parasites that cause neglected diseases. These data were
acquired through several collaborations and found applicable to computational studies that
models and explore structural relationships through docking. Both of these in silico tools can
contribute to an understanding of compound structural importance for specific targets. The
compilation of manuscripts presented in this dissertation focus on three neglected diseases:
trypanosomiasis, Chagas disease, and leishmaniasis. These diseases are caused by kinetoplastid
parasites Trypanosoma brucei, Trypanosoma cruzi, and Leishmania spp., respectively.
Statistically significant predictive devices were developed for the inhibition of the: (1) T. brucei
P2 nucleoside transporter, (2) T. cruzi parasite at two temperatures, and (3) two species of
Leishmania. From these studies compound structural importance was assessed for the targeting
of each parasitic system. Since these three parasites are all from the Order Kinetoplastida and the
kinetoplast DNA has been determined a viable target, compound interactions with DNA were
explored to gain insight into binding modes of known and novel compounds.
RATIONAL DRUG DESIGN FOR NEGLECTED DISEASES: IMPLEMENTATION
OF COMPUTATIONAL METHODS TO CONSTRUCT PREDICTIVE DEVICES
AND EXAMINE MECHANISMS
by
CATHARINE JANE COLLAR
A Dissertation Submitted in Partial Fulfillment of the Requirements for the Degree of
Doctor of Philosophy
in the College of Arts and Sciences
Georgia State University
Copyright by Catharine Jane Collar
RATIONAL DRUG DESIGN FOR NEGLECTED DISEASES: IMPLEMENTATION
OF COMPUTATIONAL METHODS TO CONSTRUCT PREDICTIVE DEVICES
AND EXAMINE MECHANISMS
by
CATHARINE JANE COLLAR
Committee Chair: W. David Wilson
Committee: David W. Boykin
Donald Hamelberg
Electronic Version Approval:
Office of Graduate Studies
College of Arts and Sciences
Georgia State University
iv DEDICATION
This dissertation is dedicated to individuals suffering from parasitic neglected diseases,
v
ACKNOWLEDGEMENTS
Although a multitude of people have supported me throughout my doctoral research, I
could not have accomplished the work presented in this dissertation without the encouragement
and exceptional guidance provided by my advisor and mentor Dr. W. David Wilson for which I
am eternally grateful. Dr. Wilson is an outstanding professor and a personable professional from
whom I have learned much about academia and research. Invaluable conversations with Dr.
Wilson led to extensive and creative computational implementation to improve predictive and
mechanistic modeling efforts.
My educational experience was enhanced by interdisciplinary collaborations formed
through the Consortium for Parasitic Drug Development (CPDD) and funded by the Bill and
Melinda Gates foundation. Compounds were synthesized in the exceptional organic and
medicinal chemistry laboratories of Dr. David W. Boykin at Georgia State University and Dr.
Richard R. Tidwell at the University of North Carolina at Chapel Hill, while extensive biological
assays were performed by researchers in the laboratories of Dr. Harry de Koning and Dr.
Michael P. Barrett at the University of Glasgow, Dr. Karl Werbovetz at the Ohio State
University, Dr. Maria de Nazare Correia Soeiro at the Oswaldo Cruz Institute, and Dr. Reto Brun
at the Swiss Tropical Institute. The wealth of compounds and biological data gave way to
in-depth quantitative structure-activity relationship (QSAR) studies. My CPDD QSAR research
efforts would not have been possible or successful without the data and priceless explanations of
vi
Further mechanistic computational studies were made possible through collaborations
with Dr. Moses N. F. Lee at Hope College and Dr. Donald Hamelberg at Georgia State
University; research efforts were funded by the National Science Foundation and National
Institutes of Health. These studies produced structural data and insight into compound binding
interactions in relation to experimentally obtained binding constants. Binding constant data were
gathered by Dr. Binh Nguyen, Dr. Manoj Munde, and Dr. Yang Liu of the W. David Wilson
laboratory at Georgia State University. Members of the W. David Wilson laboratory, including
Carol Wilson, provided perspectives and editing that led to high quality presentations and
manuscripts.
Last but not least, throughout my doctorial training, love and support were consistently
provided by my family and friends. My Mom and Dad, Jane and Steve Collar, have been
inspirational role models; the value that they place on education is just as high as the morals and
values that they have instilled in me, my brothers (Curt and Kelly), and my sister (Kristin). My
parents and siblings have shown interest in my research endeavors and with this engaged in
insightful discussions. Family and friends worldwide encouraged me to pursue my goals and
approach life from an optimistic perspective, while my beautiful golden retriever Romeo
provided companionship and stress relief. By staying positive, my livelihood while conducting
vii
TABLE OF CONTENTS
ACKNOWLEDGEMENTS ... v
LIST OF TABLES ... x
LIST OF FIGURES ... xii
CHAPTER 1: NEGLECTED DISEASES ... 1
Therapeutics ... 2
Research Approach ... 3
Manuscripts ... 7
References ... 8
Figures ... 12
CHAPTER 2: PREDICTIVE COMPUTATIONAL MODELS OF SUBSTRATE BINDING BY A NUCLEOSIDE TRANSPORTER ... 17
Introduction ... 20
Experimental Procedures ... 21
Results ... 26
Discussion... 34
Acknowledgments ... 39
References ... 40
viii
CHAPTER 3: GOVERNING INHIBITION OF ARYLIMIDAMIDES AGAINST LEISHMANIA: CONSERVATIVE COMPUTATIONAL MODELING TO IMPROVE
CHEMOTHERAPIES ... 56
Introduction ... 59
Experimental Procedures ... 61
Results ... 64
Discussion... 71
Acknowledgments ... 74
References ... 75
Tables and Figures ... 78
CHAPTER 4: SCREENING FOR AFFINITY: PHARMACOPHORE AND QSAR-PLS MODELING OF BIOLOGICAL INHIBITORY DATA FOR COMPOUNDS ACTIVE AGAINST TRYPANOSOMA CRUZI ... 91
Introduction ... 94
Experimental Procedures ... 96
Results ... 98
Discussion... 103
Acknowledgments ... 106
References ... 106
ix
CHAPTER 5: SETTING ANCHOR IN THE MINOR GROOVE: IN SILICO INVESTIGATION INTO FORMAMIDO N-METHYLPYRROLE AND
N-METHYLIMIDAZOLE POLYAMIDES BOUND BY COGNATE DNA SEQUENCES . 119
Introduction ... 123
Experimental Procedures ... 125
Results ... 129
Discussion... 137
Acknowledgments ... 143
References ... 143
Tables and Figures ... 149
APPENDICES ... 165
Appendix A ... 166
Appendix B ... 192
x
LIST OF TABLES
CHAPTER 2: PREDICTIVE COMPUTATIONAL MODELS OF SUBSTRATE BINDING BY A NUCLEOSIDE TRANSPORTER
Table 1.CoMFA and CoMSIA model statistics for the datasets A-D of Figure 2 ... 47
Table 2.CoMFA and CoMSIA model statistics for the 112 compound database ... 48
CHAPTER 3: GOVERNING INHIBITION OF ARYLIMIDAMIDES AGAINST LEISHMANIA: CONSERVATIVE COMPUTATIONAL MODELING TO IMPROVE CHEMOTHERAPIES
Table 1. Statistics of partial least squares predictive models for a biological dataset of
synthetic arylimidamideswith activities against L. donovani axenic amastigotes
(LD) and L. amazonensis intracellular parasites (LA) ... 78
Table 2. Contribution of CoMSIA molecular descriptors for rigid and flexible models
employing structures of training dataset compounds and respective biological
activities ... 79
Table 3.Predictions in terms of IC50 ... 80
CHAPTER 4: SCREENING FOR AFFINITY: PHARMACOPHORE AND QSAR-PLS MODELING OF BIOLOGICAL INHIBITORY DATA FOR COMPOUNDS ACTIVE AGAINST TRYPANOSOMA CRUZI
Table 1.Statistics of partial least squares predictive models for a biological dataset of
synthetic diamidines and arylimidamideswith activities against Trypanosoma
xi
Table 2.Experimental and predicted pIC50 values for test set compounds ... 112
CHAPTER 5: SETTING ANCHOR IN THE MINOR GROOVE: IN SILICO INVESTIGATION INTO FORMAMIDO METHYLPYRROLE AND
N-METHYLIMIDAZOLE POLYAMIDES BOUND BY COGNATE DNA SEQUENCES
Table 1. Energies (EMM) gained from FlexiDock docking studies ... 149
Table 2. Table 2. Total energies, reported as EMM values, gained from Dock for the
lowest energy complexes obtained via FlexiDock and Grid Search... 150
APPENDICES
Supplemental Table 1.Compounds employed for training and testing ... 166
Supplemental Table 2.Listing of K
i values, Gibbs free energy ΔG 0
and energy gain/loss
relative to a control compound for some of the compounds utilised in this study
and listed in Supplemental Table 1 ... 185
Supplemental Table 3. Training dataset of compounds with experimentally determined
inhibition (IC50) values against L. donovani (LD) and L. amazonensis (LA)... 192
Supplemental Table 4. Compounds with experimentally determined inhibition (IC50)
xii
LIST OF FIGURES CHAPTER 1: NEGLECTED DISEASES
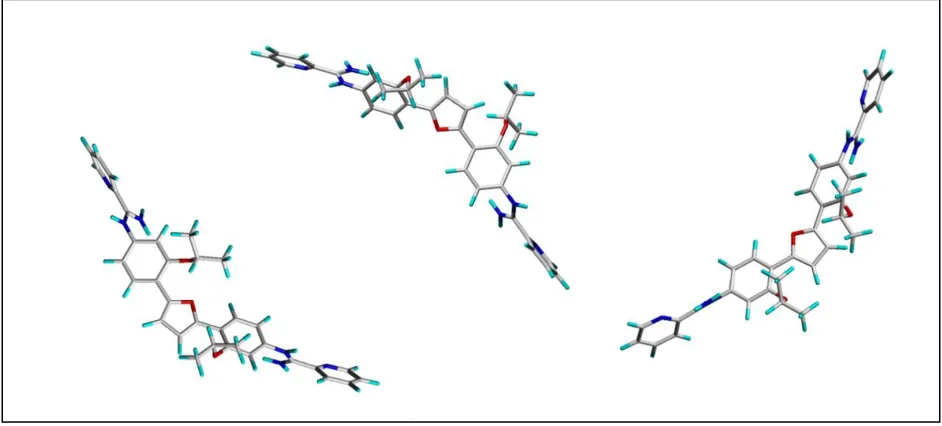
Figure 1. Examples of compounds constructed and minimized within the molecular
modeling software ... 12
Figure 2. Possible conformations of structures can be explored through various
methods ... 13
Figure 3. The three-dimensional molecular structures aligned within Cartesian space ... 14
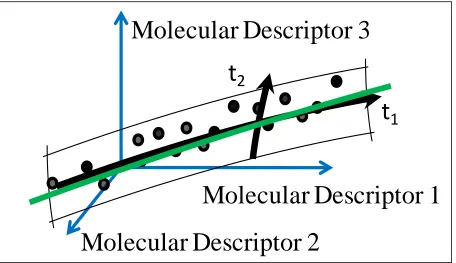
Figure 4. Partial least squares (PLS) is a regression technique that is employed to
compare experimentally obtained activity values to compound molecular
descriptors acquired from respective compounds ... 15
Figure 5. FlexiDock employs genetic algorithms as global optimizers to apply methods of
biological evolution ... 16
CHAPTER 2: PREDICTIVE COMPUTATIONAL MODELS OF SUBSTRATE BINDING BY A NUCLEOSIDE TRANSPORTER
Figure 1. Scaffolds for initial alignment: A, adenine; B, furamidine; C, stilbamidine; D,
pentamidine; E, 1,1’-(nonane-1,9-diyl)diguanidine; F, melarsoprol; G,
isometamidium ... 49
Figure 2.First alignment processes produced seven different databases for the 112
compounds ... 50
xiii
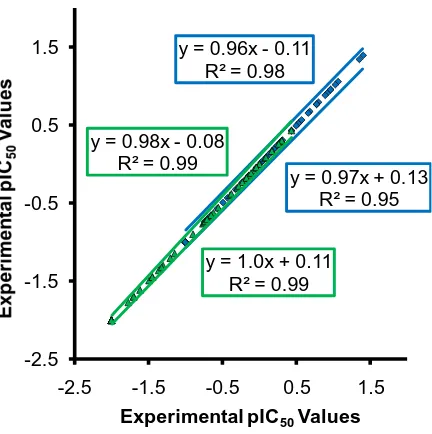
Figure 4.Actual versus predicted results from PLS models employing CoMFA (left) and
CoMSIA (right) molecular descriptors ... 52
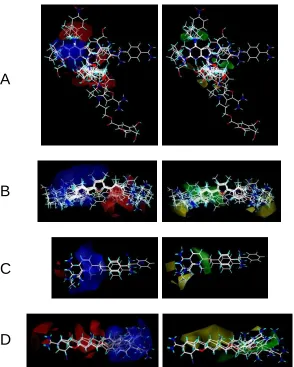
Figure 5. Calculated three-dimensional molecular surfaces for analyses of compound
structural relationships with P2 transporter inhibition ... 53
Figure 6.Three-dimensional molecular surfaces for pentamidine (top), furamidine
(middle), and melarsoprol (bottom) ... 54
Figure 7. Model of adenosine, giving estimates of the contributions to the total binding
energy of 34 kJ/mol in the black numbers, with the red numbers indicating the
position on the purine or ribose rings ... 55
CHAPTER 3: GOVERNING INHIBITION OF ARYLIMIDAMIDES AGAINST LEISHMANIA: CONSERVATIVE COMPUTATIONAL MODELING TO IMPROVE CHEMOTHERAPIES
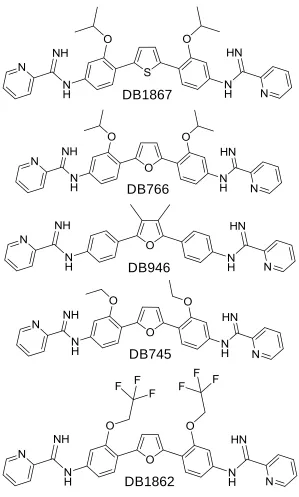
Figure 1.Scaffold structure for compounds being employed to examine biological
inhibitory data through quantitative structure-activity relationships of L. donovani
axenic amastigotes and L. amazonensis intracellular parasites ... 82
Figure 2.Biological pIC50 data of synthetic arylimidamidesactive against L. donovani
axenic amastigotes (green) and L. amazonensis intracellular parasites (blue) ... 83
Figure 3.Five of the most active compounds against L. amazonensis intracellular
parasitesand L. donovani axenic amastigotes ... 84
Figure 4.GALAHAD potentials as identified by simulations employing the compounds
xiv
Figure 5. Final training (top) and testing (bottom) datasets: flexible alignments (left) and
rigid alignments (right) ... 86
Figure 6.Internal (blue and green) and external (red) predictions ... 87
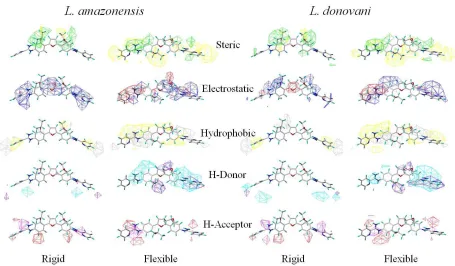
Figure 7.Overall models with CoMSIA molecular descriptors for both rigid and flexible
compound alignments ... 88
Figure 8.CoMSIA findings with respect to Figure 1 and molecular descriptor potentials
of Figure 7 ... 89
Figure 9. Compounds designed using the pharmacophore data of Figure 4 and the
CoMSIA molecular descriptor fields of Figures 7 and 8 ... 90
CHAPTER 4: SCREENING FOR AFFINITY: PHARMACOPHORE AND QSAR-PLS MODELING OF BIOLOGICAL INHIBITORY DATA FOR COMPOUNDS ACTIVE AGAINST TRYPANOSOMA CRUZI
Figure 1.GALAHAD potentials as identified by simulations employing four
arylimidamide compounds (DB1831, DB1853, DB1868 and DB766,
Supplemental Table 4, Appendix C) with high inhibitory affinity ... 113
Figure 2.Alignment atoms identified on the arylimidamide DB766; these are color coded
as in Figure 1 ... 114
Figure 3.The training dataset of 41 compounds (top) was employed to construct partial
least squares regression models, whereas the testing dataset of 6 compounds
xv
Figure 4. Predictions for the training (blue and green) and testing (red) datasets are
displayed with respect to experimental data ... 116
Figure 5. Potentials for models employing CoMFA molecular descriptors and biological pIC50 values ... 117
Figure 6. Potentials for models employing CoMSIA molecular descriptors and biological pIC50 values ... 118
CHAPTER 5: SETTING ANCHOR IN THE MINOR GROOVE: IN SILICO INVESTIGATION INTO FORMAMIDO METHYLPYRROLE AND N-METHYLIMIDAZOLE POLYAMIDES BOUND BY COGNATE DNA SEQUENCES Figure 1.Two-dimensional illustration of polyamide structures (Left) with abbreviations (Right): formamido (f), N-methylpyrrole (Py) and N-methylimidazole (Im) ... 151
Figure 2. Overlay of the 10 lowest energy structures for the docking of reference structure, 1B0S, polyamides into cognate DNA ... 152
Figure 3. f-PyPyIm in complex with 5’-d(GAACTAGTTC)-3’ ... 153
Figure 4. f-ImPyPy in complex with 5’-d(GAATGCATTC)-3’ ... 154
Figure 5. f-ImPyIm in complex with 5’-d(GAACGCGTTC)-3’ ... 155
Figure 6. f-ImPyIm in complex with cognate sequence 5’-d(GAACGCGTTC)-3’ ... 156
xvi
Figure 8. Surfaces displaying electrostatic potentials with respect to coulombic coloring
for the complexes (Left), DNA (Center) and polyamides (Right); blue surfaces
encompass positively charged regions, while red cover those that are negatively
charged ... 158
Figure 9.Accessible Surface Area (ASA) calculated for each base pair and polyamide in
complex (blue) and alone (red for DNA and green for single polyamide) ... 159
Figure 10.Ab initio calculated electrostatic potential maps for the Py, Im and amide units
of the polyamide dimers, respectively these units are shown on the left with their
dipole moments ... 160
Figure 11. Top view of dimers formed during docking (Left) and schematic
representation (Right) with Py in gray and Im in white ... 161
Figure 12.Two-dimensional illustration of f-PyPyIm in complex with cognate sequence
5’-d(GAACTAGTTC)-3’ ... 162
Figure 13.Two-dimensional illustration of f-ImPyPy in complex with cognate sequence
5’-d(GAATGCATTC)-3’ ... 163
Figure 14.Two-dimensional illustration of f-ImPyIm in complex with cognate sequence
5’-d(GAACGCGTTC)-3’ ... 164
APPENDICES
xvii
LIST OF ABBREVIATIONS
CPDD consortium for parasitic drug development
NIH national institutes of health
NSF national science foundation
CoMFA comparative molecular field analysis
CoMSIA comparative molecular similarity indices analysis
QSAR quantitative structure-activity relationship
PLS partial least squares
SEE standard error of estimate
CD Chagas disease
DA diamidine
AIA arylimidamide
Nfx nifurtimox
Bz benznidazole
DNA deoxyribonucleic acid
A adenine
T thymine
G guanine
C cytosine
Py N-methylpyrrole
xviii
f formamido
NMR nuclear magnetic resonance
1
2
NEGLECTED DISEASES
Worldwide, more than a billion individuals suffer from neglected diseases; yet very few
drugs have been approved as therapeutics for these illnesses.1-3 The lack of therapeutic agents
and the adverse effects of those available necessitates drug discovery efforts. Studies addressed
in this compilation of manuscripts are for neglected diseases caused by parasites of the Order
Kinetoplastida: (1) trypanosomiasis, caused by Trypanosoma brucei, (2) Chagas disease, caused
by Trypanosoma cruzi, and (3) leishmaniasis, caused by species of Leishmania.
Therapeutics
Trypanosomiasis. The type of treatment for trypanosomiasis depends on the stage of
infection, first or second, and subspecies of parasite.4-7 Suramin is used to treat T. brucei
rhodesiense infections, while pentamidine is employed for T. brucei gambiense. Side effects of
suramin treatment include nausea, vomiting, urticarial rash and lack of consciousness, whereas
pentamidine’s side effects include hypotension, abdominal pain, hypersalivation, vertigo, nausea,
and chest pain. The second stage treatments for both subspecies calls for melarsoprol, a drug that
is highly toxic and consists of the following side effects: convulsions, fever, loss of
consciousness, rashes, bloody stool, nausea, and vomiting, as well as myocardial damage,
albuminuria, and hypertension. Eflornithine can also be employed to specifically treat T. brucei
gambiense. The side effects associated with this compound include diarrhea, suppression of bone
3
Chagas Disease. Accepted clinical treatments for Chagas disease are Nifurtimox (Nfx)
and Benznidazole (Bz); these compounds are not FDA approved.7-9 The most common side
effects of Nfx are abdominal pain, dizziness, headache, loss of appetite, nausea, vomiting, and
weight loss, whereas the most common side effects of Bz include gastrointestinal symptoms such
as nausea and peripheral neuropathy.
Leishmaniasis. Infections of Leishmania spp. result in three forms of the leishmaniasis
disease: cutaneous, mucosal, and visceral.3, 4, 7, 10, 11 The preferred treatments are sodium
stibogluconate for cutaneous and mucosal leishmaniasis and liposomal amphotericin B for
visceral leishmaniasis. However, due primarily to the high cost of liposomal amphotericin B,
sodium stibogluconate is commonly used to treat all three leishmaniasis disease forms. The most
common side effect of sodium stibogluconate includes thrombophlebitis, abdominal pain,
nausea, vomiting, anorexia, myalgia, arthralgia, and headache. The most predominant side effect
of amphotericin B is nephrotoxicity.
Research Approach
Biological testing data were acquired through collaborations with world-renowned
scientists in the Consortium for Parasitic Drug Development (CPDD). The compounds and their
respective activities were employed for computational studies that examine: (1) quantitative
structure-activity relationships (QSAR) through the development of predictive models and (2)
4
Predictive Models. The QSAR of the structural and biological data acquired was assessed
through partial least squares (PLS) regression modeling employing the biologically obtained
activities and computationally calculated comparative molecular field analysis (CoMFA) and
comparative molecular similarity indices analysis (CoMSIA) molecular descriptors. In general,
QSAR-PLS studies follow these steps of progression: (1) compound input, (2) compound
minimization, (3) compound alignment, (4) molecular descriptor calculation, and (5) regression
model formation.
Before QSAR-PLS predictive models can be formed, an extensive dataset of compound
structures with biological activities must be acquired; it is important that biological activities are
gained by the same biological assay for each compound of the dataset. Compounds employed for
QSAR-PLS predictive modeling can consist of several diverse backbones. More diversity in a
molecular modeling system leads to a greater range of structures applicable for prediction.
When employing the SYBYL12 software environment to a dataset of compounds with
biological activities, the Sketch Molecule menu can be opened and compounds may be drawn.
Upon completion of a compound the Sketch Molecule menu needs to be exited and the
compound ought to be named via the Name Molecule menu. The molecules should then undergo
an initial minimization which can be done using the Minimize Molecule option. Examples of
constructed and minimized structures may be viewed in Figure 1. Each named structure can then
5
Subsequently to the input of all compounds into the database, possible conformations of
structures should be assessed. This can be done through several methods including but not
limited to: Systematic Conformational Search, Grid Search, Random Conformational Search,
MultiSearch, and GA Conformational Search. The lowest energy conformations of compounds
obtained ought to be further studied. To insure that compounds are in their lowest energy
conformations these compounds may be re-minimized and moved to new databases. Figure 2
displays three low energy structures of an arylimidamide compound.
Compounds of similar low energy structural conformations ought to then be aligned; each
alignment should consist of only one structural representation for each compound of the dataset.
Alignment can be acquired in several ways including but not limited to: Fit Atoms, Match
Atoms, Superimpose Atoms, Multifit, GALAHAD, and GASP. Examples are displayed in Figure
3. Optimal compound alignment is essential to the construction of employable QSAR-PLS
models.13
A molecular spreadsheet ought to be constructed following alignment; this can be done
by opening the database through the Open menu. Biological activities can then be input into the
spreadsheet and molecular descriptors may be calculated by using the AutoFill menu of the
spreadsheet. CoMFA and CoMSIA molecular descriptors can be calculated for QSAR-PLS
modeling.14 CoMFA has become a model system for QSAR modeling methods and CoMSIA
was developed to overcome limitations of CoMFA.14, 15 For CoMFA, each compound of a
6
molecular descriptors are calculated with a particular potential function; Lennard-Jones and
Coulomb potentials, respectively.16 To keep the calculation energies in reasonable boundaries
cut-off values are fixed: 5 kcal/mol for the Lennard-Jones potential and ±30 kcal/mol for the
Coulomb potential. For CoMSIA, similarity indices are compiled for the compounds of a dataset
at the intersections of a regularly spaced lattice.13, 16, 17 This is conducted with a grid and probe
method, similar to CoMFA. In CoMSIA, a common probe is employed in a distance dependent
approach that scans the entirety of the lattice and embeds each compound; the lattice points
inside and outside the molecule are employed and cut-offs are not needed. Steric, electrostatic,
hydrophobic, donor, and acceptor molecular descriptors are calculated using positive and
negative fields acquired through similarity indices. The CoMSIA method indirectly evaluates the
similarities of each molecule in the dataset, whereas the CoMFA method evaluates the
compounds of the dataset through relative interaction energies dependant on molecular positions.
PLS can then be employed to compare the biological activities of compounds to their
respective calculated molecular descriptors; the PLS regression technique solves the linear model
in a stepwise approach that includes every predictor variable in the model.12 A separate QSAR
equation is prepared for each target property when multiple dependent variables are employed.
The resulting coefficients are interrelated and usually differ from those that would be obtained by
examining biological properties individually. An illustration of this regression technique can be
viewed in Figure 4. With high-quality biological data and compound alignments as described
7
Docking. When receptor structures are available, useful information can be obtained
through the docking of compounds into a binding site. Figure 5 displays the general scheme of
FlexiDock, a genetic algorithm-based flexible docking method. Geometry optimization produces
an initial population of compounds in complex with a receptor. Each complex consists of
parameters that will be optimized: torsional angles, translation, and rotational angles.
Reproduction takes place when complex populations swap coordinates, crossover, and/or exhibit
random changes within the complex, mutation. Duplicate checking ensures that each complex is
unique; this increases the complex population diversity. Conformational modifications are then
made to the reproduced compounds and an evaluation function for scoring the resulting
interaction is applied to the complex. The FlexiDock scoring function is based on the Tripos
force field and estimates the energy of the compound, the receptor, and the complex energy. The
score is evaluated with van der Waals and the user-selected energy terms, including electrostatic,
torsional, constraint, and hydrogen bonding energies; lower energy in the complex state suggests
better binding. The crossover options that can be implemented when using Flexidock include:
(1) successive generations, (2) the creation of new members, created via crossover and mutation,
and (3) parents that can be selected for crossover. Fitness scores can be scaled to aid in selection.
Manuscripts
The published and unpublished manuscripts presented in this dissertation are a result of a
series of studies examining neglected diseases through the employment of biological data and
8
two through five represent four independent studies. Chapter two examines a highly diverse
dataset of inhibitors for T. brucei P2 transporters. A QSAR-PLS model was acquired through this
study and the compounds of the model were examined to gain an understanding of inhibitory
compound structural importance for P2 transporter inhibition. Chapter three examines
arylimidamides and their inhibitory activity against two species of Leishmania. This research
endeavor resulted in a conservative predictive method acquired via predictive models employing
both rigid and flexible compound alignments. Compound structural importance to activity was
then assessed. Chapter four examines a dataset of diamidines and arylimidamides with respect to
inhibitory activity against T. cruzi at two different temperatures. A pharmacophore was obtained
and used to construct a predictive model. Inhibitory compound importance was then extrapolated
from the model and assessed with respect to the pharmacophore at each temperature. Chapter
five examines dimer polyamide compounds bound by DNA with respect to their cognate DNA
sequences. Structural importance and mechanisms of binding were evaluated through docking
analyses. This study provides insight into DNA-compound interactions that may be applicable
for targeting parasites of the Order Kinetoplastida, since the DNA of these parasites has been
identified as druggable targets.22-24
References
1. Boutayeb, A., Developing countries and neglected diseases: challenges and perspectives.
9
2. Hopkins, A. L.; Witty, M. J.; Nwaka, S., Mission possible. Nature 2007, 449, (7159), 166-9.
3. Ouellette, M.; Drummelsmith, J.; Papadopoulou, B., Leishmaniasis: drugs in the clinic,
resistance and new developments. Drug Resist Updat 2004, 7, (4-5), 257-66.
4. Croft, S. L., In vitro screens in the experimental chemotherapy of leishmaniasis and
trypanosomiasis. Parasitol Today 1986, 2, (3), 64-9.
5. Kennedy, P. G., The continuing problem of human African trypanosomiasis (sleeping
sickness). Ann Neurol 2008, 64, (2), 116-26.
6. Control and surveillance of African trypanosomiasis: report of a WHO Expert
Committee; World Health Organization: Geneva, Switzerland, 1998; 30-37.
7. Bartlett, J. G.; Auwaeter, P. G.; Pham, P. A., The Johns Hopkins ABX Guide: Diagnosis
& Treatment of Infectious Diseases. Second Edition ed.; Jones and Bartlett Publishers,
Inc: 2010; 1-860.
8. Cerecetto, H.; Gonzalez, M., Anti-T. cruzi agents: our experience in the evaluation of
more than five hundred compounds. Mini Rev Med Chem 2008, 8, (13), 1355-83.
9. Coura, J. R., Present situation and new strategies for Chagas disease chemotherapy: a
proposal. Mem Inst Oswaldo Cruz 2009, 104, (4), 549-54.
10.Herwaldt, B. L., Leishmaniasis. Lancet 1999, 354, (9185), 1191-9.
11.Singh, S.; Sivakumar, R., Challenges and new discoveries in the treatment of
leishmaniasis. J Infect Chemother 2004, 10, (6), 307-15.
10
13.Cramer, R. D., III; Patterson, D. E.; Bunce, J. D., Comparative molecular field analysis
(CoMFA). 1. Effect of shape on binding of steroids to carrier proteins. J. Am. Chem. Soc.
1988, 110, 5959.
14.Verma, J.; Khedkar, V. M.; Coutinho, E. C., 3D-QSAR in drug design--a review. Curr
Top Med Chem 2010, 10, (1), 95-115.
15.Podlogar, B. L.; Ferguson, D. M., QSAR and CoMFA: a perspective on the practical
application to drug discovery. Drug Des Discov 2000, 17, (1), 4-12.
16.Klebe, G.; Abraham, U.; Mietzner, T., Molecular similarity indices in a comparative
analysis (CoMSIA) of drug molecules to correlate and predict their biological activity. J
Med Chem 1994, 37, (24), 4130-46.
17.Klebe, G.; Abraham, U., Comparative molecular similarity index analysis (CoMSIA) to
study hydrogen-bonding properties and to score combinatorial libraries. J Comput Aided
Mol Des 1999, 13, (1), 1-10.
18.Collar, C. J.; Al-Salabi, M. I.; Stewart, M. L.; Barrett, M. P.; Wilson, W. D.; de Koning,
H. P., Predictive computational models of substrate binding by a nucleoside transporter. J
Biol Chem 2009, 284, (49), 34028-35.
19.Collar, C. J.; Lee, M.; Wilson, W. D., Setting anchor in the minor groove: in silico
investigation into formamido N-methylpyrrole and N-methylimidazole polyamides bound
11
20.Collar, C. J.; Zhu, X.; Werbovetz, K.; Boykin, D. W.; Wilson, W. D., Governing
inhibition of arylimidamides against leishmaniasis: Conservative computational modeling
to improve chemotherapies. In Preparation.
21.Collar, C. J.; de Souza, E. M.; Batista, D. d. G. J.; da Silva, C. F.; Daliry, A.; Wiggins,
M.; Soeiro, M. d. N. C.; Tidwell, R. R.; Boykin, D. W.; Wilson, W. D., Screening for
affinity: Pharmacophore and QSAR-PLS modeling of biological inhibitory data for
compounds active against Trypanosoma cruzi. In Preparation.
22.Wilson, W. D.; Tanious, F. A.; Mathis, A.; Tevis, D.; Hall, J. E.; Boykin, D. W.,
Antiparasitic compounds that target DNA. Biochimie 2008, 90, (7), 999-1014.
23.Hu, L.; Arafa, R. K.; Ismail, M. A.; Wenzler, T.; Brun, R.; Munde, M.; Wilson, W. D.;
Nzimiro, S.; Samyesudhas, S.; Werbovetz, K. A.; Boykin, D. W., Azaterphenyl
diamidines as antileishmanial agents. Bioorg Med Chem Lett 2008, 18, (1), 247-51. 24.da Silva, C. F.; da Silva, P. B.; Batista, M. M.; Daliry, A.; Tidwell, R. R.; Soeiro Mde,
N., The biological in vitro effect and selectivity of aromatic dicationic compounds on
12
Figures
Figure 1. Examples of compounds constructed and minimized within the molecular modeling
software. Minimization should include an assigned Force Field, such as Tripos, and Charges,
such as Gasteiger-Huckel.
Construction of Compounds
Scaffold Structure 1.
Backbone of 46
training and all 12
testing compounds.
Scaffold Structure 3.
Backbone of DB1911
and DB1945.
13
Figure 2. Possible conformations of structures can be explored through various methods.
14
Figure 3. The three-dimensional molecular structures aligned within Cartesian space. (A) The
QSAR module of SYBYL can be employed to overlay rigid low energy structures via individual
molecule translations and/or rotations. (B) The GALAHAD module of SYBYL can be used to
overlay flexible or rigid molecular structures in torsional space. The identified features are color
coded: cyan for hydrophobes, magenta for donor atoms, green for acceptor atoms and red for
positive nitrogens.
Alignment by Algorithms
3. Three-dimensional molecular structures were overlaid in Cartesian space.
(A) The QSAR module was employed to overlay rigid low energy structures
via individual molecule translations and/or rotations. (B) The GALAHAD
module was used to overlay flexible molecular structures in torsional space.
Resulting rigid conformations were then overlaid within the Cartesian space.
(A)
15
Figure 4. Partial least squares (PLS) is a regression technique that is employed to compare
experimentally obtained activity values to compound molecular descriptors acquired from
respective compounds. PLS results in a linear model.
Partial Least Squares (PLS)
4. A regression technique was used
to compare biological activity values
to compound molecular descriptors;
this resulted in linear models.
Molecular Descriptor 3
Molecular Descriptor 1
Molecular Descriptor 2
[image:36.612.74.530.81.344.2]16
Figure 5. FlexiDock employs genetic algorithms as global optimizers to apply methods of
biological evolution.
Reproduction
Population
Discard
Modification
17
18
PREDICTIVE COMPUTATIONAL MODELS OF SUBSTRATE BINDING BY A NUCLEOSIDE TRANSPORTER
Catharine J. Collar1, Mohammed I. Al-Salabi2, Mhairi L. Stewart2, Michael P. Barrett2,
W. David Wilson1, and Harry P. de Koning2
From Department of Chemistry, Georgia State University, Atlanta, Georgia, 303031 and the
Department of Infection and Immunity, Institute of Biomedical and Life Sciences, University of
Glasgow, Glasgow G12 8TA, Scotland, United Kingdom.
Running head: Modeling substrate binding by a nucleoside transporter
Address correspondence to Harry P. de Koning, Division of Infection & Immunity, Glasgow
Biomedical Research Centre, 120 University Place, University of Glasgow, Glasgow G12 8TA,
Scotland, United Kingdom.
The abbreviations used are: CoMFA, Comparative Molecular Field Analysis; CoMSIA,
Comparative Molecular Similarity Indices Analysis; QSAR, Quantitative Structure-Activity
Relationship; PLS, Partial Least Squares; SEE, Standard Error of Estimate; CPDD, Consortium
19
Transporters play a vital role in both the resistance mechanisms of existing drugs and
effective targeting of their replacements. Melarsoprol and diamidine compounds similar to
pentamidine and furamidine are primarily taken up by trypanosomes of the genus Trypanosoma
brucei through the P2 aminopurine transporter. In standardized competition experiments with
[3H]adenosine, P2 transporter inhibition constants (Ki) have been determined for a diverse
dataset of adenosine analogs, diamidines, Food and Drug Administration-approved compounds
and analogs thereof, and custom-designed trypanocidal compounds. Computational biology has
been employed to investigate compound structure diversity in relation to P2 transporter
interaction. These explorations have led to models forinhibition predictionsof known and novel
compounds to obtain information about the molecular basis for P2 transporter inhibition. A
common pharmacophore for P2 transporter inhibition has been identified along with other key
structural charisteristics. Our model provides insight into P2 transporter interactions with known
compounds and contributes to strategies for the design of novel antiparasitic compounds. This
approach offers a quantitative and predictive tool for molecular recognition by specific
transporters without the need for structural or even primary sequence information of the transport
20
Introduction
Trypanosoma brucei are unicellular trypanosomal parasites that cause African sleeping
sickness in humans and nagana in livestock. These trypanosomes are auxotrophic for purines and
thus rely entirely on purine supplies salvaged from the host environment. As such, T. brucei
brucei expresses a multitude of purine nucleoside and nucleobase transporters.1 One of these, the
T. brucei aminopurine P2 transporter, is unusual as a genuine nucleoside-nucleobase transporter
in that it equally transports the nucleoside adenosine and the nucleobase adenine but has virtually
no affinity for any other natural purines or pyrimidines.1-3 Yet, despite this apparent high level of
selectivity, it has been shown that P2 also mediates cellular uptake of the Food and Drug
Administration-approved drugs melarsoprol and pentamidine,2, 4, 5 the main veterinary
trypanocides diminazene aceturate6 and possibly isometamidium,7 and various nucleoside drugs.8
The unusual nature of this transporter has led to efforts to exploit it as an efficient conduit
for novel trypanocides,9, 10 but this requires the identification of the exact pharmacophore as well
as the physical limitations on size and charge distribution of the extracellular binding site of the
transporter. From the structural similarities between known P2 substrates, it could be concluded
early on that the so-called amidine motif of adenine, i.e. N(1)=C(6)−NH2 (see Figure 1), was
very likely to play a major role in the high affinity interaction with the transporter.3, 11 However,
quantitative information or three-dimensional models explaining the high affinity binding, by
21
1C),12 melarsoprol (Figure 1F),2, 3 and even isometamidium (Figure 1G),7 have not been
available. The apparent broad selectivity has been all the more intriguing for the highly similar
transport efficiencies of P2 for adenosine and adenine, a most unusual feature for nucleoside
transporters.1
To construct a predictive and quantitative model of P2-substrate interactions, we
determined the Ki values of a large number of highly diverse potential inhibitors, with affinities
ranging over several orders of magnitude, through competition experiments with radiolabeled
adenosine. These values and structures were then employed for a computational modeling
approach to gain more information about the molecular basis for P2 transporter inhibition. The
resulting model can be used to evaluate the affinity of the P2 transporter for existing and novel
compounds in silico, potentially aiding in the development of novel and selectively targeted
trypanocides. More important yet, this strategy allows robust three-dimensional insights into
transporter-ligand binding while not requiring knowledge of the structure, or indeed the
sequence, of a transporter and can be applied to any solute transport mechanism for which uptake
or binding experiments can be routinely performed.
Experimental Procedures
Transport of [3H]Adenosine by Bloodstream Forms of T. brucei.Bloodstream forms of T.
brucei brucei strain 427 were taken from stocks in liquid nitrogen and injected in adult female
22
parasitaemia. Parasites were isolated from the blood by elution over a DE52 column
(Whatman)13 and washed twice in assay buffer (AB: 33 mM HEPES, 98 mM NaCl, 4.6 mM
KCl, 0.3 mM CaCl2, 0.07 mM MgSO4, 5.8 mM NaH2PO4, and 14 mM glucose, pH 7.3). Cells
were resuspended in this buffer at approximately 108 cells/ml prior to use in transport
experiments. Cell counts were performed using a haemocytometer. Transport of [3H]adenosine
(20-40 Ci/mmol; Amersham Biosciences) was performed exactly as described previously,14 in
the presence of 250 M inosine to block the P1 adenosine uptake system. Briefly, 100 l of 50 nM [3H]adenosine, mixed with various concentrations of nonradiolabeled test compounds, was
added to 100 l AB containing 107 trypanosomes and incubated at room temperature for 30 s, within the linear phase of uptake.3 Uptake was terminated by the addition of 1 ml of ice-cold
assay buffer containing 1 mM adenosine followed by immediate centrifugation through an oil
layer to separate cells from external radiolabel. The amount of radiolabeled adenosine inside the
cell was then determined using a scintillation counter and corrected for externally associated
label as described previously.14 A plot of inhibitor concentration versus adenosine uptake rate
(expressed as pmol(107 cells-1s-1)) yielded sigmoidal curves with Hill coefficients of
approximately −1, consistent with monophasic competitive inhibition (Prism 4.0; GraphPad).
Inhibition constants were calculated from the EC50 values, using the Cheng-Prusoff equation as
described previously.12
Inhibitor Dataset. Compounds were acquired from several academic laboratories as well
23
along with the compound names and sources are shown in Supplemental Table 1 (Appendix A).
Employing the formula pKi = −log(Ki), the Ki µM values for the 112 compounds were converted
to corresponding pKi values. The pKi values for this training set span more than 4 log units.
Software. All 112 compounds were constructed in silico with the SYBYL 8.115 software
package on a Fedora Core 5 Linux workstation. Compound structures were minimized to
convergence using a conjugate gradient of 0.01 kcal/(mol Å) and a maximum of 104 iterations
employing the Tripos force field with Gasteiger-Hückel charges. A three-dimensional cubic
lattice with 2 Å grid spacing in all directions was created to analyze compounds that were
aligned as described below. No improvement was seen in the models when the grid spacing was
reduced to 1 Å.16
Initial Alignment. Through the implementation of the SYBYL software alignment
modules, the compounds were three-dimensionally arranged by an initial analysis of structurally
and chemically related atoms. Algorithm generated alignment was performed using the align
database command, whereas the atom-to-atom alignment implemented the match feature of the
alignment tools. The algorithm alignment took place first by employing similar backbone
structures so that the majority of similar compounds were overlaid in the same molecular space.
Structurally related compounds were then moved into separate databases. The compounds that
belonged to the same structural classes, but which varied in atom types or had slight structural
24
compound using atom-to-atom alignment. Seven optimum databases of compounds resulted
from initial alignment.
When more rigid compound structures, consisting of a larger number of atoms, were
selected as scaffolds for alignments a greater number of databases were created. These databases
lacked the variation necessary to form Comparative Molecular Field Analysis (CoMFA) and
Comparative Molecular Similarity Indices Analysis (CoMSIA) models for predictability. Also,
when the databases were aligned by less rigid scaffolds, consisting of a smaller number of atoms,
fewer models resulted, and the models produced were not statistically significant in terms of q2cv.
The best models were obtained when compounds were aligned by the carbons of common
compound backbones. These scaffolds for alignment were obtained from the compounds
displayed in Figure 1: dataset A, adenine; dataset B, furamidine; dataset C, stilbamidine; dataset
D, pentamidine; dataset E, 1,1’-(nonane-1,9-diyl)diguanidine; dataset F, melarsoprol; and dataset
G, isometamidium. Datasets E-G are comprised of four, seven and four compounds, respectively.
The alignment for these last three datasets can be viewed in Supplemental Figure 1 (Appendix
A). These databases together consist of less than 8% of the total compounds. Because the
purpose of the initial alignment was to determine the pharmacophore for the final alignment,
only initial datasets A-D were evaluated through statistics and contour maps. All 112 compounds
were included in the final pharmacophore models.
Multiple Regression Analysis. CoMFA and CoMSIA Quantitative Structure-Activity
25
Squares (PLS) multiple regression analysis with molecular descriptors as independent variables
and the pKi values as dependent variables. Statistical significance in the form of q2cv was
assessed through the leave-one-out cross-validation method. The number of components (n) was
determined by the smallest predicted error sum of squares, a value that does not always
correspond to the highest correlation coefficient (q2) value. Further statistical significance
assessment was preformed for the final model using 10-fold cross-validation. The values
obtained from the 10-fold cross-validation assessment are averages of ten trials implementing
random compound selection. Column filtering did not improve the signal to noise ratio.15
Molecular Descriptors. There are two CoMFA molecular descriptors. The steric van der
Waals interaction and the electrostatic Coulombic interaction descriptors were calculated at each
lattice intersection using a probe, an sp3 carbon atom with a formal +1 charge. Standard scaling
and default energy cutoffs were employed. There are five CoMSIA molecular descriptors. Steric,
electrostatic, hydrophobic, hydrogen bond donor and hydrogen bond acceptor descriptors were
calculated using a standard probe: 1 Å radius, +1 charge, +1 hydrophobicity, +1 hydrogen bond
donor, and +1 hydrogen bond acceptor. Steric descriptors are related to the third power of the
atomic radii. Electrostatic descriptors are derived from partial atomic charges. Hydrophobic
descriptors are derived from atom-based parameters. Hydrogen bond donor and acceptor atoms
are derived from experimental values.
Three-Dimensional Contour Analysis. The interactions of CoMFA and CoMSIA
26
to molecular descriptor values and coefficients (StDev*Coeff) at each lattice point. For the initial
models, the default levels of contour by contribution were employed as follows: 80% for a
favored region and 20% for a disfavored region. Data were analyzed, and a common
pharmacophore was identified. The compounds of the final pharmacophore model were further
analyzed through a contour by actual analysis, where the software output assisted in the
determination of proper ranges for assigned values of favored and disfavored contour regions.
Pharmacophore Model. Common contours for the initial QSAR models were identified
through the analysis of favored and disfavored contour regions. The alignment of such contours
aided in the identification of a final pharmacophore. All compounds were realigned, and the final
models were constructed.
Results
As seen in Supplemental Table 1 (Appendix A), this study employs 112 compounds
acquired from several academic and industry locations. These compounds all exhibit some level
of inhibitory activity for the T .brucei brucei P2 transporter. For large datasets of compounds
with known activity values, it is possible to employ computational biology to investigate the
molecular basis of their activity in terms of structural contributions to Ki values. Predictive
models can then be constructed, and important interactions can be identified. Because a large
number of diverse compounds are in our database, a two-step procedure was used to establish a
27
Initial QSAR Models. As a first step, compounds were obtained in their minimal energy
conformation by using standard molecular mechanics energy minimization methods with the
Tripos force field. Compound alignment by similar atoms of backbone structures initially
separated the 112 compounds into seven databases, although the majority of the compounds
resided in four of the sets. The datasets with the majority of compounds were used for initial PLS
modeling. Table 1 displays the total number of compounds in each dataset, the n used in PLS,
and the statistics for each model as follows: cross-validated q2 (q2cv), the standard error of
estimate (SEE), the coefficient of determination (r2) and the F statistic. When q2 is greater than
0.5, a model is said to have predictability better than chance; however, it is also important that
the r2 value is near one, the SEE is small, and the F statistic is large.15 The r2 is a positive value
between zero and one; with one being the best correlation and zero being no correlation. The
SEE is a measure of the accuracy of the predictions. The F statistic is used in comparing the
variance between the experimental and predicted values; a larger value indicates a more
statistically significant model.
The average statistics for the initial four models with CoMFA molecular descriptors are
as follows: q2cv equal to 0.64; SEE equal to 0.23; r2 equal to 0.95; and F statistic equal to 123.
Similarly, the average statistics for the four models with CoMSIA molecular descriptors were as
follows: q2cv equal to 0.58; SEE equal to 0.26; r2 equal to 0.92; and F statistic equal to 130.
Although the models with CoMFA and CoMSIA molecular descriptors were comparable, the
28
descriptor contribution by contour maps. This is primarily due to the simplicity of two versus
five molecular descriptors.
Contour maps of CoMFA molecular descriptor contribution were generated for each
model (Figure 2). The electrostatic interactions are shown as red and blue contours, and the steric
interactions are displayed as green and yellow contours. Increasing partial positive charge is
favored in blue regions, and increasing partial negative charge is favored in red regions, whereas
increasing bulk in substituents is favored in green regions and disfavored in yellow regions.
The red, blue, yellow, and green regions were then analyzed to find common alignment
features of structures that are of importance for the final, combined pharmacophore alignment.
Red regions of dataset A are in the areas above C6, below N9, and beside the imidazole ring of
adenine, while those of datasets B-D were localized to a single location most often than not on
the backbone structure. The red contours of datasets A-D can be aligned in several ways to one
another; thus, this descriptor alone is not enough to find the final pharmacophore for alignment.
The blue regions were most commonly found in areas of N(R1)=C(R2)−NH(R3), where R3 is
usually H. The alignment was much improved with the inclusion of both the red and blue regions
and further enhanced by the addition of the yellow and green regions. Yellow contour regions
can be reduced by realignment of compounds into green regions. The yellow regions for dataset
A are small in relation to all other contours, and reside near the 2’- and 3’- hydroxy groups of the
ribose moiety. Dataset B exhibited yellow contours on both ends of the furamidine backbone,
29
areas of yellow contour appear most at regions that consist of several compounds with
substituents that are not precisely aligned, either because they differ largely in structure or
because the backbone allows for deviations in the alignment. Dataset D consisted of yellow
regions in the areas consisting of compounds that were longer than pentamidine and/or that did
not align fully to the pentamidine backbone. Green regions of dataset A were shown above C6
and next to bond C8/N9 of the adenine backbone, whereas the green contours of dataset B appear
near and encompassing the phenyl with the most precise alignment. Datasets C consists of green
contour near the most precise alignment of the compounds. For dataset D, green contours were
located in areas that were not precisely aligned to the pentamidine structure. The green and
yellow contours of dataset D both reside in areas of structural deviation; however, the green
appears nearest the aromatic linking oxygen and the unaligned amidines.
The identification of important structural features, described above, made it possible to
realign all 112 compounds, primarily by the common N(R1)=C(R2)−NH(R3) structure found in
the blue contour regions and secondarily by the other contour regions. The red regions of the
four main datasets overlapped strongly, whereas the yellow regions of datasets B-D can be
aligned to green regions of dataset A. The large compounds of dataset A also had to be realigned.
Figure 3A displays the alignment of all 112 compounds with adenine displayed in purple and
Figure 3B zooms in on the location of the adenine now with the purple displayed as transparent,
30
Final Pharmacophore Model. Aligned by the N(R1)=C(R2)−NH(R3) structure with
respect to contour regions, as described above, compounds were then employed for PLS
modeling. As before, CoMFA and CoMSIA models were generated and examined for statistical
significance. The two models each consisted of 112 compounds but use different molecular
descriptors and a different n. Although the q2cv values are similar, the remaining statistics are not;
the model with CoMFA molecular descriptors achieved a higher level of confidence than the
model with CoMSIA molecular descriptors (Table 2). To further validate these models, 10-fold
cross-validation was performed. The q210-Fold values for the models with CoMFA and CoMSIA
molecular descriptors were 0.56 and 0.54, respectively. These values, along with the rest of the
statistics, indicate statistical significance within each model.
The calculated predictions of the models formed from the dataset with 112 compounds
exhibit linear relationships with the experimental Ki values (Figure 4). Predictions from the
model with CoMSIA molecular descriptors are somewhat scattered, especially at high affinity,
whereas the model with CoMFA molecular descriptors produces more linear pKi predictions,
especially for compounds with high affinity for the P2 adenosine transporter (Figure 4). The r2
values for the linear relationships are 0.95 for the model with CoMFA molecular descriptors and
0.86 for the model with CoMSIA molecular descriptors.
These models can be further evaluated through examination of the final contour maps.
Although it is useful to analyze models as a whole to gain information about a possible
31
gathered by evaluating the contour regions of individual compounds within the model. Because
the model with CoMFA molecular descriptors is outperforming the model with CoMSIA
molecular descriptors, the focus of this analysis will remain on the contours of the model with
CoMFA molecular descriptors. As before, the steric contributions are displayed in yellow and
green while the electrostatic contributions are shown in red and blue.
The overall contour regions from the initial model have changed significantly with
realignment and incorporation of all 112 compounds. These changes appear most dramatic when
looking at individual compounds. In the initial models, each compound contributed roughly
2.8-6.3 percent. This was due to similar compounds being aligned by a common backbone scaffold
and their being only 16-36 compounds in each dataset; 1 in 36 is approximately 2.8 percent and 1
in 16 is about 6.3 percent. This percent of contribution is much larger than the final model, where
1 in 112 compounds is roughly 0.89 percent. It is also important to note that a larger quantity of
compounds with similar backbones will have a significant effect on the contribution. Hence,
based on initial models, the compounds with the adenosine scaffold structure should contribute
the most. There are 36 of these compounds. Those with the pentamidine and stilbamidine
scaffolds are similar and align to one another well within the final model. There are 32 of these
compounds, whereas there are 29 compounds related to furamidine.
From close observations of compound structure relationships in the form of contour
maps, it is possible to determine where partial charge addition or subtraction to substituents
32
process by which this model calculates predictions can be viewed through the evaluation of
contour regions and experimentally determined Ki values (Figure 5). The Ki of 2-aminopyridine
is 14 µM. When an amino group is added into the favorable steric and positive electrostatic
contour regions to form 4,6-diaminopyrimidine the Ki becomes 3.2 µM. Note that the amino
group has a partial positive charge. This amino group addition thus results in improved affinity.
When the additional groups, which reside in even more favorable contour regions, are added to
the compound structure, the Ki value becomes even smaller. Adenine is an example of a
compound with groups residing in favorable contour regions. This compound has a Ki of 0.30
µM. When a compound interacts with both positive and negative contour regions, the Ki
increases; the Ki value for adenosine, for example, increases three-fold relative to adenine as a
result of the bulky ribose group. The evolutional process taken when using these potentials to
design compounds for synthesis is quite similar to the progression shown in Figure 5. It is
important to make small changes and evaluate how the designed compound will fit within the
steric and electrostatic potentials assigned by the model.
Other important compounds to evaluate with this model are the pentamidine-,
furamidine-, and melarsoprol-like compounds (Figure 6). Pentamidine, furamidine, and
melarsoprol all have good affinity for the P2 transporter with respective Ki values of 0.37, 1.19
and 0.54 µM. Contour regions of pentamidine, furamidine, and melarsoprol are displayed in
Figure 6. These regions display several areas where some steric bulk and partial positive charge
33
bulky substituents interact with the unfavorable yellow contour regions and/or if positive charge
interacts with the red contour regions.
With pentamidine, which is a very flexible compound, the final pharmacophore model
yellow contours display most central atoms to be suitable for substituent addition; however, the
area nearest the pharmacophore should not be modified. Melarsoprol is a more rigid structure,
though rotation can occur throughout the compound. There can be rotation between the
melamine ring and the phenyl and between the phenyl and the dithiarsolan ring. For this
compound, the yellow contours reside near the melamine and the phenyl. This suggests that a
loss of affinity may result from substituent addition to the atoms in these regions. Furamidine is a
much more rigid and curved structure. For this structure, the yellow contours are much more
abundant near the phenyls and yet away from the furan and the amidines. This is even clearer
when the compound and its contour are viewed in three-dimensional space. The areas where
yellow contours do not exist are optimum for substituent modification.
The red contours encompass both pentamidine and furamidine, whereas blue contours
surround melarsoprol. The blue contours appear to be based on the partial charge distribution.
For the diamidine compounds the partial charge distribution is strongly localized at the amidines.
This appears beneficial for binding to the transporter; however, it is evident that more charge to
an amidine location will not improve binding. Instead a partial charge distribution that is shared
34
structure of melarsoprol. Findings suggest that additional charge, which is less localized, may be
able to improve binding of diamidine compounds.
Discussion
The efficacy of many drugs is determined to a large extent by the processes that govern
their uptake into the cell or into the cellular compartment that is the site of action.7, 17-19 These
processes obviously include transporters for water-soluble drugs but even rates of diffusion for
lipophilic drugs. An example of the latter is chloroquin, which as a weak base diffuses across
several membranes before it reaches the Plasmodium falciparum food vacuole where it is
trapped by protonation and fatally inhibits heme polymerization.20, 21 Equally, efflux systems
such as ATP-binding cassette transporters and the P. falciparum CRT1 channel-like protein have
been implicated in resistance to drugs ranging from antibiotics and antiparasitics to
antineoplastic drugs.22, 23 As such, detailed insights into the processes that determine drug flux
across the (plasma) membranes of target cells are vital for the rational optimization of drug
activity and both the prevention and bypassing of drug resistance.
It is of pivotal importance that we gain insight into the molecular mechanisms by which
transporters bind and thus select their substrates as this would allow us to construct models with
predictive value, which would allow us to optimize substrate design. Although in silico screening
of virtual libraries and predictions of substrate affinity are now possible for proteins with known