1293
A NEW IMAGE CODE RECOGNIZABLE AT A DISTANCE
1HYEON YEONG CHOI, 2WON-KEE HONG, 3JAEPIL KO*
1,3Department of Computer Engineering, KIT, Korea
2School of Information and Comm. Engineering, Daegu Univ., Korea
E-mail: 1[email protected], 2[email protected], 3[email protected]
ABSTRACT
The IoT(Internet of Things) technology basically requires identifying things that emit their identities The RFID (Radio-Frequency Identification) and Beacon technology are widely used as well as Image Code such as Bar-code and the QR code. The QR code has strenth in terms of cost since it can be cheaply printed. However, the QR code can only be used to recognize very close things. In this paper, we propose a new sign board that having a recognizable image code at a distance. An additional design issue is to provide a room for human recognizable contents. Our solution is to place code blocks on the boundary region of a rectangle shaped sign board. To dispose the code blocks on the boundary, we propose a line-shaped code. Then, we have tailored the design of the code by considering recognition performance. As a result of these consideration, we finally designed easy-recognizable 4-bit code blocks, 16 blocks. By adding the corner block to the designed code blocks, we created an 8-byte prototype for the boundary code. We also privide the method to detect the boundary code in a given input image. In our experimental results, the proposed sign board achieves 100% identification performance for given input images where the size of the sign board is 1/12 of the size of the image and the shooting angle is 60 degrees or less.
Keywords: Boundary Code, Image Code at a Distance, QR code, IoT, Object Identification
1. INTRODUCTION
The key technologies that lead the 4th industrial
revolution are intelligent robots, artificial intelligence, and Internet of Things (IoT). IoT begins from the acquisition of data from various sensors installed on things. The obtained data can be immediately delivered to another thing that needs it, or it accumulates in the cloud. The artificial intelligence techniques analyzes the data in the cloud to provide useful services to users or other things.
To enable such services, we first need to distinguish which data come from which things. In other words, IoT basically requires identifying things that emit their identities in passive or active manner. As a technique for distinguishing things, a method using radio waves and a method using image recognition can be used.
Both Radio-Frequency Identification (RFID) [1] and Beacons [2] are a common way to use radio waves. This method has the advantage of being easily recognized as non-contact type, but requires regular battery replacement.
Image code is an optical, computer-readable data representation [3], and another technology for
distinguishing things inexpensively compared to radio waves technologies. It can be categorized into two types: 1D and 2D as shown in Figure 1. Typical 1D and 2D image codes are bar-code [3] and the QR code [4] respectively. They are widely used in commercial domain.
bar code data matrix
[image:1.612.328.506.505.687.2]QR code color code Figure 1: Example Of Image Codes; Courtesy To [3]
1294 usual data capacity of data matrix [5] being widely used in industrial settings is from a few bytes up to 1,556 bytes. The maximum capacity of the QR code is about 2,956 bytes for a 177x177 cells. It was initially started with 21x21 cells capable of representing 19 bytes.
To increase the capacity, Takeshi et.al [6] divided the rectangle component into triangles to double the capacity. This approach gets more capacity while losing its recognition accuracy.
The easiest way to increase capacity is to use color. Gavin [7] introduced color in image codes. Color dramatically can increase the capacity of image codes, however it considerably suffers from poor recognition accuracy. This approach requires more complex image processing technology that can handle the color constant problem [8]. Various methods for the color constant problem have been introduced in the literature [9][10][11], but there is no way to overcome this completely.
When the Internet was not always connected, the image code needed more capacity. But now we are always connected to the Internet, so we do not have to compete to get more capacity. The capacity required is just enough to distinguish things since we can access additional content provided by the web from the ID obtained from the thing. In the case of Beacons, a total of 20 bytes are allocated, including 4 bytes that can be specified by the user.
[image:2.612.353.481.220.360.2]The category of image codes also includes AR markers for providing augmented reality. They are relatively simple and usually consist of a thick black border and simple symbol on the center area [12][13][14][15]. Figure 2 shows a typical AR code used by the ARToolkit published by the University of Washington.
Figure 2: Artoolkit Marker
Ruan and Jeong [16] used the QR code instead of a simple alphabet or picture symbol to facilitate the design and recognition of the marker.
The QR code has strength in terms of cost since it can be cheaply printed. Therefore it has many
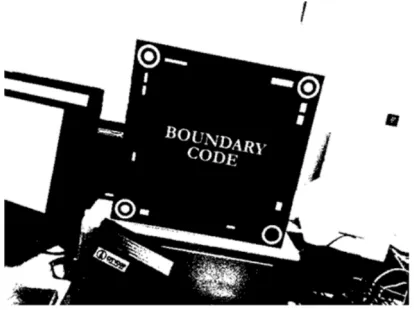
[image:2.612.145.256.525.636.2]applications such as retail, logistics, manufacturing, healthcare, and other industries. However, the QR code can only be used to recognize very close things In order to recognize QR code images from a distance, we may take a simple way to enlarge the code size. As shown in Figure 3, we can see that the QR code covers almost the entire wall to be recognizable from a long distance. In this case, unfortunately there is no room for human-readable contents.
Figure 3: Example Of A Large QR Code For Recognition At A Long Distance; Courtesy To [4]
In this paper, we propose a new recognizable image code from a long distance by increasing the size of the code blocks without removing the room for human-readable contents on a sign board.
Our solution is to place code blocks on the boundary area of a rectangle shaped sign board as shown in Figure 4. To dispose the code blocks on the boundary area, we propose to adopt a line-shaped code. In fact, lines have several distinctive features, as shown in Table 1. Typical features of a line are length, style, thickness, and intensity. Here, we present only two feature values for each line feature. For more capacity, we can increase the number of feature values to two or more or we can use more features like color and various simple symbols.
[image:2.612.327.503.579.705.2]
1295 Table 1. Typical Line Features
Feature Value 1 Value 2
Length short long
Style solid dot
Thickness thin thick
Intensity bright gray
2. PROPOSED BOUNDARY CODE BLOCKS
2.1 Distinctive 4-Bit Code Blocks
We tailored the design of the code to take into account recognition performance. We chose 4 line features of Table 4 except for the length feature. Long and short lengths are difficult to define and even hard to recognize. We finally decided to use the location of the dot component, which is a line component.
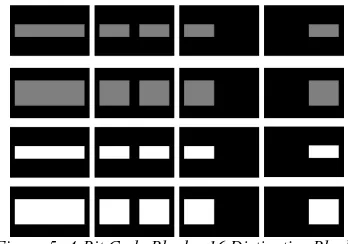
As a result, we designed easily recognizable 4-bit code blocks. The final 16 code blocks are illustrated in Figure 5. Each code block has a thick black border like the AR marker. The 3rd and 4th columns
[image:3.612.351.485.141.279.2]in Figure 5 are separated by the location feature.
Figure 5: 4-Bit Code Blocks, 16 Distinctive Blocks
Since each binary feature is very distinctive, it is advantageous to ensure recognition performance. In other words, if we can detect a block with a thick black border, we can easily distinguish the block from 16 blocks even if a captured image has noise or some distortions through relatively simple image processing.
Firstly, we can clearly distinguish the white intensity of the line segment from the gray intensity by a simple thresholding technique. The other features can be determined whether the intensity values of the specific area are close to 0 or not.
We will place 16 unique blocks on the edge of the board. We call it a boundary code.
2.2 Specifications of Location Mark and Code
Block
In order to recognize the image code, the image code area must be detected for a given image. We
borrow the technique from the QR code. In the QR code, the location mark was carefully designed for quick detection.
Figure 6: Location Mark
When the line is drawn in any direction, the black area and the white area on the line have the ratio of 1:1:3. This specific ratio allows the system to quickly find the location mark. The specification of the location mark we designed is shown in Figure 6. In section 3, we provide a detection algorithm for this location mark by considering this structure.
In order to easily estimate the location of each code block from the location mark, we designed that the location mark and the code block should be arranged in the same 8 units, respectively. Here, there exists 1-unit distance between the location mark and the next code block since the actual size of the location mark is 7 units. This structure is shown in Figure 7.
Figure 7: The Same 8 Units For Location Mark And Code Block With 1-Unit Distance Between Them.
2.3 8-byte Boundary Code Board
[image:3.612.106.280.367.489.2] [image:3.612.316.520.488.590.2]1296 Figure 8: A Sign Board With An 8-Byte Boundary
Code
When the size of the board is sufficient, we can increase the capacity. For example, if we can use six 4-bit code blocks on an edge, we can extend to 24 bytes (6 blocks/edge x 4 bits / block x 8 edges). This capacity is still very small compared to the existing image code, but it is sufficient in an environment that is always connected to Internet. In the case of beacons, a total of 20 bytes are allocated, including user specific 4 bytes.
3. DETECTION AND RECOGNITION
This section describes code recognition process for a given input image. The processing steps are as follows:
• Detect Location mark
• Reconstruct Boundary code area • Extract Code block area • Recognize Code block
In the first step, we find the four vertices of the rectangle in which the boundary code exists. The second step reconstructs the boundary code from the front using the four acquired vertices. In the third step, we estimate the location of each code block using the topographical information of the restored location marker image. Finally, in the fourth step, we classify each code into one of 16 code blocks and allocate the predefined bits.
3.1 Detect Location Mark
The first step is very important because it determines the overall recognition performance. We proposed an algorithm for detecting the location marks as shown in Figure 9. It consists of 5 processing modules.
Figure 9: Location Mark Detection Procedure
In the first module, we binarize a given input image using Ostu’s method [17]. This method automatically determines the binarization threshold to maximize the variance between background and foreground pixels. The result image is given in Figure 10.
Figure 10: Binary Image
[image:4.612.314.521.483.638.2]1297 see that the contours of location marks remain, however some long lines and irregular shapes also remain.
Figure 11: Candidate Contours In Red Color
Since the contours of location mark have a circle shape, the aspect ratio of a circular contour is close to one. Therefore, we can refine the candidates by removing contours that are not close to 1 in aspect ratio.
In third module, we find contours according to an inclusion relationship among them. Actually we make a list of contour groups. To make it, we firstly sort the contours by their size. Then we check both position and size of the contour in turn.
In fourth module, we leave contour groups with 3 contours only by taking the following steps. Firstly, for each contour group we leave only the case where the ratio between the contours is 1/2 to the predefined max times. At first, we set 5 for the max. Then, we remove the contour group with less than 3 contours. If a contour group has more than 3 contours, we reset the max by 0.9 times of the previous max. We repeat this process until contour groups have less than 3 contours. Of course, we remove the contour group with less than 3 contours. After all, we can leave the contour groups consisting of 3 contours. Actually the left groups are the location marks we are looking for, because the outermost contour of the location mark has two contours.
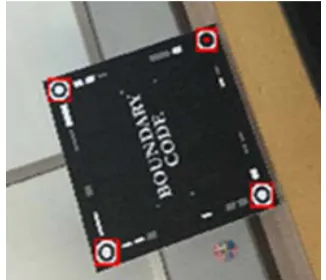
Finally, we check the similarity among the contours for each group. From the similarity, we can remove again the outer contour that does not resemble the inner contours. This last step can remains only location marks as shown in Figure 12.
3.2 Detect Alignment Mark
The alignment mark is similar to the location mark except that there is no inner circle. Therefore, the detection procedure is also similar. In section 3.1, we leave contour groups with 3 contours only,
[image:5.612.336.499.185.325.2]here we leave contour groups with 2 contours only. Before taking this step, we firstly estimate the candidate location for the alignment mark from the 3-location marks we found. In general pictures, we can easily face areas with one internal contour. This candidate estimation process must be preceded. Figure 12 shows the final detection results.
Figure 12. Detection Result Of Location And Alignment Marks
3.3 Reconstruct Boundary Code Area
The boundary code is assumed to be captured at a long distance, so that it is often taken obliquely. This assumption leads to distortion of the boundary code area. To compensate for this distortion, we use perspective transform that maps any rectangle to any other rectangle. The transform is as follows:
1
1
(1)
1298
(2)
[image:6.612.114.275.283.437.2]We can calculate 8 parameters from the matrix above. Then, we apply the transformation parameters obtained from Eq. (2) to Eq. (1) to compute the transformed coordinates. Finally, we can reconstruct the boundary code image by applying backward warping [18]. The reconstruction image is shown in Figure 13.
Figure 13: Reconstructed Boundary Code Image
If we cannot detect an alignment mark, we reconstruct the boundary code image using the affine transform with the coordinates of the three location marks. In this case, we cannot handle severe distortions.
3.4 Extract Code Block Area
If we already know the unit length, it is easy to extract the code block area. Actually, we can estimate the unit length through the distance relation among four location marks. We placed code blocks one unit away from the mark and made each code block 8 units long. Therefore, we can extract each code block by an 8-unit interval from the location that is one unit length away from each location mark.
Figure 14: Recognized Code For Each Code Block We can also find the center line for each code block. This center line is import to identify the code block. Figure 14 shows the detected code blocks in red rectangles. The center lines are drawn in green line.
3.5 Recognize Code Block
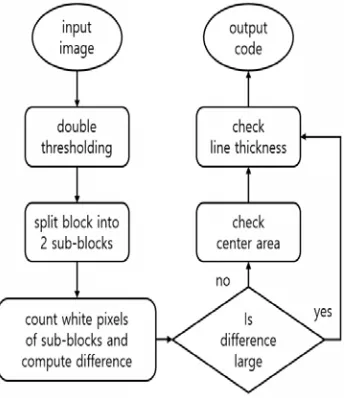
To recognize the code number, we need to distinguish 4 types of line features such as line thickness, line style, location of dot element, and line intensity. The proposed processing steps are shown in Figure 15.
Figure 15: Code Block Recognition Procedure
In step 1, we apply the double threshold to extract gray and white region for further distinguishing whether the brightness of the line is gray or white.
[image:6.612.333.505.422.621.2]1299 length of the lines, we can find the long axis. It can be achieved by bisecting a code block.
In step 3, we count the number of white pixels for each sub-block. If the difference between these two values is significant, we determine that the dot element is on the larger side.
In step 4, if there is little difference between these two values, we further check that there is no pixel at the center of the code block using the projection technique [19]. We observe whether a steep slope change occurs near the center of the code block. We recognize it as a dashed line if the pixel-free section appears at the center, or as a solid line otherwise.
Finally, we classify the thickness by checking whether the short axis pixel length is greater or less than 1.5 unit length in the code block. The final
recognition result is also shown in Figure 14.
4. EXPERIMENTAL RESULTS
We produced a sign board with a 30x30cm to test the recognition performance of the proposed image code.
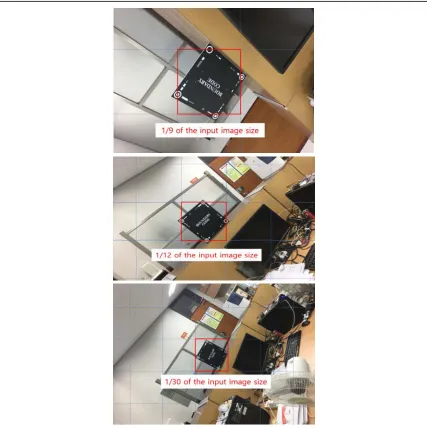
We photographed the images with different shooting distances from 1m to 3m using a smartphone camera. At a distance of 1 meter, we obtained an image whose sign board size is 1/8 of the input image size. At a distance of 2 meter and 3 meter, we obtained 1/12 and 1/30 size image of the input image size respectively. The example picture is shown in Figure 16. As shown in Figure 16, we can see that actual image code area is quite small when the shooting distance is 3 meters.
[image:7.612.101.528.292.720.2]In addition, we took five shooting angles from 0
1300 to 75 degrees by 15 degrees. In this way, we get 183 images. Figure 17 shows some of the images obtained by varying the shooting distance and angle.
[image:8.612.90.530.53.580.2]The recognition results are listed in Table 1. The recognition rate was recorded according to angle and shooting distance. The photographing distance is replaced with the size of the sign board with respect to the size of the image.
Table 1: Recognition performance shooting
angle
size (~distance)
1/9 1/12 1/30
0⁰ 10/10 10/10 11/11
15⁰ 10/10 9/9 10/10
30⁰ 10/10 10/10 10/10
45⁰ 10/10 10/10 10/10
60⁰ 10/10 10/10 8/8
75⁰ 10/10 3/14 5/11
1301 In our experiments, we succeeded in 168 images out of 183 images. We achieved 91.8% performance in recognition accuracy.
For 75 degrees images with the 1/12 and 1/30 size, the recognition accuracy drastically drops to 50% or less. This is due to the inevitable failures to extract the contours of location marks. It is difficult to extract them from images of this quite small size with this angle since the inner most contours of location marks are almost disappears. In fact, we found out that the contours of the mark disappears when the image size is quite small. In addition, in case of shooting angle is large, the contours overlap each other.
With the exception of this case, the proposed method achieved 100% recognition accuracy in our experiments regardless of the shooting distance and angle. This means that the proposed image code is easily recognizable.
5. CONCLUSIONS
We designed distinctive 4-bit code blocks that can be used in new image code, we call it boundary code, for both machine and human by placing the code blocks on the boundary area and providing a space for human-readable contents in the center area.
We also provided a simple method to detect and recognize the boundary code in a given input image.
We demonstrated that the proposed code block is very distinctive by achieving a high recognition accuracy for images even captured at a serious shooting angle and at a long distance compared to the conventional image code images.
The weak point of the proposed code is that the code capacity is small. However, it does not matter in the current situation that the Internet is always connectable. We can access the Internet contents with a proper identifier we can obtain from the image code. Therefore, the proposed extendable 8 bytes capacity is sufficient.
ACKNOWLEDGEMENT
This paper was supported by Research Fund, Kumoh National Institute of Technology
REFRENCES:
[1] S. Weis, Radio-Frequency Identification, Handbook of Computer Networks, Vol. 3, 2012. [2] What is a Beacon, Retrieved from
https://ontakt.io/beacon-basics/what-is-a-beacon.
[3] Barcode, Retrieved from
https://en.wikipedia.org/wiki/Barcode. [4] QR code, Retrieved from
https://en.wikipedia.org.wiki/QR_code. [5] Data Matrix, Retrieved from
https://en.wikipedia.org/wiki/Data_Matrix. [6] T. Kawano, Y. Ban, and K. Uehara, “A Coded
visual marker for video tracking system based on structured image analysis”, IEEE and ACM Int’l Symposium on Mixed and Augmented Reality, 2003.
[7] G. Jancke, “High Capacity Color Barcodes”, Retrieved from https://en.wikipedia.org/wiki/Hi gh_Capacity_Color_Barcode, Dec., 2007. [8] Foster, H. David, “Color Constancy”, Vision
Research, Vol. 51, No. 7, pp. 674–700, 2011. [9] K. Barnard, V. Cardei, and B. Funt. A
comparison of computational color constancy algorithms. i: Methodology and experiments with synthesized data. IEEE Transactions on Image Processing, Vol. 11, No. 9, pp. 972-984, 2002.
[10] A. Gijsenij and T. Gevers. Color constancy using natural image statistics and scene semantics. IEEE Transactions on Pattern Analysis and Machine Intelligence, Vol. 33, No. 4, pp. 687–698, 2011.
[11] A. Chakrabarti, K. Hirakawa, and T. Zickler. Color constancy with spatio-spectral statistics. IEEE Transactions on Pattern Analysis and Machine Intelligence, Vol. 34, No. 8, pp. 1509- 1519, 2012.
[12] ARTookKit, Retrieved from http://www.hitl. washington.edu/research/sharedspace/downloa. [13] ARVIKA, Retrieved from http://www.arvika.de
/www/index.htm.
[14] X. Zhang, Y. Genc, and N. Navab., "Taking AR into large scale industrial environments: Navigation and information access with mobile computers", IEEE Int’l Symposium on Augmented Reality, 2001.
[15] M. Appel and N. Navab., "Registration of technical drawings and calibrated images for industrial augmented reality", IEEE Workshop on Applications of Computer Vision, 2000. [16] K. Ruan, and H. Jeong, "An Augmented Reality
System Using QR Code as Marker in Android Smartphone", Int’l Conf. on Engineering and Technology, 2012.
1302 [18] B. Chen, F. Dachille, and A. Kaufman,
“Forward Image mapping”, Proceedings Visualization, 1999.
![Figure 1: Example Of Image Codes; Courtesy To [3]](https://thumb-us.123doks.com/thumbv2/123dok_us/8904451.956215/1.612.328.506.505.687/figure-example-image-codes-courtesy.webp)
![Figure 3: Example Of A Large QR Code For Recognition At A Long Distance; Courtesy To [4]](https://thumb-us.123doks.com/thumbv2/123dok_us/8904451.956215/2.612.145.256.525.636/figure-example-large-code-recognition-long-distance-courtesy.webp)