IJPSR (2014), Vol. 5, Issue 3 (Research Article)
Received on 19 October, 2013; received in revised form, 18 November, 2013; accepted, 11 February, 2014; published 01 March, 2014 SIMULTANEOUS ESTIMATION OF ESOMEPRAZOLE MAGNESIUM TRIHYDRATE, ITOPRIDE HYDROCHLORIDE AND MOSAPRIDE CITRATE BY RP-HPLC METHOD: OPTIMIZATION, DEVELOPMENT, VALIDATION AND APPLICATION TO LABORATORY SAMPLE.
Darshan Gohil, Prachi Bhamre, Reshma Jain and Sadhana Rajput*
Quality Assurance Laboratory, Centre of Relevance and Excellence in Novel Drug Delivery System, Pharmacy Department, The Maharaja Sayajirao University of Baroda, Fatehgunj, Vadodara – 390 002, Gujarat, India
ABSTRACT: A simple, rapid, accurate, precise and economical RP- HPLC method with UV detection was optimized, developed and validated as per ICH-Q2 guideline for the simultaneous estimation of Esomeprazole magnesium trihydrate (ESO), Itopride hydrochloride (ITO) and Mosapride citrate (MOSA) in laboratory sample. An optimum condition of separation and detection was developed on a
reverse-phase Supelco 516 C18 DB column (250mm×4.6mm i.d., 5µ
particle size), using a mobile phase composition of phosphate buffer
(20mM, pH-7.4 adjusted with sodium
hydroxide):acetonitrile:methanol in the ratio of a 20:20:60 (%v/v) at a flow rate of 1.0 ml/min with UV detection at 275 nm within 6 min with retention time of 3.09, 3.89 and 5.19 for ESO, ITO and MOSA respectively. The standard curves were linear over the concentration range of 2-12 μg/mL, 7.5-45 μg/mL and 1.5-9 μg/mL for ESO, ITO
and MOSA respectively with R2 more than 0.999. The developed
method was validated in terms of accuracy, precision, linearity, limit of detection, limit of quantification. From the validation results it was concluded that proposed method can be used for the estimation of three drugs in laboratory sample.
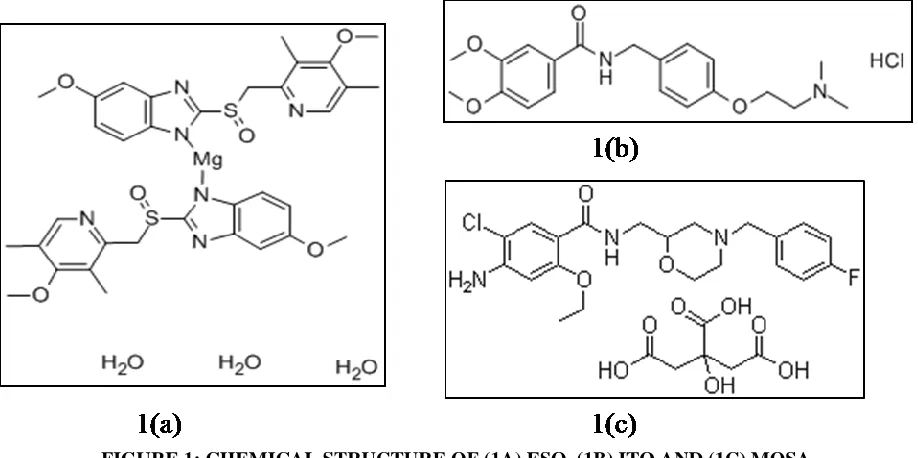
INTRODUCTION: Esomeprazole Magnesium Trihydrate (ESO) is chemically known as bis{6- methoxy-2[(S)-{(4-methoxy-3,5-dimethylpyridine-2-yl)methane}sulfinyl]-1H-1,3-benzimidiazole,
magnesium trihydrate [Figure 1(a)] and used as a
proton pump inhibitor for the symptomatic treatment of hyperacidic condition.
QUICK RESPONSE CODE
DOI:
10.13040/IJPSR.0975-8232.5(3).907-12
Article can be accessed online on:
www.ijpsr.com
DOI link: http://dx.doi.org/10.13040/IJPSR.0975-8232.5(3).907-12
Itopride hydrochloride (ITO) is chemically known as
N-[[4-(2-dimethyaminoethoxy)phenyl]methyl]-3,4-dimethoxybenzamide hydrochloride) [Figure
1(b)], it inhibits dopamine and has a gastrokinetic
effect. Itopride is indicated for the treatment of functional dyspepsia and other gastrointestinal
conditions. Mosapride citrate (MOSA) is
chemically known as 4-amino-5chloro-2-ethoxy-N-[[4-[4-flurophenyl)methyl]morpholin-2-yl]methyl]
benzamide 2-hydroxypropane [Figure 1(c)].
It is a gastroprokinetic agent that acts as a selective 5HT-4 agonist, which accelerates gastric emptying and is used for the treatment of acid reflux, irritable bowel syndrome and functional dyspepsia.
Keywords:
Esomeprazole magnesium trihydrate, Itopride hydrochloride, Mosapride
citrate, isocratic, RP-HPLC
Correspondence to Author:
Sadhana Rajput
Quality Assurance Laboratory, Centre of Relevance and Excellence in Novel Drug Delivery System, Pharmacy Department, G. H. Patel Building, Donor’s Plaza, The Maharaja Sayajirao University of Baroda, Fatehgunj, Vadodara – 390 002, Gujarat, India.
FIGURE 1: CHEMICAL STRUCTURE OF (1A) ESO, (1B) ITO AND (1C) MOSA
The literature survey revealed that there are several analytical methods reported for ESO, ITO and MOSA either individually or in combination with
other drugs like spectrophotometric method 1-11,
RP-HPLC 11-15, stability indicating UPLC method
16
, stability indicating HPTLC method 17,
determination of itopride hydrochloride in human plasma by RP-HPLC with fluorescence detection
18
.However, there is no analytical method reported
for the simultaneous determination of these drugs in a pharmaceutical formulation. The main aim of the present work is to develop a simple, rapid, accurate and precise RP-HPLC method for simultaneous determination of ESO, ITO and MOSA in laboratory sample. The proposed method
was validated as per ICH guidelines 19.
During the development process of the present method, effect of mobile phase pH (which influences the ionization state of compounds) and mobile phase composition (which influences peak
separation) were studied on various
chromatographic parameters such as resolution, plates, asymmetry factor, and retention time.
MATERIALS AND METHODS:
Instrumentation: Chromatographic separation was performed on Shimadzu (Shimadzu Corporation, Kyoto, Japan) LC system equipped with Shimadzu LC-20AT pump and Shimadzu SPD-20AV detector and Rheodyne 7725 injector with fixed loop of 20 μl. Data acquisition and integration was performed using Spinchrome software.
A reverse-phase Supelco 516 C18 DB column with
dimension of 250mm×4.6mm i.d., 5µm particle size was used.
Chemicals and reagents: Reagents such as HPLC grade acetonitrile and HPLC grade methanol were purchased from Spectrochem Pvt. Ltd. (Mumbai, India). Potassium dihydrogen phosphate and sodium hydroxide were purchased from Loba Chemicals Pvt. Ltd. (Mumbai, India). All the solutions were prepared in double distill water. Unless otherwise specified, all solutions were filtered through a 0.2 µm Ultipor® N66® Nylon 6, 6 membrane filter (Pall Life Sciences, USA) prior to use.
Year of Experiment: 2013.
Site: Quality Assurance Laboratory, Centre of Relevance and Excellence in Novel Drug Delivery System, G. H. Patel Building, Donor’s Plaza, The
Maharaja Sayajirao University of Baroda,
Fatehgunj, Vadodara – 390 002, Gujarat, India.
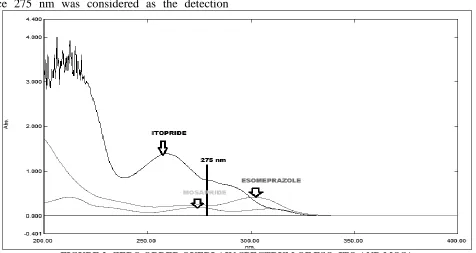
Sensitivity of three drugs was found optimum at 275 nm as compared to the other wavelengths hence 275 nm was considered as the detection
wavelength. Zero order overlain of UV spectra is
[image:3.612.69.545.75.328.2]shown in Figure 2.
FIGURE 2: ZERO ORDER OVERLAIN SPECTRUM OF ESO, ITO AND MOSA
Preparation of standard solutions: Stock solutions of 100 µg/ml of pure ESO, ITO and MOSA were freshly prepared in the mixture of water: methanol (50:50). Aliquots of these solutions were diluted stepwise with the mobile phase to obtain 10 µg/ml of ESO, ITO and MOSA. These solutions were used for the optimization and trials of the proposed method.
Preparation of Laboratory Sample: The combined dosage formulation of ESO, ITO and MOSA is the product of Orbit Life Science Pvt. Ltd
20
which is not yet available in the market, so a laboratory sample was prepared using the
excipients and by following the standard
procedure21. The formula for laboratory sample
used for analysis is mentioned in Table 1. 250 mg
of laboratory sample was weighed and dissolved in methanol: water (50:50) to make up the volume
upto 100 ml. The solution was filtered through whatman filter paper No. 41 and 0.45 μm membrane filter to remove undissolved substances. From this filtrate, 0.5 ml of aliquote was taken and diluted upto 50 ml to give resultant sample solution which was injected in HPLC. The chromatogram of the laboratory sample solution has been shown in
[image:3.612.66.571.470.753.2]Figure 3.
TABLE 1: Formula for Synthetic Mixture
Sr. No Chemical Quantity (mg)
1 Esomeprazole Magnesium
Trihydrate 30
2 Itopride Hydrochloride 150
3 Mosapride citrate 40
4 Eudragit L-100 14
5 Hydroxy Propyl Methyl Cellulose 14
6 Talc 2
Total 250
Validation parameters: The proposed methods were validated as per ICH guidelines for linearity, precision, accuracy, sensitivity, robustness.
1. Linearity: Linearity was determined by taking six different concentrations of ESO, ITO and MOSA in triplicate and calibration curves were plotted in specified range of 2-12 μg/ml, 7.5-45 µg/ml and 1.5-9 μg/ml for ESO, ITO and MOSA respectively. Calibration curve was evaluated using the least square method within
Microsoft Excel® program.
2. Precision and accuracy: Intra-day precision and inter-day precision for developed method was measured in terms of percentage relative standard deviation (% R.S.D). The experiments were repeated three times a day for intra-day precision and on three different days for inter-day precision. For the developed method the accuracy was studied using standard addition method at the levels of 50%, 100% and 150%.
3. Sensitivity: Sensitivity of the method was determined by calculating LOD and LOQ using following equation:
LOD =3.3*σ/S ……….. (1)
LOQ =10*σ/S ……... (2)
Where: σ = Standard deviation of the response and S = Slope of the calibration curve
4. Robustness: Robustness of methods was determined in form of % R.S.D by small deliberate changes in flow rate, mobile phase ratio and pH of mobile phase.
5. System suitability parameters: System suitability parameters were studied to verify that resolution and reproducibility of the system are adequate for the analysis. Parameters such as selectivity, theoretical plates, asymmetry, and resolution and capacity factor have been determined.
RESULTS AND DISCUSSION:
Optimization of method:
(1) Effect of mobile phase pH: As with the aim of
the optimization of mobile phase pH (7.0, 7.4, and 7.8), the remaining factors were kept constant, i.e. mobile phase composition phosphate buffer (20mM, pH-7.4 adjusted with sodium hydroxide): acetonitrile: methanol in the ratio of a 20:20:60 (%v/v) and flow rate of 1 ml/min. The number of theoretical plates as well as resolution between ESO and ITO as well as ITO and MOSA were found to be
higher at pH 7.4. Thus, the best
chromatographic separation was achieved at pH 7.4, and hence was considered to be optimum.
(2) Effect of mobile phase composition: The
mobile phase composition, i.e. phosphate buffer
(20mM, pH-7.4 adjusted with sodium
hydroxide): acetonitrile: methanol was varied at 30:20:50, 20:20:60 and 10:20:70 while keeping the pH 7.4 and flow rate of 1.0 ml/min. Generally, increasing the organic solvent concentration in the mobile phase induces a decrease in distance between the solute
molecule and terminal carbon atoms (C18) in
the ODS ligand and results in lower retention time. This may be explained by elution power of mobile phase decreased at 30:20:50 v/v; hence as the relative amount of organic phase decreased, the three drug components were eluted at higher retention time.
The elution power of mobile phase was increased at 10:20:70 v/v composition, resulting in the elution of ESO and ITO at 2.23 and 2.75 min retention time respectively (this low retention time could not give proper resolution between the peaks from sample matrix and so this ratio was not selected). However, at 20:20:60, v/v composition, proper resolution was achieved along with appropriate elution
time and hence this composition was
considered as optimum.
Validation:
1. Linearity: Method was found to be linear over concentration range of 2-12 μg/ml, 7.5-45 µg/ml and 1.5-9 μg/ml for ESO, ITO and MOSA respectively. The linear regression equations were calculated by the least squares method using Microsoft
Results of linearity are shown in Table 2
and the R2 values were found to be 0.9993,
0.9993 and 0.9991 for ESO, ITO and MOSA respectively.
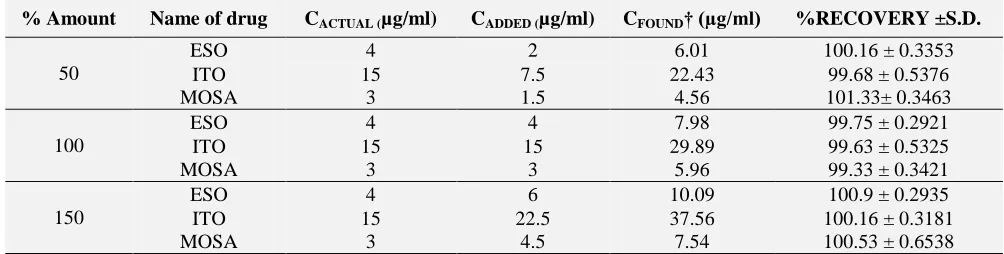
2. Precision and Accuracy: The results of precision were found to be with less than 2% relative standard deviation for the drugs ESO, ITO and MOSA respectively for intra-day and inter-day precision. These results suggest that
the developed analytical method is precise and reproducible. In order to examine the accuracy of method, recovery studies were carried out by standard addition method at different levels of 50%, 100% and 150% and the recovery was found to be between 98-102%. Precision and
recovery results are explained in table 2 and
table 3 which conclude that the method has enough reproducibility and accuracy so that it can be applicable to laboratory sample.
TABLE 2: VALIDATION PARAMETERS OF RP-HPLC METHOD FOR ESO, ITO AND MOSA
Parameters ESO ITO MOSA
Detection Wavelength 275 (nm)
Linearity range (µg/ml) 2-12 7.5-45 1.5-9 Regression Coefficient (R2) 0.9993 0.9993 0.9991 Regression equation (y=mx+c) y=15.522x +7.231 y= 10.412x +14.714 y= 9.9728x +6.3917
LOD(µg/ml) 0.0733 0.0598 0.3047
LOQ (µg/ml) 0.2227 0.2904 0.9236
[image:5.612.54.556.340.467.2]Intra-day Precision (%RSD) 0.2746 0.5206 0.7712 Inter-day Precision (%RSD) 0.9079 1.0351 1.7339
TABLE 3: RESULTS OF RECOVERY STUDY OF ESO, ITO AND MOSA BY RP-HPLC METHOD
% Amount Name of drug CACTUAL (µg/ml) CADDED (µg/ml) CFOUND† (µg/ml) %RECOVERY ±S.D.
50
ESO 4 2 6.01 100.16 ± 0.3353
ITO 15 7.5 22.43 99.68 ± 0.5376
MOSA 3 1.5 4.56 101.33± 0.3463
100
ESO 4 4 7.98 99.75 ± 0.2921
ITO 15 15 29.89 99.63 ± 0.5325
MOSA 3 3 5.96 99.33 ± 0.3421
150
ESO 4 6 10.09 100.9 ± 0.2935
ITO 15 22.5 37.56 100.16 ± 0.3181
MOSA 3 4.5 7.54 100.53 ± 0.6538
† Mean value of three determinations
3. Sensitivity: To study the sensitivity of optimized method LOD and LOQ were determined using blank replicate injections by equation 1 and 2. LOD values for ESO, ITO and MOSA were found to be 0.0733 µg/ml, 0.0598 µg/ml, 0.3047 µg/ml and LOQ values were 0.2227 µg/ml, 0.2904 µg/ml, and 0.9236 µg/ml respectively. These results show that method is enough sensitive for the analysis of laboratory sample. Results of LOD and LOQ
are incorporated in Table 2.
4. Robustness: Robustness of the method was determined by small deliberate changes in flow rate, mobile phase ratio, pH of mobile phase and detection wavelength. The method was found to be enough robust and will provide accurate results in normal quality control labs
even if there is some sort of experimental error by human or system.
5. System suitability parameters: System suitability parameters were studied to verify the optimum conditions. Different parameters have been evaluated such as resolution, capacity factor, separation factor, theoretical plats and
asymmetry. The results obtained are
summarized in Table 4.
TABLE 4: SYSTEM SUITABILITY PARAMETERS VALIDATED RP-HPLC METHOD
SST Parameters ESO ITO MOSA
Retention Time 3.097 3.890 5.187 Capacity factor (k) 1.62 2.21 3.17 Separation factor (α) 2.5808 1.256 1.333 Theoretical plates (USP) 3863 4779 5107 Resolution (Rs) - 3.187 4.406
Analysis of the laboratory sample: As the preliminary validation parameters show satisfied results hence the method was applied to laboratory sample. In the assay of laboratory sample, percentage purity was found to be 101.5462 ± 0.3883 % w/w, 98.7254 ± 0.4553 % w/w and 99.4632±0.3243% w/w for ESO, ITO and MOSA respectively. The results for percentage purity are
also shown in Table 5.
TABLE 5: PERCENT PURITY (ASSAY) OF ESO, ITO AND MOSA IN SYNTHETIC MIXTURE
ESO±S.D ITO±S.D MOSA±S.D
99.75 ± 0.2921 99.63 ± 0.5325 99.33 ± 0.3421 *Mean value of three determinations ± Standard Deviation
CONCLUSION: The proposed RP-HPLC method can be applied for the simultaneous determination of ESO, ITO and MOSA. Moreover this method is simple, rapid, accurate, precise, reliable and economic. This method can be used for routine quantitative estimation of three components in laboratory sample.
REFERENCES:
1. Kumar PR, Shayle S, Gouda MM and Kumar SM: Physicochemical characterization, UV spectrophotometric method development and validation studies of Esomeprazole magnesium trihydrate. Chem. Pharm. Res 2010; 2(3): 484-490.
2. Gawande VV and Chandewar AV: Spectroscopic estimation of Esomeprazole magnesium in solid dosage form. International Journal of Pharmacy & Technology 2010; 2(3): 617-622. 3. Zate SU, Kothawade PI, Gajbe JW, Pramod AS and Boraste SS:
Spectrophotometric method development and validation of Itopride hydrochloride in bulk and dosage form. International Journal of Drug Delivery 2010; 2(4): 340-343.
4. Gupta KR, Joshi RR, Chawla RB, Wadodkar SV: UV Spectrophotometric Method for the Estimation of Itopride Hydrochloride in Pharmaceutical Formulation. E-Journal of Chemistry 2010; 7(S1): S49-S54.
5. Patil SS, Dhabale PN and Kuchekar BS: Development and statistical validation of spectrophotometric method for the estimation of mosapride in pharmaceutical formulation. International Journal of PharmTech Research 2009; 1(4): 1458-1461.
6. Sojitra C, Pathak A and Rajput S: Development and Validation of Spectrophotometric Methods for Simultaneous Estimation of Naproxen and Esomeprazole Magnesium trihydrate in Combined
Pharmaceutical Formulation. International Journal of ChemTech Research 2012; 4(2): 602-608.
7. Jain NA, Lohiya RT and Umekar MJ: Spectrophotometric determination of naproxen and Esomeprazole in a laboratory mixture by simultaneous equation, absorption correction, absorption ratio and area under curve methods. International Journal of Pharma Sciences and Research 2011; 2(5): 130-134. 8. Gohil D and Rajput SR: Simultaneous estimation of diclofenac
sodium and esomeprazole magnesium trihydrate in bulk drug and in synthetic mixture by spectrophotometry. International Journal of Pharma Sciences and Research 2013; 4(6): 2435-2440. 9. Kaur P, Sarma GS and Vikas P: Development and validation of
derivative spectrophotometric method for simultaneous estimation of domperidone and esomeprazole. International Journal of Universal Pharmacy and Life Sciences 2011; 1(2): 9-15. 10. Indian pharmacopoeia, The Indian pharmacopoeia commission,
Ghaziabad, 2010, Vol. -2, 1295-1296.
11. Birajdar AS, Meyyanatahn SN and Suresh B: Determinatiion of mosapride and Pantoprazole in a fixed-dose combination by UV spectrophotometric methods and RPHPLC. International Journal of Pharmaceutical Studies and Research 2011; 2(2): 29-36. 12. Chandraiah MR and Reddy YV: RPHPLC method for estimation
of itopride hydrochloride from tablets dosage form. Journal of Chemical and Pharmaceutical Research 2012; 4(5): 2649-2651. 13. Patel RK, Raval BP, Patel BH, and Patel LJ: Reverse phase high
performance liquid chromatographic method for the simultaneous estimation of Esomeprazole and Itopride in Capsule. Der Pharma Chemica 2010; 2(1): 251-260.
14. Rao RN, Nagaraju D, Alvi S and Bhirud SB: Development and validation of a liquid chromatographic method for determination of related-substances of Mosapride citrate in bulk drugs and pharmaceuticals. Journal of Pharmaceutical and Biomedical Analysis 2004; 36(4): 759–767.
15. Onal A and Oztunc A: Development and validation of high performance liquid chromatographic method for the determination of Esomeprazole in tablets. Journal of Food and Drug Analysis 2006; 14(1): 12-18.
16. Nalwade SU, Reddy VR, Rao DD and Morisetti NK: A validated stability indicating ultra-performance liquid chromatographic method for determination of impurities in Esomeprazole magnesium gastro resistant tablets. Journal of Pharmaceutical and Biomedical Analysis 2012; 57: 109–114.
17. Bageshwar D, Khanvilker V, Kadam V: Stability indicating high performance thin-layer chromatographic method for simultaneous estimation of pantoprazole sodium and itopride hydrochloride in combined dosage form. Journal of Pharmaceutical Analysis 2011; 1(4):275–283.
18. Ma J, Yuan LH, Ding HJ, Zhang J, Zhang Q and Zhou XM: Determination of Itopride hydrochloride in human plasma by RP-HPLC with fluorescence detection and its use in bioequivalence study. Pharmacological Research 2009; 59(3): 189–193. 19. International conference on harmonisation of technical
requirements for registration of pharmaceuticals for human use ICH harmonised tripartite guideline. Validation of analytical procedures: text and methodology Q2(R1). 1996.
20. http://www.orbitlifescience.com/formulation-An.html accessed on: Jan 2013
21. Lachmann L, Lieberman HA and Kanig JL. The Theory & Practice of Industrial Pharmacy, Mumbai: Warghese Publication 2009.
All © 2013 are reserved by International Journal of Pharmaceutical Sciences and Research. This Journal licensed under a Creative Commons Attribution-NonCommercial-ShareAlike 3.0 Unported License.
This article can be downloaded to ANDROID OS based mobile. Scan QR Code using Code/Bar Scanner from your mobile. (Scanners are available on Google Playstore)
How to cite this article: