BIROn - Birkbeck Institutional Research Online
Lim, Chang-Kee and Lord, Gwyn A. (2002) Current developments in LC-MS
for pharmaceutical analysis. Biological and Pharmaceutical Bulletin 25 (5),
pp. 547-557. ISSN 0918-6158.
Downloaded from:
Usage Guidelines:
Please refer to usage guidelines at or alternatively
Liquid chromatography-mass spectrometry (LC-MS) is an analytical technique that couples high resolution chroma-tographic separation with sensitive and specific mass spec-trometric detection. This includes high performance liq-uid chromatography (HPLC)-MS, capillary electrophoresis (CE)-MS and more recently capillary electrochromatography (CEC)-MS. The technique is still fast developing, particu-larly in the mass spectrometry area, with vastly improved sensitivity and resolution. It is probably the most powerful technique currently available for pharmaceutical analysis.
This review is intended as a discussion on the current de-velopments of LC-MS in pharmaceutical analysis rather than a review of literature alone. Various LC-MS techniques will be described briefly and the advantages and disadvantages of each will be discussed.
DEVELOPMENTS IN LC-MS
Brief History of LC-MS The last twenty years has seen a dramatic increase in the capabilities of MS. At the begin-ning of this period the invention of fast atom bombardment (FAB), by Barber et al.in 1981,1)enabled easier analysis of involatile and thermally unstable molecules, especially those of biological interest. It may be argued that this technique acted as a catalyst for the development of other ionization techniques, such as matrix-assisted laser desorption/ioniza-tion (MALDI) and electrospray ionizadesorption/ioniza-tion (ESI), applicable to such molecules.
The combination of liquid chromatographic techniques with MS has been an important development. Early inter-faces were concerned with coping with the potential of 1 l/min vapour in the MS ionisation source vacuum that would be generated by eluent from typical analytical columns flowing at 1 ml/min. This was achieved by evaporat-ing solvent on a heated movevaporat-ing belt,2,3)or the use of very low flows, such as direct liquid introduction4,5) and
continuous-flow FAB (CF-FAB).6)Thermospray7)and particle beam8)
in-terfaces were improved methods during the 1980s.
Atmospheric Pressure Ionization (ESI and APCI)
Over the last decade, ESI and atmospheric pressure chemical ionization (APCI), have become the dominant techniques su-perseding thermospray etc.and are likely to remain so for the
foreseeable future being inherently the most suitable for ana-lytes in solution presented to the MS. ESI was originally pro-posed by Dole,9)who suggested using charged droplets as a source of ions for MS and Fenn10)pioneered its development
as an ionization source for MS, leading to the first commer-cially available instrument in 1989.
In essence, the electrospray process involves producing a fine spray of ionized droplets from the outlet of a capillary carrying a liquid stream, which may be eluent from HPLC, CE, CEC or direct infusion of sample solution. This is achieved by applying a high voltage (typically 3—5 kV) to the outlet of the capillary at the spray tip, which creates a high electric potential and causes the production of a fine mist of droplets. This occurs at atmospheric pressure, hence the term atmospheric pressure ionization (API), is used. This process of nebulization may be aided by use of gas, usually nitrogen in pneumatically-assisted electrospray, called “ion-spray” by the developers of this technique,11)or by ultrasonic nebulization.12)Nitrogen is also used as an aid to evaporate solvent from the droplets, which become smaller and hence the charge density increases until a point of instability is reached when the droplets break into smaller droplets. This process continues until de-solvated ions are produced, which pass into the high vacuum of the mass analyser through a small opening guided by electrical potential difference. A fuller explanation of the process is beyond the scope of this review, but a dedicated book13) and review14) provide more information.
ESI is a “soft” ionization technique in that little fragmen-tation is produced, forming protonated or de-protonated ions respectively for positive and negative mode MS. Generally, negative mode is less sensitive, except where the nature of the analyte leads to the formation of stable anions, such as with carboxylic acids. An important feature of ESI is that multiply charged ions may be produced with large molecules, enabling their analysis in mass analysers with limited mass range. Mass analysers measure mass (m) to charge (z) ratio, m/z. In most ionization processes predominantly singly charged ions are produced where z51 and m/z5mass, but z can be very large in ESI, especially for proteins. However, for molecules below about 1000 Da, then ESI produces pre-dominantly singly charged ions usually. This would be the
∗To whom correspondence should be addressed. e-mail: [email protected] © 2002 Pharmaceutical Society of Japan
Review
Current Developments in LC-MS for Pharmaceutical Analysis
Chang-Kee LIM* and Gwyn LORD
MRC Bioanalytical Science Group, School of Biological and Chemical Sciences, Birkbeck, University of London; Malet Street, London, WC1E 7HX, U.K. Received February 4, 2002
The current developments in liquid chromatography-mass spectrometry (LC-MS) and its applications to the analysis of pharmaceuticals are reviewed. Various mass spectrometric techniques, including electrospray and nanospray ionization, atmospheric pressure chemical ionization and photoionization and their interface with liq-uid chromatographic techniques are described. These include high performance liqliq-uid chromatography, capil-lary electrophoresis and capilcapil-lary electrochromatography and the advantages and disadvantages of each tech-nique are discussed. The applications of LC-MS to the studies of in vitroand in vivodrug metabolism, identifica-tion and characterizaidentifica-tion of impurities in pharmaceuticals, analysis of chiral impurities in drug substances and high-throughput LC-MS-MS systems for applications in the “accelerated drug discovery” process are described.
case for the vast majority of drug substances currently in use, but peptides and proteins are growing in importance in the pharmaceutical field.
The development of ESI led to a great increase in the use of LC-MS, it proving to be an efficient ionization technique, especially for polar compounds and very compatible with solvents used for reversed-phase HPLC. However, the early interfaces operated at flow rates in the low ml/min range, which was too low for the typical 1 ml/min flow rates from analytical HPLC columns. Thus, it was necessary to split the flow or use capillary/microbore HPLC columns. The devel-opment of nebulization aids as mentioned above enabled higher flows to be accepted so that analytical columns could be connected directly with no splitting of eluent. In addition, aided nebulization produced better droplet formation with a wider range of solvents. Although eluent splitting is now strictly not necessary, it is often advantageous to split the flow from analytical columns or use capillary/microbore columns, keeping the ESI source cleaner and maintaining sensitivity. A further reason relates to the way ESI interfaces behave. Detectors in chromatography are of two main types, concentration-sensitive and mass-sensitive.15) UV detectors respond to changes in analyte concentration and are thus of the former type, while mass-sensitive detectors such as mass spectrometers respond to changes in the analyte mass flow. The response then is proportional to the absolute mass of an-alyte passing through the instrument, rather than concentra-tion. There is an exception to this classification where mass spectrometers fitted with ESI sources behave essentially in a concentration-sensitive way.16)Thus, smaller diameter HPLC columns show higher sensitivity when coupled with ESI-MS, since the analyte is more concentrated, eluting in a smaller volume of eluent. A further advantage of using smaller diam-eter columns and their low eluent flow rate, is that less sam-ple, buffer and contaminants enters the mass spectrometer. Consequently, the ionization source remains cleaner for a longer period, maintaining sensitivity.
A development of ESI, APCI, produces ions by a corona discharge at atmospheric pressure. APCI is mainly applied to rather less polar compounds than ESI, up to about 1500 Da, generally producing singly charged ions and is able to accept flow rates of 1—2 ml/min, utilizing a heated nebulizer to evaporate solvent. The technique is also less susceptible than ESI to ion suppression and has a wider dynamic concentra-tion range, but is unsuitable for thermally unstable com-pounds. In addition, APCI can produce unexpected fragmen-tation, unlike ESI, which being a “soft” ionization method causes little fragmentation. “In-source” fragmentation can be induced by raising the sample cone voltage or MS/MS stud-ies can be performed in a suitable instrument.
Microspray and Nanospray There have been further
developments with ESI involving the use of lower liquid flows. Chowdhury and Chait in 199117)showed that a needle with a fine taper would allow aqueous solutions to be ana-lyzed by ESI. The taper caused a higher electric potential to be produced at the capillary tip facilitating droplet formation and producing more efficient ionization and hence higher sensitivity. Several groups then pursued the development of low-flow interfaces, including Gale and Smith18)and Emmett
and Caprioli,19)the latter using the term “micro-electrospray”
to describe their sub ml/min flow rate technique. Wilm and
Mann20,21)used even lower flow rates of nanolitres per minute
in their “nanospray” technique, employing capillaries with a tapered outlet of 1—2mm inner diameter (i.d.). This method was initially developed for the analysis of single protein sam-ples deposited in the capillary, allowing electrospraying for about 20—30 min from 1ml of sample solution. This allowed ample time to carry out full scan and tandem MS/MS studies with very low sample consumption. This original description of nanospray was an off-line technique of course, but may equally be applied to on-line LC-MS.
The requirements for micro/nano-spray are a low i.d. cap-illary outlet, usually incorporating a tapered tip and electrical contact, which is usually via metal coating of the capillary tip, typically applied by gold deposition. Drawbacks with the technique include the need for a skilled operator and the metal tip coating is not robust, although it is possible to make electrical connection at a coupling prior to the tip.
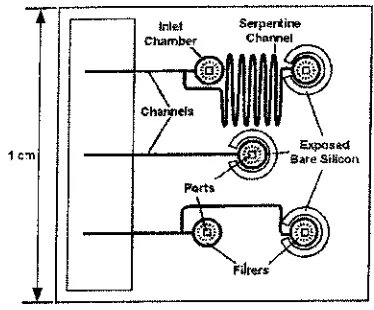
Microfluidics On an even smaller scale, microfluidic chip devices were first reported for ESI-MS in 1997.22—24)
These devices incorporated etched microchannels on glass chips from which solutions were electrosprayed from the mi-crochannel exit. Separations such as CE and CEC can be per-formed on these chips within extended length channels, often with a serpentine configuration. Figure 1 shows a diagram-matic representation of a electrospray chip made by Lee et al.25)and incorporating needles at the channel exits for
elec-trospray. The advantage of using such systems again relates to their possibilities in high throughput analysis and in au-tomation. There are further developments in this area, includ-ing even the incorporation of a mass spectrometer on a chip. A recent short review on the topic provides further informa-tion.26)
[image:3.595.323.510.578.733.2]Matrix Effects Probably the widest application of LC-ESI-MS is in analysis of compounds such as pharmaceuticals in complex biological matrices. However, the presence of components in the matrix can suppress the analyte response, probably by competition for the ESI droplet surface and hence ionization. These effects can cause differences in re-sponse between sample in matrix and standards, leading to difficulties in quantitative analysis and compound identifica-tion. This emphasises the importance of the chromatographic step in the analysis, where good separation can reduce or eliminate these effects. It is interesting to note that it was thought that the invention of coupled MS/MS instruments
would enable analysis of mixtures without separation, but suppression effects prevented this of course.
Generally, inorganic buffers should be avoided for ESI, since being involatile they accumulate in the ion source and preferentially ionize at the expense of the analyte. Ammo-nium acetate and formic acid are preferred to promote ion-ization and act as chromatographic buffers.
Trifluoroacetic acid (TFA) requires a particular mention. TFA and other volatile strong acids used as modifiers in HPLC are not usually compatible with ESI-MS, since they cause ion suppression. In positive ion mode, detection limits for basic compounds are reduced to about one-tenth com-pared to when acetic acid is used.27) Signal suppression is caused by strong ion pairing between the TFA anion and the protonated analyte cation of basic molecules, effectively making them neutral.28)In negative ion mode, complete sup-pression of analyte can occur by TFA competing for charge.29) Aqueous solutions of TFA have high conductivity
and surface tension, which causes spray instability in ESI and many methods have been reported to try to reduce these effects. For example, Kuhlmann et al.,28) used post column addition of propionic acid and isopropanol to improve posi-tive mode ESI-MS. Isopropanol functioned to lower the sur-face tension, which showed only slight improvement in sensi-tivity, whilst propionic acid had a larger effect. The hypothe-sis is that propionic acid as a weaker acid competes with TFA for protons and because TFA is more volatile, it evaporates faster from the electrospray droplet. This results in the acid equilibrium being driven toward deprotonation of the weak acid as the droplet gets smaller and formation of a weak ion pair between analyte and the weak acid anion. This ion pair is sufficiently weak, compared to ion pairing with TFA, that the analyte ion may be ejected and hence sensitivity is im-proved. Other techniques for improvement of sensitivity in-clude the recent report on the use of on-line membrane ex-traction of TFA for negative mode ESI-MS by New et al.29) These techniques may find application where TFA is used in preference for substitution with a more MS compatible buffer such as ammonium acetate. TFA providing superior chro-matographic resolution in many cases, especially for peptides and proteins.
Other Ionization Methods An ideal ionization source is one that ionizes all analytes with the same efficiency. How-ever, suppression effects are a major obstacle in achieving this ideal situation.
A relatively new method of ionization for LC-MS is at-mospheric pressure photoionization (APPI).30,31)The
mecha-nism for APPI is proton absorption and electron ejection from a molecule to form a charged molecular ion in the case of non-polar compounds. This process is independent of the presence of other molecules and does not suffer from ion suppression effects it is claimed.30)In the presence of water or protic solvents, protonated molecule ions can be formed, as with ESI. A further development of the technique uses an ionizable dopant, whose ions react with analyte to improve analyte ionization and sensitivity.31)In this case, similar be-haviour to corona discharge APCI is shown, being suitable for compounds with high basicity or acidity in the gas phase. Thus, protonated or de-protonated ions are formed respec-tively. At present, the techniques have been applied to a lim-ited range of test compounds and further demonstration of
applicability to a range of real samples is needed to prove the worth of what seems to be a very interesting development.
Developments continue in coupling LC with other ioniza-tion techniques, for example, Cappiello et al.32)describe two approaches for coupling electron ionization (EI), with capil-lary HPLC. The first method uses a micro-scale particle beam interface called “Cap-EI” and uses nitrogen to nebulize the liquid stream at 1—5ml/min. The second method in-volves interfacing into a modified EI source at lower flow rates of about 1ml/min. The advantage of using EI ionisation is the possibility of producing library searchable spectra for compound identification from suitable small/medium size molecules of low polarity. The technique is not as widely ap-plicable as ESI, but could offer an additional useful method for analysis.
MALDI will not be discussed here, although being an im-portant technique, it is not routinely connected to LC at pre-sent in a dynamic way, instead, fractions are collected for subsequent analysis. For example, HPLC peptide fractions collected on polymer membranes for later analysis by MALDI.33)Gusev has recently reviewed interfacing MALDI with column and planar separations.34)
CE and CEC CE interfacing is now almost universally viaESI and nanospray is ideal, since it operates at flow rates typical of those produced in CE. Conventional ESI operates at higher flow rates, necessitating a “make-up” flow to about 5ml/min and this is best provided via a co-axial system, as originally described by Smith’s group.35)The make-up liquid is typically an organic solvent such as methanol, facilitating more efficient spray production when mixed at the capillary tip with the usually aqueous CE eluent. Developments in CE/MS have been reviewed.36)
CEC utilizes the same interfaces as CE, as may be ex-pected, being very similar techniques. CEC uses capillaries, typically 50—100mm i.d., packed with HPLC stationary phases. Flow of eluent is achieved by electroosmotic flow, rather than hydrodynamic pumping as in HPLC and separa-tion may be considered a mixture of CE and HPLC partisepara-tion mechanisms. The first coupling of CEC with MS was by Ver-heij et al.,37)who used pressure assistance for eluent flow in the technique known as “pseudoelectrochromatography” and CF-FAB-MS. True CEC with pure electroosmotic flow was also first coupled to CF-FAB-MS,38) but virtually all
subse-quent reports have used ESI. A review39) and a dedicated book40)provide further information.
As noted in the section on matrix effects, the use of inor-ganic buffers that are common in CE/CEC are not desirable and suitable alternatives should be used if possible. However, because the flow rates are so low in these techniques, then a limited amount of inorganic buffer can be tolerated, espe-cially when diluted by a make-up liquid.
spec-tral acquisition, accuracy in mass measurement arising from stability over the m/zrange and no theoretical limit to m/z.41) The use of TOF instruments is likely to continue to increase for the foreseeable future, superseding the use of magnetic sector instruments in many areas.
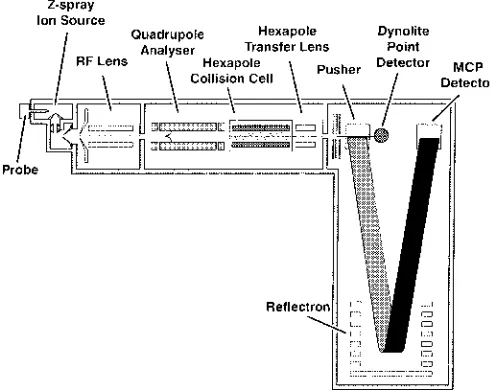
Pharmaceutical compound analysis in the recent past has been dominated by the use of quadrupole and to a much lesser extent, ion-trap instruments, coupled with API sources. This was due to their relatively low cost, small size, mass range and reasonable scanning speed. Coupled tandem MS/MS quadrupole systems in particular have provided structural information and highly selective detection and quantification of specific metabolites by improvements in signal to noise. However, ESI-TOF instruments are now be-coming more prominent in drug analysis, especially when coupled with a quadrupole analyzer as a Q-TOF tandem MS/MS instrument. In addition to the advantages of TOF an-alyzers noted before, the resolution of a Q-TOF instrument is improved by ion focussing in the quadrupole, although mass range is reduced, but duty cycle is also reduced. Figure 2 shows a diagrammatic representation of a Q-TOF instrument fitted with an orthogonal ESI source.
A Q-TOF instrument allows exact mass information to be obtained on both product and precursor ions in a tandem MS/MS experiment, improving analytical capability. Com-parison of the performance of a Q-TOF with a Quadrupole MS/MS instrument for analysis of a drug in plasma, showed the former better in overcoming interference from matrix by more accurate mass measurements.42)
TOF analyzers are able to acquire spectra at a very high rate, in the microsecond range, resulting in high sensitivity and the ability to acquire sufficient data from very narrow chromatographic peaks. Quadrupole only analyzers show much lower sensitivity because they scan (as do magnetic sector analyzers) and spend very little time at any particular m/zvalue. For this reason they show highest sensitivity, simi-lar to a TOF instrument, in selected ion monitoring (SIM) or selected reaction monitoring (SRM) modes, particularly rele-vant for quantitative work. In acquiring product ion spectra, the Q-TOF instrument is 10—100 times more sensitive than
a quadrupole MS/MS instrument, measuring samples in the femtomole range.43)
High throughput analysis with fast chromatography pro-duces very narrow chromatographic peak widths of only a few seconds, as does CE, but a TOF instrument can acquire spectra fast enough to determine them at high accuracy. This obviates, to an extent, the inherent problem of poor chro-matographic efficiency.
Fourier transform-ion cyclotron resonance (FT-ICR), a technique of very high mass resolution will not be discussed in any depth, at present, instrumentation is large, complex and expensive. However, with advances in technology it will become much more prominent in the future, especially in the field of proteomics, for example, capillary HPLC has been coupled to FT-ICR via ESI for proteomics.44,45) The
tech-nique has a useful mass range of about 10000 with capability of 1 million resolution.
LC-MS Instrumentation Many instrument
manufactur-ers now offer combined, integrated HPLC/MS systems, espe-cially resulting from recent HPLC and MS instrument com-pany mergers. However, it is often desirable for the user to purchase separate instruments, to achieve the best perfor-mance. The only drawback with this is that if instruments are purchased from different manufacturers, then software may not be compatible. However, this is becoming less of a prob-lem, as software is available from some manufacturers that will operate instruments from others, especially MS operat-ing systems that can also control several different types of HPLC system.
ESI sources are now usually orthogonal to the analyzer, rather than in-line, resulting in the maintenance of high per-formance by reduction of source contamination, for example, the “Z-Spray” ESI source by “Micromass” (Micromass Ltd., Manchester, U.K.).
The pharmaceutical industry over the last ten years has made increasing demands for faster analytical methods, par-ticularly because of the high sample throughput generated by combinatorial chemistry. LC/MS has been the most promi-nent technique, with its high sensitivity and specificity. Very fast LC gradients of only a few minutes are now used on short columns (typically 3—5 cm long), compared to separa-tions previously on 25 cm long columns with 30—60 min gradients. However, there are limitations of using short columns with fast gradients where chromatographic separa-tion is likely to be incomplete. Suppression effects men-tioned above can be a significant problem.
Samples are also analyzed without any separation by flow injection analysis (FIA), directly into the MS, but again there are inherent problems of ionization suppression.
Fraction collection coupled with LC/MS has also recently been introduced by several manufacturers. These are similar to the previously available systems where selected fractions are collected by their response on a UV detector. For MS, the expected mass triggers collection of a fraction from the elu-ent at a split, prior to the MS. UV detection in parallel with MS also provides further structural information and indica-tion of purity and may display components not observed on the MS (because of inability to ionize or ion suppression).
[image:5.595.36.281.62.257.2]With the advent of fast acquisition TOF MS, it has become possible to maximize sample throughput with multiple inlet systems into one MS to make most economic use of a high Fig. 2. Diagrammatic Representation of Q-TOF Mass Spectrometer with
cost instrument. De Biasi et al.46)have described the use of
four HPLC columns in parallel coupled to one ESI-TOF in-strument. The MS was fitted with a four-channel multiplex ESI source, in which each of the four liquid streams is sam-pled for 0.1 seconds, resulting in the production of individual mass spectra synchronized to each HPLC column. This sys-tem has been developed commercially by “Micromass” (Mi-cromass Ltd., Manchester, U.K.) and coupled to their MS in-struments. Further developments include use of an eight-channel multiplex ESI source and of particular note is the availability of a dual ESI inlet system.47)This has been
devel-oped for accurate mass work where the sample and calibrant may be analyzed in rapid succession and improve accuracy of mass measurements. Another approach48) uses three
switching valves and four HPLC columns for staggering in-jections onto the columns and allowing the mass spectrome-ter to continuously analyze the chromatographic window of interest. Using this approach, the optimized run time is slightly greater than the sum of the widths of the desired peaks.
Combinatorial chemistry has also led to the use of 96-well microtitre plates and their coupling with analytical systems. For example, Liu et al.49)used a multichannel device with an
array of 96 electrospray tips for MS analysis, with potential to analyze 720 samples per hour.
The result of this improved ability to analyze many more samples in a given time and faster acquisition MS instru-ments is the production of large amounts of data. This is be-coming a major issue and improvements in data management are needed utilizing automated processing and interpretation.
APPLICATIONS OF LC-MS
The major applications of LC-MS in pharmaceutical analysis have been in drug metabolism studies, the analysis and identification of impurities and degradation products in pharmaceuticals and the isolation and characterization of po-tential drug substances from natural or synthetic sources.
LC-MS in Drug Metabolism Studies The metabolism
of a potential new pharmaceutical must be studied before it can be considered for further development into a therapeutic agent. A good drug should ideally be metabolically stable and show a good pharmacokinetic profile with high bioavail-ability and long half-life. Some metabolites may also be more pharmacologically active or more toxic than the parent drug. Characterization of the major and active metabolites helps in the discovery and design of new drug candidates with improved pharmacological activity, metabolic stability and toxicology profile.
LC-MS is the method of choice for the study of drug me-tabolism because of its sensitivity and specificity. It also pro-vides molecular weight information and fragmentation pat-terns for structure elucidation. Which ionization technique is used will depend on the structure and the acidity or basicity of the drug studied. In general, positive or negative ion ESI is preferred for strongly basic or acidic drugs respectively, while APCI is more suited for the less basic/acidic or neutral molecules.
In Vitro Drug Metabolism The liver is the primary organ that metabolizes drugs. Preliminary studies of drug metabolism have therefore commonly been carried out in
vitrowith liver microsomal preparations or hepatocytes.50—52)
These provide good initial indication of the metabolic fate of a drug.
The metabolism of droloxifene,53)an analogue of the
anti-breast cancer drug tamoxifen, by human liver microsomes is an example of the application of LC-MS in an in vitro metab-olism study. The HPLC-ESI-MS mass chromatogram is shown in Fig. 3. The metabolites identified (Fig. 4) are N-desmethyldroloxifene [(M1H)1, m/z374], 4-hydroxydrolox-ifene [(M1H)1, m/z 404], droloxifene N-oxide [(M1H)1, m/z404] and a-hydroxydroloxifene [(M1H)1, m/z404]. The example clearly demonstrates the importance of chromato-graphic resolution in LC-MS analysis. There are three metabolites with the (M1H)1 ion at m/z 404 and the un-equivocal identification of these metabolites is difficult with-out complete separation.
In Vivo Drug Metabolism In vivo metabolism studies involve analysis of drugs and metabolites in blood, urine and faeces. These samples contain a larger amount of endoge-nous compounds that could co-elute and interfere with the LC-MS analysis. A good sample preparation technique cou-pled with efficient chromatographic separation is therefore essential for the successful application of LC-MS to in vivo metabolism studies.
Figure 5 shows the HPLC-ESI-MS mass chromatogram of tamoxifen and its metabolites from the plasma of a breast cancer patient treated with tamoxifen. There are three peaks with the (M1H)1ion at m/z388. These are 4-hydroxytamox-Fig. 3. HPLC-ESI-MS Separation of Droloxifene and Its Metabolites
Droloxifene was incubated with human liver microsomes for 30 min and the result-ing metabolites separated by isocratic HPLC on a Hypersil-ODS column (5mm particle size, 25034.6 mm i.d.) with 70% methanol in 0.5Mammonium acetate as mobile phase
[image:6.595.329.542.59.339.2]ifen (peak 1), 49-hydroxytamoxifen (peak 2) and tamoxifen N-oxide (peak 3). Peaks 4 (m/z372) and 5 (m/z358) are ta-moxifen and N-desmethyltata-moxifen, respectively (Fig. 6). There are also two peaks with the (M1H)1ion at m/z344. Tandem MS/MS analysis showed that peak 6 is an endoge-nous plasma component not related to tamoxifen and peak 7 is N-desdimethyltamoxifen with a characteristic CH2CH2NH2
(m/z44) fragment. Tamoxifen and its derivatives all share a common characteristic fragmentation pathway54,55) of
side-chain cleavage to give ions at m/z72, 58 or 44 corresponding to CH2CH2N(CH3)2, CH2CH2NHCH3 or CH2CH2NH2,
re-spectively. Tandem MS/MS thus allows the positive identifi-cation of a tamoxifen metabolite.
Figure 7 shows an example of the application of negative ion ESI-MS in in vivometabolism studies; the identification of curcumin metabolites in rat plasma after administration of curcumin via the i.v. route.56) Curcumin and its derivatives
are phenolic compounds and difficult to detect by positive ion ESI-MS. Three metabolites have been positively identi-fied. These are hexahydrocurcumin (M2H2, m/z373), hexa-hydrocurcuminol [(M2H)2, m/z 375] and hexahydrocur-cumin glucuronide [(M2H)2, m/z 549]. The (M2H)2 ion for curcumin is at m/z367. Tandem MS/MS was used for the characterization of the metabolites. Hexahydrocurcumin glu-curonide, for example, gave a characteristic (M2H)2ion at m/z 177 corresponding to a fragment from the conjugated glucuronic acid.56)
High-Throughput LC-MS Analysis of Drugs and Metabolites There has been significant interest in “acceler-ated drug discovery” brought about by the development of combinatorial chemistry where hundreds of thousands of compounds can be generated within a short time. This led to the need for high-throughput methods of analysis not only during the reaction development, optimization and produc-Fig. 4. Structures of Droloxifene and Metabolites Detected in Human Microsomal Incubation
[image:7.595.129.447.58.259.2]I, droloxifene; II, N-desmethyldroloxifene; III, droloxifene N-oxide; IV, a-hydroxydroloxifene; V, 4-hydroxydroloxifene.
Fig. 5. HPLC-ESI-MS Separation of Tamoxifen and Metabolites in the Plasma of a Patient on Tamoxifen Therapy
[image:7.595.58.520.304.504.2]tion stages, but also in the biological screening stage where drugs and metabolites are analysed in in vitroand in vivo bi-ological samples.57) High-throughput approaches to sample
preparation coupled with LC-MS greatly improved the speed and sensitivity of analysis necessary for the accelerated drug discovery process.
The two main methods of high-throughput sample prepa-ration are based on the use of automated 96-well extraction procedures. This can be in the solid phase extraction (SPE)58—62)or liquid-liquid extraction63—68)format. The
prin-ciples, operation procedures and applications of these meth-ods have been described.58—68) In these methods, a robotic liquid handling system is used to handle and process samples automatically, thus eliminating the time consuming manual steps in sample preparation.
High-throughput sample preparation is sometimes coupled with fast LC separation on short columns with on-line tan-dem MS/MS for the resolution of co-eluting peaks to further shorten the analysis time. While this technique may work for relatively clean extracts with few components, it is always advisable to achieve complete separation of analytes, as demonstrated in the analysis of droloxifene and tamoxifen metabolites above. Tandem MS/MS may assist with the iden-tification of overlapping peaks of different structures, but not necessarily isomers. Matrix effects such as the suppression and modification of ionization by co-eluting endogenous components69—71)must also be considered.
Fast-flow on-line extraction methods based on the column switching technique have been described.72—76) Biological
[image:8.595.147.466.57.256.2]samples, e.g. plasma, are injected directly into the LC-MS system without prior sample preparation. A narrow-bore HPLC column packed with large particle size material is used to extract small molecule analytes but allows unretained large molecules such as plasma proteins to flow to waste at high mobile phase flow-rate. The adsorbed analytes are then eluted through a column-switching valve into an analytical column for LC-MS/MS analysis. Very fast analysis can be achieved with this method. Again, care should be taken to ensure that there is no matrix effect in this high-throughput LC-MS/MS system. An LC-MS system that does not com-promise on chromatographic separation but is capable of an-alyzing several samples in parallel, as in multiplexed LC-MS-MS systems, would increase the efficiency of the use of Fig. 6. Structures of Tamoxifen and Metabolites Detected in the Plasma of a Patient on Tamoxifen Therapy
I, tamoxifen; II, N-desmethyltamoxifen; III, N-desdimethyltamoxifen; IV, tamoxifen N-oxide; V, 4-hydroxytamoxifen; VI, 49-hydroxytamoxifen.
Fig. 7. HPLC-ESI-MS Separation of Curcumin and Metabolites in Rat Plasma 30 min after Administration of Curcumin (40 mg/kg, i.v.)
[image:8.595.63.296.304.638.2]the mass spectrometer and decrease the possibility of intro-ducing matrix effects.
Analysis and Identification of Impurities and
Degrada-tion Products in Pharmaceuticals Drug Regulation
Au-thorities require the purity of a pharmaceutical to be fully de-fined and the presence of impurities be fully tested and evalu-ated. This is important to ensure that the observed pharmaco-logical and toxicopharmaco-logical effects are truly those of the phar-maceutical and not due to the impurities. Analysis and moni-toring of impurities and degradation products in formulated pharmaceuticals are essential for ensuring that no com-pounds with deleterious effects are generated during their shelf life. The identification of degradation products will aid in the understanding of potential side effects associated with degradation and in the design of a more favourable formula-tion and synthesis of new drugs with greater stability.
Impurities present in pharmaceuticals are mainly formed during the synthetic process from raw chemicals, intermedi-ates, solvents and by-products. Raw chemicals and interme-diates for drug manufacturing do not have the same purity re-quirements as the final pharmaceuticals. They are likely to contain components that affect the purity of the final manu-factured pharmaceutical. Solvents used in the synthesis may also contain impurities that could react to generate pharma-ceutical impurities. By-products are often generated during synthesis and are another source of pharmaceutical impuri-ties.
Monitoring and controlling the penultimate step of phar-maceutical synthesis is crucial for the production of a rela-tively pure drug and the identification of any potential impu-rities present.
Impurities in pharmaceuticals may also arise from the in-gredients used in dosage formulation and/or in the process of formulation where temperature, humidity and light may all play a part.
Drug degradation is often complex and unpredictable. The most common degradation processes are oxidation, hydroly-sis and dehydration; Other processes include adduct forma-tion with excipients, dimerizaforma-tion and rearrangement.
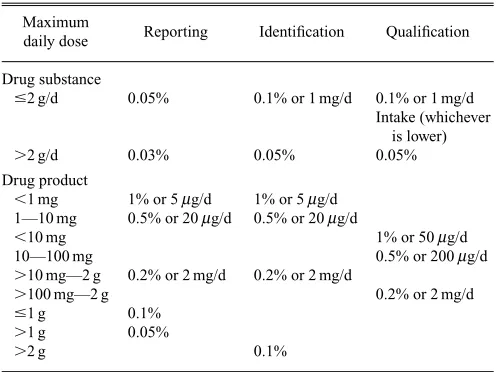
The International Conference on Harmonization (ICH) of Technical Requirements for Registration of Pharmaceuticals for Human Use has published guidelines for the reporting, identification and qualification of impurities in pharmaceuti-cals (ICH Q3A Impurities in new drug substances and ICH Q3B Impurities in new drug products, October 1999). The thresholds for reporting of unknown impurities and identifi-cation and qualifiidentifi-cation of impurities and degradants in new drugs are shown in Table 1.
Since impurities and degradants are usually present in rel-atively small quantities compared to the drug, an analytical technique capable of separating a mixture containing highly varied concentrations of analytes with sensitive and specific detection is required. LC-MS is therefore widely used for this purpose.77—81)
However, it is useful to use an UV-Visible detector in con-junction with mass spectrometry for the estimation and iden-tification of impurities, especially for the unknowns. The UV-visible absorption and response factor of related compounds tend to be similar, while their MS ionization efficiencies can be significantly different.
Figure 8 shows the HPLC separation of impurities and
degradants in 5,10,15,20-tetra(m-hydroxyphenyl)chlorin (mTHPC), a photodynamic therapeutic agent for cancer82)
with, a) detection at 423 nm and b) positive ion ESI-MS de-tection. Three impurity peaks are detected in this batch of drug. Peak 1, with the (M1H)1ion at m/z679, is 5,10,15,20-tetra(m-hydroxyphenyl)porphyrin (m-THPP), the oxidation product of m-THPC (m/z681). Peak 2 has an (M1H)1ion at m/z697, indicating hydroxylation of the m-THPC molecule. This compound was easily dehydrated to give an (M1H)1 ion at m/z679 corresponding to m-THPP when subjected to tandem MS/MS analysis. It is therefore consistent with sub-stitution by an –OH group at the reduced pyrrole ring of m-THPC to give b-hydroxy-m-THPC (Fig. 9), rather than at a double bond of a pyrrole or phenyl ring.83)Peaks 1 and 2 are
therefore degradation products caused by the oxidation of m-THPC.
Peak 3 is an impurity carried over from the synthetic process. It has an (M1H)1 ion at m/z683 corresponding to further reduction of m-THPC to give the isobacteriochlorin structure (Fig. 9). It is 5,10,15,20-tetra(m-hydroxyphenyl)-isobacteriochlorin.
The large m-THPC peak (peak 4), detected at 423 nm was not allowed to enter the ESI-MS ion source by disconnecting the LC-MS interface just before the peak was eluted, to avoid heavy contamination of the ESI ion source by a large amount of m-THPC. A switching valve may also be used to divert eluent from the MS in such cases.
Analysis of Chiral Impurities in Pharmaceuticals The separation and detection of chiral impurities in pharmaceuti-cals are of great importance because the D-isomer of a drug can have very different pharmacological, metabolic and toxi-cological activity from the L-isomer.
LC-MS has been used for the analysis of chiral amino acids in the identification of chiral impurities present in di-astereomeric peptide drugs.81)The peptide is hydrolyzed and
[image:9.595.294.542.79.265.2]the amino acids released are derivatized with N2 -(5-fluoro-2,3-dinitrophenyl)-L-alanine amide (Marfey’s reagent), which converts the amino acid enatiomers into the corresponding diastereoisomers for separation and detection by HPLC-MS.81,84)The specificity of the MS detection eliminated inter-ference from other peaks encountered when an UV detector Table 1. Thresholds for Reporting, Identification and Qualification of Im-purities and Degradants in Pharmaceuticals
Maximum
Reporting Identification Qualification daily dose
Drug substance
#2 g/d 0.05% 0.1% or 1 mg/d 0.1% or 1 mg/d Intake (whichever
is lower)
.2 g/d 0.03% 0.05% 0.05%
Drug product
,1 mg 1% or 5mg/d 1% or 5mg/d 1—10 mg 0.5% or 20mg/d 0.5% or 20mg/d
,10 mg 1% or 50mg/d
10—100 mg 0.5% or 200mg/d
.10 mg—2 g 0.2% or 2 mg/d 0.2% or 2 mg/d
.100 mg—2 g 0.2% or 2 mg/d
#1 g 0.1%
.1 g 0.05%
Fig. 8. Separation of Impurity and Degradation Products in a Batch of 5,10,15,20-Tetra(m-hydroxyphenyl)chlorin (mTHPC)
[image:10.595.156.454.419.708.2]The separation was carried out on a Hypersil-BDS column (3mm particle size, 10034.6 mm i.d.) by gradient elution from 50% A (0.1% TFA in water): 50% B (0.1% TFA in acetonitrile) to 100% B in 15 min. Detection: a), 423 nm and b), positive ion ESI-MS. Peaks 1, 5,10,15,20-tetra(m-hydroxyphenyl)porphyrin (mTHPP); 2, b-hydroxy-mTHPC; 3, 5,10,15,20-tetra(m-hydroxyphenyl)isobacteriochlorin; 4, mTHPC.
was used for detection.
Diastereoisomeric derivatization followed by LC-MS sepa-ration and detection is also useful for the analysis of chiral acidic drugs e.g. 2-arylpropionic acids. Although chiral sta-tionary phases can be used for the enantiomeric separation of these drugs, the sensitivity of detection by negative ion ESI-MS was poor.85)They have been derivatized with benzofuran
fluorescent reagents for enatiomeric separation by HPLC with fluorometric detection.85) These benzofuran derivatives are also ideal for sensitive and specific detection by positive ion ESI-MS without interference.
Diastereomeric derivatization with a suitable reagent that confers favourable MS properties to the molecules is a tech-nique worth exploring for chiral drug analysis.
FUTURE TRENDS AND PERSPECTIVES
LC-MS has proved to be an extremely sensitive and spe-cific technique for the analysis of pharmaceuticals. It plays important roles in the studies of drug metabolism,86) discov-ery of new drug candidates and the analysis, identification and characterization of impurities and degradants in drug substances and products.
Technical advances in MS continue, with improvements in sensitivity and resolution. The trend is towards the further development of hybrid instruments such as Q-TOF. FT-ICR will become more prominent as developments are made and instruments become less complex and more available. The likely importance of proteomics in pharmaceutical develop-ment will have implications for MS, leading to the further re-quirements for high resolution sequencing.
Coupling high-throughput sample preparation techniques with multiplexed LC-MS-MS will lead to even faster analy-sis and the potential of interfacing LC-NMR with MS to give an LC-NMR-MS system will allow the unequivocal identifi-cation of drugs and metabolites.87,88)
The technical difficulties in linking micro and capillary separation techniques with nanospray MS are being solved and advances in this front can be expected. The use of mi-crofluidic systems offers prospects for miniaturized chip sep-arations and even the possibility of miniaturized mass spec-trometers in the rather more distant future. The capabilities and expertise of Japan in miniaturized electronics on chips may be directed in this area.
REFERENCES
1) Barber M., Bordoli R. S., Sedgwick R. D., Tyler A. N., J. Chem. Soc. Chem. Commun., 1981, 325—327 (1981).
2) Scott R. P. W., Scott C. G., Karpov G. V., Munroe M., Hess J., J. Chro-matogr., 99, 395—405 (1974).
3) McFadden W. H., Schwartz H. L., Evans S., J. Chromatogr., 122, 389—396 (1976).
4) Baldwin M. A., McLafferty F. W., Org. Mass Spectrom., 7, 1353— 1356 (1973).
5) Arpino P. J., Baldwin M. A., McLafferty F. W., Biomed. Mass Spec-trom., 1, 80—82 (1974).
6) Caprioli R. M., Fan T., Cottrell J. S., Anal. Chem., 58, 2949—2954 (1986).
7) Vestal M. L., Mass Spectrom. Rev., 10, 53—58 (1983).
8) Winkler P. C., Perkins D. D., Williams D. K., Browner R. F., Anal. Chem., 60, 489—495 (1988).
9) Dole M., Mach L. L., Hines R. L., Mobley R. C., Ferguson L. D., Alice M. B., J. Chem. Phys., 49, 2240—2249 (1968).
10) Whitehouse C. M., Dreyer R. N., Yamashita M., Fenn J. B., Anal. Chem., 57, 675—679 (1985).
11) Bruins A. P., Covey T. R., Henion J. D., Anal. Chem., 59, 2642—2644 (1987).
12) Banks J. F., Quinn J. P., Whitehouse C. M., Anal. Chem., 66, 3688— 3695 (1994).
13) Cole R. B. (ed.), “Electrospray Ionisation Mass Spectrometry-Funda-mentals, Instrumentation and Applications,” Wiley, New York, 1997. 14) Gaskell S. J., J. Mass Spectrom., 32, 677—688 (1997).
15) Guiochon G., Colin H., “Proceedings of the 2nd International Con-gress on Techniques in Environmental Chemistry,” ed. by Albaiges J., Barcelona, Spain, Nov. 1981, Pergamon Press, Oxford, 1982, pp. 169—175.
16) Covey T., “Biological and Biotechnological Applications of Electro-spray Ionisation Mass Spectrometry,” ed. by Snyder A. P., ACS Sym-posium Series 619, American Chemical Society, Washington, DC, 1996, pp. 21—59.
17) Chowdury S. K., Chait B. T., Anal. Chem., 63, 1660—1664 (1991). 18) Gale D. C., Smith R. D., Rapid Commun. Mass Spectrom., 7, 1017—
1021 (1993).
19) Emmett M. R., Caprioli R. M., J. Am. Soc. Mass Spectrom., 5, 605— 613 (1994).
20) Wilm M. S., Mann M., Int. J. Mass Spectrom. Ion processes, 136, 167—180 (1994).
21) Wilm M. S., Mann M., Anal. Chem., 68, 1—8 (1996).
22) Xue Q., Dunayevskiy Y. M., Foret F., Karger B. L., Rapid Commun. Mass Spectrom., 11, 1253—1256 (1997).
23) Ramsey R. S., Ramsey J. M., Anal. Chem., 69, 1174—1178 (1997). 24) Figeys D., Ning Y., Abersold R., Anal. Chem., 69, 3153—3160 (1997). 25) Licklider L., Wang X.-Q., Deasi A., Tai Y.-C., Lee T. D., Anal. Chem.,
72, 367—375 (2000).
26) de Mello A. J., Lab. on a Chip, 1, 7N—12N (2001).
27) Apffel A., Fischer S., Goldberg G., Goodley P., Kuhlmann F., “Pro-ceedings of the 42nd ASMS Conference on Mass Spectrometry and Allied Topics,” Chicago, IL., 1994, pp. 772—773.
28) Kuhlmann F. E., Apfel A., Fischer S. M., Goldberg G., Goodley P. C.,
J. Am. Soc. Mass Spectrom., 6, 1221—1225 (1995).
29) New A. P., Wolff J. C., Crabtree S., Freitas dos Santos L., Okafo G., Lee J., Divan K., J. Chromatogr. A, 913, 205—208 (2001).
30) Syage J. A., Evans M. D., Hanold K. A., Amer. Lab., 32, 42—45 (2000).
31) Robb D. B., Covey T. R., Bruins A. P., Anal. Chem., 72, 3653—3659 (2000).
32) Cappiello A., Famiglini G., Mangani F., Palma P., Mass Spectrom. Rev., 20, 88—104 (2001).
33) Stevenson T. L., Loo J. A., Greis K. D., Anal. Biochem., 262, 99—109 (1998).
34) Gusev A. I., Fresenius J. Anal. Chem., 366, 691—700 (2000). 35) Smith R. D., Barinaga C. J., Usdeth H. R., Anal. Chem., 60, 1948—
1952 (1988).
36) Von Bocke A., Nicholson G., Bayer E., Electrophoresis, 22, 1251— 1266 (2001).
37) Verheij E. R., Tjaden U. R., Niessen W. M. A., van der Greef J., J. Chromatogr., 554, 339—349 (1991).
38) Gordon D. B., Lord G. A., Jones D. S., Rapid Commun. Mass Spec-trom., 8, 544—548 (1994).
39) Bartle K. D., Myers P., J. Chromatogr. A, 916, 3—23 (2001). 40) Bartle K. D., Myers P. (eds.), “Capillary Electrochromatography,” RSC
Chromatography Monographs, Royal Society of Chemistry, Cam-bridge, 2001.
41) Guilhaus M., Selby D., Mlynski V., Mass Spectrom. Rev., 19, 65—107 (2000).
42) Yang L., Wu N., Clement R. P., Rudewicz P. J., “Presentation at the 15th International Mass Spectrometry Meeting,” Barcelona, 27th Aug.-1st. Sept. 2000.
43) Costello C. E., Curr. Opinion in Biotechnol., 10, 22—28 (1999). 44) Shen Y., Zhao R., Belov M. E., Conrads T. P., Anderson G. A., Tang
K., Pasa-Tolic L., Veenstra T. D., Lipton M. S., Usdeth H. R., Smith R. D., Anal. Chem., 73, 1766—1775 (2001).
45) Shen Y., Tolic N., Zhao R., Pasa-Tolic L., Li L., Berger S. J., Harkewicz R., Andeson G. A., Belov M. E., Smith R. D., Anal. Chem.,
73, 3011—3021 (2001).
46) De Biasi V., Haskins N., Organ A., Bateman R., Giles K., Jarvis S.,
47) Eckers C., Wolff J. C., Haskins N., Sage A. B., Giles K., Bateman R.,
Anal. Chem., 72, 3683—3688 (2000).
48) Van Pelt C. K., Corso T. N., Schultz G. A., Lowes S., Hennion J., Anal. Chem., 73, 582—588 (2001).
49) Liu H., Felten Q. X., Zhang B., Jedrzejewski P., Karger B. L., Foret F.,
Anal. Chem., 72, 3303—3310 (2000).
50) Cai H., Wang Q., Luo J. L., Lim C. K., Biomed. Chromatogr., 13, 354—359 (1999).
51) Fernandez-Metzler C. L., Owens K. G., Baillie T. A., King R. G.,
Drug Metab. Dispos., 27, 32—40 (1999).
52) Kato K., Jingu S., Ogawa N., Higuchi S., Biomed. Chromatogr., 16, 25—30 (2002).
53) Bruning P. F., Eur. J. Cancer, 28A, 1404—1407 (1992).
54) Poon G. K., Walter, B., Lonning P. E., Horton M. N., McCaque R.,
Drug. Metab. Dispos., 23, 377—382 (1995).
55) Lim C. K., Yuan Z-X., Jones R. M., White I. N. H., Smith L. L., J. Pharm. Biomed. Anal., 15, 1335—1342 (1997).
56) Ireson C., Orr S., Jones D. J. L., Verschoyle R., Lim C. K., Luo J. L., Howell L., Plummer S., Jukes R., Williams R., Steward M., Gescher A., Cancer Res., 61, 1058—1064 (2001).
57) Kyranos J. N., Cai H., Wei D., Goetzinger W. K., Curr. Opin. Biotech-nol., 12, 105—111 (2001).
58) Allanson S. P., Biddlecombe R. A., Jones A. E., Pleasance S., Rapid Commun. Mass Spectrom., 10, 811—818 (1996).
59) Simpson H., Berthemy A., Buhrman D., Burton R., Newton J., Kealy M., Well D., Wu D., Rapid Commun. Mass Spectrom., 12, 75—82 (1998).
60) Zhang H., Henion J., Anal. Chem., 71, 3955—39 (1999).
61) Jemal M., Huang M., Mao Y., Whigan D., Schuster A., Rapid Com-mun. Mass Spectrom., 14, 1023—1028 (2000).
62) Jemal M., Biomed. Chromatogr., 14, 422—429 (2000).
63) Jemal M., Teitz D., Quyang Z., Khan S., J. Chromtogr. B, 732, 501— 508 (1999).
64) Zweigenbaum J., Heinig K., Steinborner S., Wachs T., Henion J., Anal. Chem., 71, 2294—2300 (1999).
65) Heinig K., Henion J., J. Chromatogr. B, 732, 445—458 (1999). 66) Wu J.-T., Zeng H., Qian M., Brogdon B. L., Unger S. E., Anal. Chem.,
72, 61—67 (2000).
67) Onarato J. M., Henion J. D., Lefebure P. M., Kiplinger J. P., Anal.
Chem., 73, 119—125 (2001).
68) Peng S. X., Hansen C., Strojnowski M. J., Golebiowski A., Klopfen-stein S. R., Anal. Chem., 72, 261—266 (2000).
69) Clarke S. D., Hill H. M., Noctor T. A. G., Thomas D., Pharm. Sci., 2, 203—207 (1996).
70) Bonfiglio R., King R. C., Olah T. V., Merkle K., Rapid Commun. Mass Spectrom., 13, 1175—1185 (1999).
71) Matuszewski B. K., Constanzer M. L., Charez-Eng C. M., Anal. Chem., 70, 882—889 (1998).
72) Ayrton J., Dear G. J., Leaven W. J., Mallett D. N., Plumb R. S., J. Chro-matogr. A, 828, 199—207 (1998).
73) Jemal M., Xia Y. Q., Whigan D. B., Rapid Commun. Mass Spectrom.,
12, 1389—1399 (1998).
74) Jemal M., Ouyang Z., Xia Y. Q., Powell M. L., Rapid Commun. Mass Spectrom., 13, 1462—1471 (1999).
75) Wu J. T., Zeng H., Qian M., Brogdon B. L., Unger S. E., Anal. Chem.,
72, 61—67 (2000).
76) Xia Y. Q., Whigan D. B., Powell M. L., Jemal M., Rapid Commun. Mass Spectrom., 14, 105—111 (2000).
77) Volk K, J., Klohr S. E., Rourick R. A., Kerns E. H., Lee M. S., J. Pharm. Biomed. Anal., 14, 1663—1674 (1996).
78) Wu Y., Biomed. Chromatogr., 14, 384—396 (2000).
79) Eckers C., Haskins N., Langridge J., Rapid Commun. Mass Spectrom.,
11, 1916—1922 (1997).
80) Ermer J., J. Pharm. Biomed. Anal., 18, 707—714 (1998). 81) Ermer J., Vogel M., Biomed. Chromatogr., 14, 373—383 (2000). 82) Stewart J. C. M., “New Approaches to Cancer Treatment,” ed. by
Hor-robin D. F., Churchill Communications Europe, London, 1994, pp. 109—120.
83) Jones R. M., Wang Q., Lamb J. H., Djelal B. D., Bonnett R., Lim. C. K., J. Chromatogr. A, 722, 257—265 (1996).
84) Fujii K., Ikai Y., Oka H., Suzuki M., Harada K., Anal. Chem., 69, 3346—3352 (1997).
85) Santa T., Luo J., Lim C. K., Imai K., Biomed. Chromatogr., 12, 73—77 (1998).
86) Oliveira E. J., Watson D. G., Biomed. Chromatogr., 14, 351—372 (2000).