BIROn - Birkbeck Institutional Research Online
Smith, Ron P. and Zoega, Gylfi (2009) Keynes, investment, unemployment
and expectations. International Review of Applied Economics 23 (4), pp.
427-444. ISSN 0269-2171.
Downloaded from:
Usage Guidelines:
Please refer to usage guidelines at or alternatively
BIROn
-
B
irkbeck
I
nstitutional
R
esearch
On
line
Enabling open access to Birkbeck’s published research output
Keynes, investment, unemployment and expectations
Journal Article
http://eprints.bbk.ac.uk/1999
Version: Pre-print
Citation:
© 2009 Taylor & Francis
Publisher version available at:
http://dx.doi.org/10.1080/02692170902954767
______________________________________________________________ All articles available through Birkbeck ePrints are protected by intellectual property law, including copyright law. Any use made of the contents should comply with the relevant law.
______________________________________________________________
Deposit Guide
Contact: lib-eprints@bbk.ac.uk
Birkbeck ePrints
Birkbeck ePrints
Keynes, Investment, Unemployment and
Expectations
1Ron Smitha and Gylfi Zoegaa,b
a Birkbeck College, Malet Street, London WC1E 7HX. b University of Iceland, 101 Reykjavik, Iceland.
September 2007
Abstract
In Keynes’ General Theory, investment determines effective demand, which
determines unemployment and the labour market plays a negligible role. In New
Keynesian models, labour market institutions determine the natural rate of
unemployment and the speed at which unemployment adjusts to it. Investment is
mostly ignored as a key variable behind the problem of high unemployment, despite a
strong empirical association between investment and unemployment. We discuss the
evolution of the ‘Keynesian’ model, and how in the process of domesticating the
General Theory, the central relationship between unemployment and investment and
the role of the state of confidence was bred out of the model. We then present some
evidence of the centrality of investment and expectations to the long-term evolution of
unemployment in OECD countries. We also argue that recent results in finance, which
find that individuals do not behave rationally and, moreover, that there may be no
basis for rational calculation, provides support for Keynes’s notion that animal spirits
play a central role in investment.
JEL classification: J1, E2
Keywords: Unemployment, investment, Keynesian theory.
1
Introduction
Keynes and Hayek disagreed profoundly on the causes and nature of business cycles,
yet both would have taken for granted that the evolution of unemployment was
determined by the dynamics of investment, driven by the state of confidence in
expected returns on production. We will argue that these insights were forgotten by
mainstream theory, but are now being rediscovered. In elementary economics,
students are taught that the Keynesian model has investment driving effective
demand, driving unemployment. In contrast, in graduate economics they are taught
that unemployment is a labour market phenomenon, which adjusts – once prices and
wages have fully responded – to equilibrium levels determined by institutions and the
structure of markets. This has led Blanchard (2000) to label the medium-run
relationship between investment and unemployment, which is very obvious in the
data, as the ‘Modigliani Puzzle’,see also Modigliani (2000).
We will argue that to many economists, brought up in a general equilibrium tradition,
the most unsettling feature of the General Theory, GT, Keynes (1936, CW, 72) was
that the central variable, investment, was left undetermined by any formal theory. In
the process of domesticating the GT, that central argument, the close relationship
between investment and unemployment got bred out of Keynesian models. This
process of evolution produced the three-equation New-Keynesian model, which is the
modern macroeconomic consensus. This has an expectations augmented Phillips
Curve determining inflation as a function of the output gap, with a vertical long-run
natural rate or NAIRU; an ‘IS curve’ determining output as a function of expected
output and real interest rates; and a Taylor rule that describes Central Bank interest
rate setting behaviour. There is little in this model that resembles the General Theory,
or even the reformulation by Hicks, since the IS curve arises from the consumption
Euler equation, investment and fiscal policy play no role and the money demand
equation is discarded.
We begin by briefly discussing the old views and the role of the General Theory
within them. We spend some time on the history because Keynes is often
misrepresented. We then consider the process of domestication of the General Theory,
2
provide new evidence on the strong relationship between investment and
unemployment and finally discuss the determination of the state of confidence in
expected returns in the light of modern theory. There are a variety of interpretations of
the real meaning of the General Theory; Kerr (2005) provides a nice review, we
merely argue that in the process of evolving into mainstream theory, two central
relationship of the General Theory – that between unemployment and investment and
that between both and the state of confidence – were forgotten. Of course, outside the
mainstream it was not forgotten and Arestis and Sawyer (2005) provide a survey of an
alternative framework where it plays an important role.
1.
The General Theory
In Austrian business cycle theory the relationship between investment and
unemployment is clear and undisputable. An economic expansion consists of the
build-up of capital. An increase in the desire to save causes the rate of interest to fall
and investment to rise. Moreover, such capital accumulation entails more roundabout
production processes when capital gets located to earlier production stages. A
monetary expansion has the undesirable effect of lowering the rate of interest below
its natural level, which makes genuine saving fall and forced saving and investment
increase, hence causing an unsustainable boom that is invariably followed by a bust.
The artificial low rate of interest eventually gives way to a high real rate of interest as
overcommitted investors bid for increasingly scarce resources. During the boom
period workers are increasingly employed in the earlier stages of production while in
the bust phase they are released from failing enterprises and unemployment goes up.
It is clear that the theory implies a positive relationship between investment and
employment. Developments in the capital market determine the evolution of
employment and unemployment. While the difficulty in Hayek (1931) in explaining
the mechanics of the bust – in particular how the stock of capital falls – led to the
success of Keynesian economics, the theory nevertheless offers interesting insights,
which even Keynes admitted3.
3
One feature of the General Theory that we wish to emphasise is that the key
ingredients of Keynes’s model – such as liquidity preference theory and the multiplier
– applied to the market for goods and services, the bond market and the market for
capital. The labour market was neglected. In the GT Keynes provides an account of
the workings of the goods and the asset markets. In goods markets, output was
determined by demand and output then determined employment, the assumption
being that there were reserves of labour available and that the real wage did not
equilibrate the market. The labour market was hence only a sideshow in the general
scheme and passively reacted to developments in goods and capital markets. In this
model, the flow of labour services is whatever is needed to produce output demanded
and it makes no difference how this labour input is divided between workers; whether
all work half time or half work full time, for example. So in a strange paradox, what
became the most accepted explanation for high unemployment during the 1930s had
little to do with the market for labour. While the classical authors had tried to explain
the causes of slow adjustment of real wages towards the full-employment equilibrium,
Keynes simply threw out that market and put the problem in the goods market; it was
deficient demand for goods – and the failure of interest rates to fall – which was the
problem.
In contrast to New Keynesian models, Keynes did not assume nominal wages to be
fixed, nor were real wages. This is very clear in the appendix to Chapter 19,
discussing Pigou’s theory of unemployment. In Keynes, if a firm were to offer lower
nominal wages in response to unemployment, it would experience positive profits,
which are incompatible with the assumed perfect competition in the goods market.
Firm entry would then ensure that prices fell until real wages were restored at their
original level. However, falling nominal wages and prices (holding real wages
constant) would make the real money supply increase, which could: raise investment
through lower interest rates – the Keynes effect – and raise consumption through
increased wealth – the Pigou effect – which in turn raised effective demand –
assuming investment is interest elastic – and hence also output and employment.
There is one place in the General Theory where Keynes uses tools from labour
economics. This is when he uses a labour demand curve to account for the perceived
that the labour demand curve plays in his analysis. Hence, real wages are determined
by labour demand, they are flexible, but do not adjust to clear the labour market.
Ironically, post General Theory empirical work indicated that the relationship
between employment and the real wage was positive, so he need not have bothered.
It is investment that plays the central role in the Keynesian business cycle. Keynes
had argued in 1931 that a fall of investment was the cause of the depression because
interest rates did not bring savings into equality with investment. Large and abrupt
changes in the perceived or expected marginal efficiency of investment made firms
change their investment plans quickly and unexpectedly. Such demand shocks
induced firms to expand or contract production in response to observed changes in
inventories and consumption and output adjusted further as the multiplier kicked in.
Changes in the transaction demand for money then affected interest rates through the
bond market and crowding out of investment occurred.
Keynes saw employment as driven by effective demand, of which investment was the
most volatile component. In Chapter 11 of the General Theory he showed that
investment depends on the relation between the rate of interest and the marginal
efficiency of capital, which depended on the relation between the supply price of
capital and its prospective yield. Chapter 12, considers the factors which determine
the prospective yield of an asset, the state of long-term expectation, or confidence. It
is here that he notes that human decisions affecting the future ‘cannot depend on strict
mathematical expectation, since the basis for making such calculations does not
exist’, rather ‘it is our innate urge to activity (animal spirits) which makes the wheels
go round’. CW, 7, 161-3.
That the influence of the state of long-term expectations on investment was the central
message of the GT, was emphasized in the 1937 Quarterly Journal of Economics
article. There he also says: ‘The theory can be summed up by saying given the
psychology of the public, the level and output and employment as a whole depends on
the amount of investment. I put it this way, not because this is the only factor on
which aggregate output depends, but because it is usual in a complex system to regard
as the causa causans that factor which is most prone to sudden and wide fluctuations.’
(1985)) he emphasized the likely structural instability of the investment functions that
Tinbergen estimated.
2.
The response
Leaving the central variable of the theory, investment, undetermined except by
‘animal spirits’ seemed quite unsatisfactory to many economists. The process of
domesticating the GT began quickly. As soon as the GT became available, there was a
race to cast it into equations and relate it to the orthodoxy. The race was won by Hicks
(1937), who proposed a general equilibrium model with endogenous investment and
IS-LM diagrams.
.
The important role of the labour market came to the fore when Modigliani (1944)
incorporated it into the IS-LM framework and showed that rigid nominal wages were
required for an underemployment-equilibrium in the IS-LM version of the Keynesian
model. It was widely pointed out, at the time and subsequently, that this interpretation
was clearly contrary to what Keynes had argued. But such complaints had little
influence and the dominant interpretation became that the Keynesian system was a
special case of the neoclassical model; with flexible nominal wages we would have
full employment and monetary neutrality. This soon lead to the conclusion that wage
flexibility arises in the long run, and the economy tends to full employment if nominal
wages are allowed time to adjust.4
What then became known as New Keynesian models were subsequently developed to
provide microeconomic foundations for nominal-wage stickiness in the presence of
rational expectations. But these have little in common with the GT5 since the focus is
almost exclusively on money-wage and price-stickiness in models with rational
expectations, while Keynes had argued that wages and prices were flexible but
expectations were erratic. The modern sense of rational expectations involves the
mathematical expectations or expected value, but Keynes explicitly argued that such
mathematical expectations did not exist and there was no basis for rational
calculation, see for instance Dow and Dow (1985), a point we return to.
4
This neoclassical-Keynesian synthesis was attacked by Clower (1965) and Leijonhufvud (1968).
5
More recent developments include attempts at explaining the presence of involuntary
unemployment in the long run, how the classical long run equilibrium can be
amended by the incorporation of market imperfections that explain real wage rigidity,
persistent unemployment and long swings in the rate of unemployment. Phelps (1968)
and Friedman (1968) argued that there was no trade-off between inflation and
unemployment in the long run and proposed the existence of a natural rate of
unemployment. There followed the literature on information frictions and the
matching function (e.g. Pissarides, 2000) – explaining the existence of search
unemployment – as well as the theory of efficiency wages (see Salop, 1979; Shapiro
and Stiglitz, 1984; and Phelps, 1994; amongst others) – explaining the presence of
involuntary unemployment in equilibrium.6
What is interesting is that the clock has turned full circle: Keynes threw the labour
market out of the classical system, made output equilibrate the product market and
employment be derived from output. Modigliani showed how the economy could
revert to the classical equilibrium in the long run once all prices have adjusted.
Finally, the classical view of the labour market has returned as a model of the long
run and has been amended by the introduction of various market failures that prevent
full employment from ever being attained.
It is clear that the investment-unemployment relationship does not hold a prominent
place in most of the explanations and models put forward for persistently high
unemployment. Bruno and Sachs (1985) explained the stagflation of the 1970s by a
fall in the “warranted real wage”– the one implied by the level of technology and the
price of other inputs – and the failure of actual real wages to fall accordingly. Jacques
Dreze and co-authors, e.g. Bean and Dreze (1990), postulated that the failure of real
wages to fall would – by reducing profits – lower the level of the capital stock and
hence cause a persistent increase in unemployment. Lindbeck and Snower (1989)
showed how a transient recession could leave a permanent dent in the unemployment
rate by reducing the number of entrenched workers who could manipulate their wages
6
so as to prevent the unemployed from getting back their jobs. Layard et al. (1991)
showed how a transient recession could adversely affect the human capital of the
long-term unemployed, their search intensity and the way they are received when they
apply for jobs. . In a series of papers, the most recent Nickell et al. (2005), Nickell
argues that labour-market institutions can explain both differences in unemployment
across countries as well as differences over time for each country.7
There is one strand of recent research where investment does play a prominent role in
explaining changes in equilibrium unemployment over time. Phelps (1994) lays out a
set of general equilibrium models of the natural rate thatemphasise the role of
investment in physical capital, trained workers and market share as determinants of
the natural rate of unemployment. Based on this work Fitoussi et al. (2000) estimate
equations where the response to global shocks (productivity growth rates, real interest
rates and real oil prices) depended on a set of domestic institutions. In this work
structural booms entail high investment and low unemployment and structural slumps
low investment and high unemployment.
While there are exceptions, the mainstream continues to confine its search for the
explanation of unemployment in the labour market, rather than the factors driving
investment, like expected returns.8 One of the reasons for this is that the focus is on
the capital stock rather than investment. But the capital stock is trended, whereas
unemployment is untrended, so that cannot be an explanation.9 Another explanation
is the absence of an empirically satisfactory neoclassical theory of investment. The
main candidate, Tobin’s Q has little predictive power for investment. In practice,
investment as explained by accelerator models with distributed lags on past output
and financial measures that reflect credit constraints and differences in the cost of
capital on internal and external funds.. More recently there has been increasing
emphasis on the need to model labour and capital adjustment jointly and the need to
7
However, it should be noted, the model does not do well at explaining the evolution over time, e.g. Baker et al. (2004).
8
Oi (1962) treated labour as a fixed factor of production and some of the current models of the natural rate of unemployment do emphasise the importance of employment adjustment costs. In Phelps (1994), the hiring decision is made to depend on interest rates and expected rates of productivity growth, hence hiring would be expected to respond to expected rates of return. Similarly, Pissarides (2000) models the decision by a firm to post a new vacancy as an inter-temporal investment decision.
9
allow for the impact of uncertainty on investment, e.g. Bloom (2007). Expectations
matter and they seem to be unpredictable. Early criticisms of Keynes’ emphasis on
expectations were that he had not provided a theory of expectations and if
expectations were not determinate in the investment equation, they were not
determinate in the other equations of the General Theory. But investment in physical
capital is different in that it is largely irreversible and locks the firm into long-term
and unknowable consequences, a point we return to.
3.
Investment and unemployment
The macroeconomic data show a strong medium- to long-term relationship between
investment and unemployment. This may come as a surprise to someone who has
followed the recent unemployment literature reviewed above. Of course, no one
would express surprise at seeing such a relationship over a business cycle but that is
not what we are discussing here.
The post-war years have seen large decadal changes in average unemployment. The
1950s and 1960s were a period of low unemployment in the OECD while the 1970s
and 1980s had high unemployment. Average unemployment varied greatly across
countries in the 1990s. Such medium-term cycles dominate the short-term (business)
cycle in most countries. The figures below plot investment against the employment
rate (defined as 100 minus the rate of unemployment) for a set of countries that
experienced a rise in average unemployment (Belgium, France, Germany and Italy)
and another set of countries where employment has by now fully recovered after the
turbulence of recent decades (the United Kingdom and the United States). Figure 1
shows the four problem countries. An obvious positive relationship appears: when
employment falls from one plateau to another, investment falls also and when
employment recovers, so does investment.
FIGURES 1 AND 2 ABOUT HERE
The move to a lower level of employment in the seventies and eighties coincided with
a fall in investment (as a share of GDP). While the year-to-year correlation between
relation is strong when measured over longer periods. The stylised relationships
shown in Figure 1 are not emphasised by the current strand of thinking about
unemployment nor do they guide researchers in the search for an explanation. In fact,
the discussion largely ignores the investment-unemployment relationship. When
investment is mentioned it appears as a derived variable that passively responds to
developments in the labour market. The following quote from Blanchard (2006, p31)
is revealing: “The early 1970s were characterized by “adverse labor supply shifts” –
that is, increases in bargained wages given unemployment. The effects of profit rates
and interest rates on capital accumulation were also clearly visible, with low interest
rates delaying the slowdown in capital accumulation to the 1980s.” Note that Figure 1
does not support this interpretation in that the employment and investment series
appear to move in tandem. In contrast, as shown in Figure 2, investment shows no
trend in the United States where employment has remained stubbornly high and the
same applies to the United Kingdom where employment has by now regained its
earlier – that is the pre-seventies – level.
To examine this more formally, we use OECD data for twenty-one countries10 and
forty-three years (1960-2002) on the unemployment rate in country i in yeart,
, which we can stack in the
it
u
1, 2,..., ; 1, 2,...,
i= N t = T T×N, (43 21)× matrix U.
Standard tests do not reject a unit root in all 21 series. We assume that has a factor
structure
it
u
it i t it
u =λ f +e (1) Similarly we have data on the investment rate, gross domestic fixed capital formation
as a share of GDP, git, stacked as G. We standardise the data and calculate the
underlying global factors as the principal components (PCs) of the correlation
matrices of U and . These are the orthogonal linear combinations of the data that
explain the maximal variances of the data G
11
. If the idiosyncratic errors, above are
I(0) the PC estimators for
it
e
t
f are consistently estimated (large N) independently of
whether all the factors are I(0) or whether some or all of the factors are I(1), Bai and
10
Australia, Austria, Belgium, Canada, Denmark, Finland, France, Germany, Greece, Iceland, Ireland, Italy, Japan, the Netherlands, New Zealand, Norway, Portugal, Spain, Sweden, UK and US.
11
Ng (2004). We will assume that the errors are I(0) and that the long-memory in
investment and unemployment comes from the persistent global factors and, in fact,
national unemployment rates and the global factor do cointegrate in most countries.
The eigenvalues and proportion of variance explained by the first four PCs are given
in Table 1. The first PC explains almost 70% of the variation in unemployment and
almost 60% of the variation in investment; factors common to all countries clearly
explain the bulk of the variation in both variables12. The first PC of unemployment is
close to the mean with most countries having roughly equal weights, between 0.18
and 0.26, the main exception being the US, which has a low weight of 0.08, but a high
weight in the second PC of unemployment.
Table 1. Principal components for unemployment and investment
Unemployment Investment
Shocks Eigen-
values
% of var. explained
Cum. % explained
Eigen- values
% of var. explained
Cum. % explained
First PC 14.16 69% 69% 11.85 58% 58%
Second PC 3.15 15% 84% 2.44 12% 70%
Third PC 0.98 5% 89% 1.59 8% 78%
Fourth PC 0.74 4% 93% 1.00 5% 83%
Notice that we have calculated the factors for unemployment and investment
independently and not imposed a shared factor structure. However, by plotting the
unemployment and investment PCs together we can judge whether they share a
common factor or whether there are only variable specific factors. The first two sets
of PCs for unemployment and investment, respectively, are shown in Figure 3. Note
that we draw the negative of the PC for unemployment in order to create a more
visible fit with the investment PCs.
12
The first PCs for investment and unemployment are almost identical, . This
relationship is not spurious, they cointegrate
2
0.92
R =
13
and the (1,-1) restriction on the
cointegrating vector is accepted at the 5% level, t=1.53. The disequilibrium term feeds
back significantly on investment but not on unemployment. Since employment can be
adjusted faster than capital stock this is not surprising. The contemporaneous residual
correlation is very high, 0.81, so they both seem to be responding to the same shocks,
which we interpret as innovations to expected returns. As can be seen from the graph
the fit is less good in the 1960s, which is consistent with growing globalisation over
this period, particularly after the end of the fixed exchange rate Bretton Woods
system. There are some similarities between the second PCs, but the fit is not high,
. 2
0.25
R =
FIGURE 3 ABOUT HERE
Below we conduct the analysis assuming that there is a single factor, though we test
for the significance of the second factor. The first PC reflects some of the more
important macroeconomic events of the past forty years: the oil shocks, the recessions
of the mid-seventies, early eighties and early nineties and the gradual but only partial
recovery in the second half of the eighties. This component describes the shocks
causing the persistent slump that occurred in many countries in the seventies, eighties
and nineties.14
As noted above, the expected return to production may depend on a large number of
factors, many of which are difficult to measure. But in a globalised world the broad
movements of the expected rate of return are likely to be quite similar across the
advanced industrial countries, and reflected in their investment and employment
decisions. Whereas investment and unemployment in any one country will be noisy
measures of this, the common component across countries may be a better measure.
While we do not observe expected returns, we do observe a variable related to it.
13
The AIC chooses no intercept, no trend in the relationship and with this the trace test for the rejection of no cointegrating vectors has a p value of 0.0173, while the less reliable max eigenvalue test has a p value of 0.0519.
14
Figure 4 plots a discount factor calculated from the world real rate of interest: d =
1/(1+r), where r is the average (long) real rate of interest for the G7 countries.15
FIGURE 4 ABOUT HERE
A clear relationship is present between the two PCs, on the one hand, and the discount
factor, on the other hand. This suggests that the long swings of employment may trace
their roots to factors affecting expected returns and the same factors drive investment.
We discuss the theoretical interpretation of this pattern below.
To assess the explanatory power of our global factor, we estimated a model in which
the parameters are constant over time but differ for each country:
1 , 1 1 1 2 , 1 3 1
( )
it i t i i i t i t i t i i t i it it
u c f d a b f− u − e f− e u − e p − ε
Δ = Δ + + − + Δ + Δ + Δ + . (13)
The estimates for the individual countries are given in Table A2. For large N and T,
Pesaran (2006) shows that, under relatively weak assumptions, such regressions using
weighted averages, like ft, as additional regressors give consistent estimates of the
coefficients and reduce cross-section dependence in the residuals16.
Using standard critical values Δft is significant in 17 countries; ft−1 is significant in
14; and Δft−1 in 6. Only in Japan is no measure of the global factor significant.
Lagged unemployment is significant in 16, the lagged change in 11 and lagged
inflation in 6. The R2 for changes in unemployment is below 0.5 in Iceland and
Japan; and above 0.7 in 10 countries. Under the null of no long-run relationship the
test statistics are non-standard. Pesaran Shin and Smith (2001) provide a bounds test
for a long-run relationship, which is appropriate whether the variables are I(0) or I(1).
Assuming the variables are I(1) we can reject the null hypothesis of no long-run
relationship between unemployment and the global factor in 12 of the 21 countries at
the 5% level. Another four are uncertain, lying between the 10% I(0) bound and the
5% I(1) band. The tests would not reject no long-run relation in Denmark, Germany,
Ireland, New Zealand and Sweden. On balance this suggests that the national
15
The world real rate of interest is calculated as the weighted average of the real rate of interest in the G7 countries; the real rates being the difference between the long nominal rates and annual inflation and the weights being the Heston-Summers relative GDP for each country.
16
idiosyncratic factors are I(0) in most countries and the stochastic trend in
unemployment comes from the global factor. Panel cointegration tests would not be
informative here, since the null hypothesis of such tests, no cointegration in any
country, is not very interesting, because there is clearly cointegration in most
countries.
The equation was estimated by the Swamy RCM method, which takes precision
weighted averages of the individual country coefficients, with non-parametric
standard errors, and by fixed effects, which imposes homogeneity of slopes across
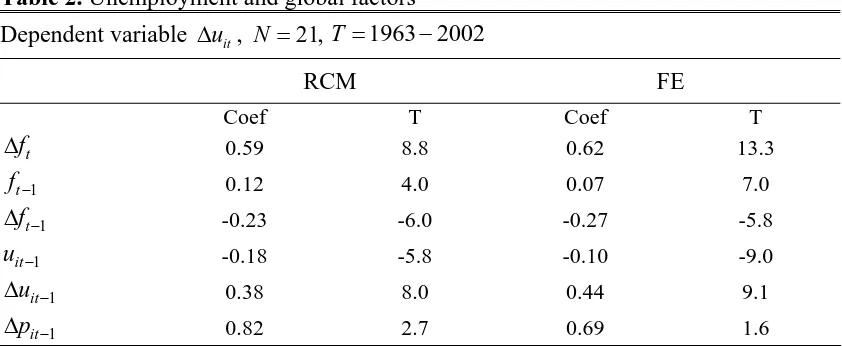
[image:16.595.90.511.306.479.2]countries. The results are given in Table 2.
Table 2. Unemployment and global factors
Dependent variable Δuit, N =21,T =1963 2002−
RCM FE
Coef T Coef T
t
f
Δ 0.59 8.8 0.62 13.3
1 t
f− 0.12 4.0 0.07 7.0
1 t
f−
Δ -0.23 -6.0 -0.27 -5.8
1 it
u − -0.18 -5.8 -0.10 -9.0
1 it
u −
Δ 0.38 8.0 0.44 9.1
1 it
p −
Δ 0.82 2.7 0.69 1.6
For the fixed effect, R2 =0.48, SER=0.65. The maximised log-likelihood for the
fixed effect estimator compared to a total MLL of –484 for the heterogeneous
estimator given in A2. Homogeneity of the parameters is massively rejected, but if we
are primarily interested in average effects, which is what most of the theory is
concerned with, this may not matter. The Fixed Effect Estimates are very similar to
the Swamy estimates, except that the speed of adjustment is lower, which is what one
should expect from the heterogeneity bias discussed in Pesaran and Smith (1995). The
long-run effect of the global factor is almost identical, 0.68 versus 0.7. Imposing
homogeneity does not seem to influence the estimates of the average effect. 818
−
We examined the structural stability of the relationship by estimating the model over
the period 1963-1982 and 1983-2002. The RCM estimates are given in Table 3. The
coefficient on lagged unemployment is larger in the first period. The long run effect
of the global factor is 0.61 in the first period and 0.87 in the second, perhaps
reflecting increased globalisation. It is probably safer not to put too much weight on
this, since a trend interacted with the global factor was not significant. It is also
noticeable that the coefficient of lagged unemployment is lower in both sub-periods
than in the whole period. This may reflect the downward small T bias that results
from reducing T from 40 to 20. The fixed effect estimates for the two periods showed
similar features. With the fixed effect estimates one can test for coefficient equality in
the two periods. Since the variances were very similar in the two periods, Chow’s first
test is appropriate. Each fixed effect regression estimates 6 slope parameters and 21
intercepts, so the distribution is F(27,786). The test statistic is 2.6 which would
certainly reject the null of parameter constancy, given the large sample. But while
[image:17.595.87.512.413.562.2]significant the differences are not large.
Table 3. Structural Stability
Dependent variable Δuit, N =21, RCM estimates 1963 1982
T = − T =1983 2002−
Coef T Coef T
t
f
Δ 0.50 6.6 0.61 5.1
1 t
f− 0.23 2.9 0.20 3.3
1 t
f−
Δ -0.18 -1.8 -0.23 2.7
1 it
u − -0.38 -4.0 -0.23 -3.6
1 it
u −
Δ 0.32 3.0 0.36 4.9
1 it
p −
Δ 0.42 2.6 0.46 1.2
In Smith and Zoega (2006) we further show that the global factor is much more
important than institutions in determining national unemployment and that the implied
equilibrium rate from the unemployment adjustment equation is the same as the
implied equilibrium rate of unemployment in the Phillips Curve, both being functions
of the global factor.
In section 3 we suggested that perhaps Keynes was right, investment drives
unemployment and both are driven by expected returns on production, hence the
similarity in their common factor. While there will be idiosyncratic national factors,
expected returns will be largely driven by global factors: there is a large common
component in investment and unemployment and these common components are
almost identical and can be given a natural interpretation as an expected rate of return.
This prompts the question: what determines the expected rate of return? But perhaps
Keynes was right on this also; the expected rate of return is not determinate, but a
social product of animal spirits. Even among the heterodox community, ‘Chapter 12
Keynesianism’ has not been well received, being perceived as too nihilistic, leaving
nothing to tie the model down. However, similar ideas have recently become
influential within mainstream theory, albeit in narrow technical areas.
It is well established that such ‘sunspot’ beliefs can drive real factors. Animal spirits
do live on in the literature, in the form of models with multiple equilibria, each with
self-fullfilling expectations, driven by some irrelevant signal. For instance Xiao
(2004) derives an International Real Business Cycle (IRBC) model with increasing
returns in the production technology that generate sunspot equilibria. These sunspots
are interpreted as self-fulfilling demand shocks, like animal spirits and generate
positive international correlations of output, employment and investment, unlike most
IRBC models. Entrepreneurs may lock onto such signals for the lack of anything
better. Similarly Harrison and Weder (2006) find that a sunspot model driven by a
measure of confidence, an interest rate spread, can explain the entire Great Depression
era in the US, i.e. not only the decline 1929-32 and the slow recovery, but also the
recession of 1937-8. Increasing returns are not necessary, Hashimzade and Ortigueira
(2005) find that a neoclassical model with labour market frictions displays
expectations driven business cycles where the indeterminacy of equilibrium stems
from job search externalities.
The discussion in chapter 12 of the GT fits well with the large recent literature in
behavioral finance that argues that individuals do not behave rationally but skew
investment decisions under the pressure of psychological traits. These traits include
overconfidence, reluctance to confront evidence that contradicts existing beliefs,
inferring patterns from random sequences and herding. Shiller (2000) discusses these
issues for stock markets, De Grauwe and Grimaldi (2006) for foreign exchange rates.
But there is a difference. Most behavioral finance tends to argue that there is a right
answer, a rational choice, but that people tend not to find it because they are unable to
do the calculations or are swayed by psychological factors. Keynes made the more
radical argument – based on his work on probability – that they could not behave
rationally because there was no basis for a rational calculation. One case, which is
emphasized by some within behavioral finance where there is no basis for calculation,
corresponds to Keynes’s beauty contest example where it is required to estimate what
average opinion expects average opinion to be. Then with heterogeneous information,
there is an infinite regress. Pesaran (1987) discusses such problems. It is often the
case that the success of an investment depends on complementary actions by other
firms so the investor must form expectations about the expectations of other firms:
internet merchants depended on broadband provision by other firms. The dot-com
boom was not merely a stock market phenomenon, it was accompanied by massive
real investment, particularly in telecommunications.
In discussing such calculations it is useful to follow the common distinction between
conditions of risk where one can identify the possible states of the world and assign
probabilities to them; uncertainty where one can identify the possible states but cannot
assign probabilities to them; and ignorance where one cannot even identify possible
states.
The expected rate of return will depend on expectations about the elasticity of
demand, which determines the mark-up and will reflect competition; the growth in the
cost of wages and other inputs, which will reflect the speed of globalization;
technological changes which influences products and processes and thus productivity;
as well as a host of other factors. Thus it is quite possible that a firm cannot identify
all of the possible states of the world that may influence these things, e.g. unrest in
China disrupting component supplies. Firms that use scenario planning emphasize
that these are not predictions, but ways of thinking about how to deal with the
unexpected. Solow (2006) commenting on the lack of a good mechanism for the
uncertainty that resists even the minimal regularity needed for the probability calculus
to apply.
To avoid the problem of thinking of all the possible states, it is usual to focus on a
single random variable, profits, and assume a distribution for, say, profits next year.
Of course, profits depend on all the other events, many of which you cannot imagine,
but this device circumvents the problem of not being able to enumerate the states of
the world. It does not, however, fully circumvent the problem of calculating expected
returns, because many distributions do not have mathematical expectations. The
number of years required to get a PhD, for instance, does not have an expected value
because many of those who start do not finish. In this case, one usually uses the
median, the number of years for 50% to get a degree. In other cases, distributions with
fat tails, there may not be a simple summary statistic. Distributions like the normal are
said to have thin tails, the probability of outcomes many standard deviations from the
mean are tiny. But many economic and financial variables show fat tails, higher
probabilities of very large negative or positive outcomes. Any sample for a random
variable that does not have an expected value will have a mean, but that mean will
jump around wildly from sample to sample and not converge to any particular value
as the sample gets larger. Standard deviations or variances can no longer be used to
measure risk, because distributions without an expected value do not have a variance
either. The importance of distributions without variances in finance was emphasized
by Mandelbrot (1963) and Mandelbrot and Hudson (2004) extends the argument.
The usual calculations required in finance involve not just the expected value of
profits next year, but of the infinite-horizon expected present value of all future
profits. One typically calculates the expected profits by assuming that they will have a
constant growth rate. For instance in the Gordon growth model with current profits P,
expected to grow at rate and discount rate r, the expected present value is P/(r-g).
This present value is only defined if and if r is only slightly greater than ,
the expected present value will jump around wildly for even small variations in the
parameters and This carries over into less simple settings. Pesaran et al. (2007)
examine the existence of such expected present values under uncertainty about the
growth rate of future profits. They show that under quite plausible assumptions, such
g
,
r>g g
expected present values may not converge. This happens because uncertainty about
the growth rate increases at a faster rate than the discounting of future outcomes and
there is some probability that the (constant) growth rate exceeds the interest rate
causing the present value to diverge. Even if it does not diverge, when the growth
rate and interest rate are close, the expected present value will jump around wildly.
The non-existence or extreme instability of conventionally calculated expected returns
suggest that there are good reasons to believe that Keynes was right in saying that
‘human decisions affecting the future, whether personal or political or economic,
cannot depend on strict mathematical expectation, since the basis for making such
calculations does not exist’. But immediately before this he said ‘We should not
conclude from this that everything depends on waves of irrational psychology. On the
contrary, the state of long-term expectations is often steady, and even when it is not,
the other factors exert their compensating effects.’ As Pesaran (1987) observes ‘The
fact that erratic changes in business expectations are not usually observed is largely
due to the relatively stable nature of our economic and social institutions.’ He argues
that it is important to measure expectations by surveys, and then see whether they can
be modeled. Manski (2004) takes a similar position.
Keynes noted ‘The state of confidence, as they term it, is a matter to which practical
men always pay the closest and most anxious attention.’ (CW, 7, 148) and Central
Banks certainly pay the closest and most anxious attention to surveys of expectations
and the state of confidence when making monetary policy. It is clearly much easier to
measure national business confidence, than global. But one may expect global
expected returns to show stable patterns, plus large shifts, a characteristic shown by
the common component of investment and unemployment discussed above.
5.
Concluding thoughts
The history of economic thought is interesting, not because the pioneers knew more
than we do, but because being pioneers facing new issues they were often willing to
think radical thoughts. Sometimes those radical thoughts get forgotten. We have
unemployment and expected returns can show large shifts because there may be no
probabilistic basis for their calculation, have been partly forgotten. The latter insight
is being rediscovered in finance, but the former seems still widely ignored in
economics.
The current literature on the causes of persistent unemployment in general, the
problem of European unemployment in particular, seems strangely oblivious, with a
couple of notable exceptions, to a strong long-run relationship between employment
and investment. One of the few things that Hayek and Keynes did agree on in an
earlier age has gone missing in the current search for a theory explaining the
stubbornly high unemployment found in some of the European countries. The
renewed emphasis on the labour market – the return to an almost classical approach –
its institutions and equilibrating mechanisms, has deprived us of a larger view where
product and capital markets are important pieces of the story. Yet, the stylised
relationships between institutions and unemployment are much weaker than the
investment-employment relationships shown in Figures 1 and 2 above. The latter are
neglected by the mainstream literature, to the detriment of our understanding of the
long swings in economic activity and the factors that drive expected returns including
abrupt changes in expectations.
References
Arestis, P., and M. Sawyer (2005) Aggregate Demand, Conflict and Capacity in the inflationary process, Cambridge Journal of Economics, 29, 959-974.
Bai, J. and S. Ng (2004), A PANIC Attack on Unit Roots and Cointegration, Econometrica, 72, 1127-1178.
Baker, G. D., A. Glyn, D. R. Howell, and J. Schmitt (2004), “Labor Market Institutions and Unemployment: A Critical Assessment of the Cross-Country Evidence.” in D. Howell, ed. Fighting Unemployment: The Limits of
Free Market Orthodoxy, Oxford University Press, 2004.
Bean, C. and J. Dreze (1990), Europe’s Unemployment Problem, The MIT Press, Cambridge, MA.
Interactions, Lionel Robbins Lectures.
Blanchard, O. (2006), European Unemployment: The Evolution of Facts and Ideas, Economic Policy, 45(Jan) pp5-59.
Bloom, N. (2007) The impact of uncertainty shocks, NBER Working Paper 13385.
Bruno, M and J. Sachs (1985), The Economics of Worldwide Stagflation, Basil Blackwell, Oxford.
Clower, R. (1965), The Keynesian Counterrevolution: A theoretical appraisal, in Hahn and Matthews (eds.), Theory of Interest Rates, Macmillan, London
Coakley, J., A-M Fuertes and F. Spagnolo (2004) Is the Feldstein-Horioka Puzzle History ? Manchester School, 72(5) 569-590.
De Grauwe, D and M. Grimaldi (2006) The Exchange Rate in a Behavioural Finance Framework, Princeton University Press.
Dow, A and S. Dow (1985) Animal Spirits and Rationality, Ch 3 Lawson, T and M.H. Pesaran Keynes’ Economics: Methodological Issues, Croom-Helm.
Fitoussi, J-P, D. Jestaz, E.S. Phelps, G. Zoega (2000), Roots of the Recent
Recoveries: Labor Reforms or Private Sector Forces?, Brookings Papers on Economic Activity, 1, p 237-291.
Friedman, M. (1968), The Role of Monetary Policy, The American Economic Review, 57, p. 1-17.
Harrison, S.G. and M. Weder (2006) Did sunspot forces cause the Great Depression, Journal of Monetary Economics, 53, 1327-1339.
Hashimzade N., and S. Ortigueira (2005) Endogenous Business Cycles with Frictional Labour Markets, Economic Journal, 115, C161-C175.
Hayek, F.A. (1931), Prices and Production, London, Routledge & Kegan Paul.
Hicks, J.R. (1937) Mr Keynes and the Classics, Econometrica, 5, 147-159.
Kerr, P (2005) A History of post-Keynesian economics, Cambridge Journal of Economics, 29(3) 475-496.
Keynes, J.M. Collected Writings, Macmillan for the Royal Economic Society.
Kose, M.A., C. Otrok and C.H. Whiteman (2003) International Business Cycles: World, Region and Country Specific Factors, American Economic Review, 93(4) 1216-1239.
Leijonhufvud, A. (1968), On Keynesian Economics and the Economics of Keynes: A Study in Monetary Theory, Oxford University Press.
Leijonhufvud, A. (1998), Mr Keynes and the Moderns, European Journal of the History of Economic Thought, p.169-188.
Lindbeck, A. and D. Snower (1989), The Insider-outsider Theory of Employment and Unemployment, The MIT Press, Cambridge, MA.
Malley J. and T Moutos (2001) Capital Accumulation and Unemployment: A Tale of Two Continents, Scandinavian Journal of Economics, 103(1), 79-99.
Mandelbrot, B. (1963) New Methods on Statistical Economics, Journal of Political Economy, 71, 421-440.
Mandelbrot, B. and R.L. Hudson (2004) The (Mis)Behaviour of Markets; A Fractal View of Risk, Ruin and Reward, Basic Books, NY.
Manski, C.F. (2004) Measuring Expectations, Econometrica, 72(5) 1329-1376.
Modigliani, F. (1944), Liquidity Preference and the Theory of Interest and Money, Econometrica, 44 (3), p. 269-286.
Modigliani, F. (2000), Europe’s Economic Problems. Prepared for Testimony before the Monetary Committee of the European Central Bank.
Nickell, S., L. Nunziata and W. Ochel (2005), Unemployment in the OECD since the 1960s. What do we know? The Economic Journal, vol. 115, p. 1-27.
Oi, Walter Y (1962) Labor as a Quasi-fixed Factor, Journal of Political Economy, 70, p. 538-55.
Pesaran, M.H. (1987) The Limits to Rational Expectations, Basil Blackwell.
Pesaran M.H. (2006) “Estimation and inference in large heterogeneous panels with a multifactor error structure” Econometrica 74(4), 967-1012.
Pesaran, M.H., D. Pettenuzzo and A. Timmerman (2007) Learning, Structural Instability and Present Value Calculations, Econometric Reviews 26, p253-288.
Pesaran, M.H., Y. Shin, and R.J. Smith (2001 ) Bounds Testing Approaches to the Analysis of Levels Relationships, Journal of Applied Econometrics, 16, 289-326.
Pesaran, M.H. and R.P. Smith (1985) Keynes on Econometrics, Lawson, T and M.H. Pesaran Keynes’ Economics: Methodological Issues, Croom-Helm.
Pesaran, M.H. and R.P. Smith (2006) Macroeconometric Modelling with a Global Perspective, Manchester School, supplement, 24-49.
Phelps, E.S. (1968), Money-Wage Dynamics and Labor-Market, The Journal of Political Economy, 76 (4), p. 678-711.
Phelps, E.S. (1990), Seven Schools of Macroeconomic Thought. The Arne Ryde Memorial Lectures, Clarendon Press, Oxford.
Phelps, E.S. (1994), Structural Slumps, Harvard University Press.
Pissarides, C.A. (2000), Equilibrium Unemployment Theory, Cambridge, 2nd edition, Mass.: Basil Blackwell.
Salop, S.C. (1979), A Model of the Natural Rate of Unemployment, The American Economic Review, vol. 69, no. 1, p. 117-125.
Shapiro, C. and J.E. Stiglitz (1984), Equilibrium Unemployment as a Disciplinary Device, The American Economic Review, 74, p. 433-444.
Shiller, R.J. (2000), Irrational Exuberance, Princeton University Press.
Smith, R.P. and G. Zoega (2006), Global Factors, Unemployment Adjustment and the Natural Rate, manuscript, Birkbeck College.
Solow, R.M. Comments on Papers by Saint-Paul, Aghion and Bhide, Capitalism and Society, 1,1, article 3, Berkeley Electronic Press.
Stock J.H. and M.W. Watson (2005) Implications of Dynamic Factor Models for VAR analysis, NBER Working Paper 11467.
Figure 1. The bad performers 88 90 92 94 96 98 100 14 16 18 20 22 24 26
1960 1965 1970 1975 1980 1985 1990 1995 2000
Employment rate (100-u) Investment (% of GDP)
Belgium % % 86 88 90 92 94 96 98 100 16 18 20 22 24 26 28 30
1960 1965 1970 1975 1980 1985 1990 1995 2000
Employment rate (100-u) Investment (% of GDP)
France % % 88 90 92 94 96 98 100 102 16 18 20 22 24 26 28 30
1960 1965 1970 1975 1980 1985 1990 1995 2000
Employment rate (100-u) Investment (% of GDP)
Germany % % 84 86 88 90 92 94 96 98 100 16 18 20 22 24 26 28 30 32
1960 1965 1970 1975 1980 1985 1990 1995 2000
Employment rate (100-u) Investment (% of GDP)
Italy
% %
Figure 2. The good performers
86 88 90 92 94 96 98 100 102 104 14 15 16 17 18 19 20 21 22 23
1960 1965 1970 1975 1980 1985 1990 1995 2000
Employment rate (100-u) Investment (% of GDP)
United Kingdom % % 89 90 91 92 93 94 95 96 97 98 14 15 16 17 18 19 20 21 22 23
1960 1965 1970 1975 1980 1985 1990 1995 2000
Employment rate (100-u) Investment (% of GDP)
United States
Figure 3. The first two principal components.
-8 -6 -4 -2 0 2 4 6 8
60 65 70 75 80 85 90 95 00
employment - 1st PC
investment - 1st PC
R-squared = 0.92
-4 -2 0 2 4
60 65 70 75 80 85 90 95 00
R-squared = 0.25
employment - 2st PC investment -- 2nd PC
Figure 4. The first PCs and the world discount factor
0.92 0.94 0.96 0.98 1.00 1.02 1.04 1.06
-8 -6 -4 -2 0 2 4 6 8
60 65 70 75 80 85 90 95 00
empl. PC investment PC
[image:27.595.118.474.431.609.2]