BIROn - Birkbeck Institutional Research Online
Freedman, D. and Schlosberg, Justin (2011) Mapping digital media in the
UK. Technical Report. Open Society Foundations, New York, USA.
Downloaded from:
Usage Guidelines:
Please refer to usage guidelines at or alternatively
UNITED KINGDOM
MAPPING DIGITAL MEDIA:
Mapping Digital Media:
United Kingdom
A R E P O R T B Y T H E O P E N S O C I E T Y F O U N D A T I O N S
W R I T T E N B Y
Des Freedman, Justin Schlosberg (reporters)
E D I T E D B Y
Marius Dragomir and Mark Thompson (Open Society Media Program editors)
E D I T O R I A L C O M M I S S I O N
Yuen-Ying Chan, Christian S. Nissen, Dusˇan Reljic´, Russell Southwood,
Michael Starks, Damian Tambini
The Editorial Commission is an advisory body. Its members are not responsible
for the information or assessments contained in the Mapping Digital Media texts
O P E N S O C I E T Y M E D I A P R O G R A M T E A M
Meijinder Kaur, program assistant; Morris Lipson, senior legal advisor;
and Gordana Jankovic, director
O P E N S O C I E T Y I N F O R M A T I O N P R O G R A M T E A M
Vera Franz, senior program manager; Darius Cuplinskas, director
Contents
Mapping Digital Media ... 4
Executive Summary ... 6
Context ... 9
Social Indicators ... 11
1. Media Consumption: Th e Digital Factor ... 13
1.1 Digital Take-up ... 13
1.2 Media Preferences ... 16
1.3 News Providers ... 20
1.4 Assessments ... 22
2. Digital Media and Public or State-Administered Broadcasters ... 25
2.1 Public Service and State Institutions ... 25
2.2 Public Service Provision ... 29
2.3 Assessments ... 31
3. Digital Media and Society ... 32
3.1 User-Generated Content (UGC) ... 32
3.2 Digital Activism ... 35
4. Digital Media and Journalism ... 39
4.1 Impact on Journalists and Newsrooms ... 39
4.2 Investigative Journalism ... 43
4.3 Social and Cultural Diversity ... 47
4.4 Political Diversity ... 49
4.5 Assessments ... 50
5. Digital Media and Technology ... 52
5.1 Spectrum ... 52
5.2 Digital Gatekeeping ... 55
5.3 Telecommunications ... 56
5.4 Assessments ... 59
6. Digital Business ... 60
6.1 Ownership ... 60
6.2 Media Funding ... 64
6.3 Media Business Models ... 67
6.4 Assessments ... 69
7. Policies, Laws, and Regulators ... 71
7.1 Policies and Laws ... 71
7.2 Regulators ... 77
7.3 Government Interference ... 80
7.4 Assessments ... 82
8. Conclusions ... 84
8.1 Media Today ... 84
8.2 Media Tomorrow ... 86
9. Recommendations ... 87
Mapping Digital Media
Th e values that underpin good journalism, the need of citizens for reliable and abundant information, and the importance of such information for a healthy society and a robust democracy: these are perennial, and provide compass-bearings for anyone trying to make sense of current changes across the media landscape.
Th e standards in the profession are in the process of being set. Most of the eff ects on journalism imposed by new technology are shaped in the most developed societies, but these changes are equally infl uencing the media in less developed societies.
Th e Mapping Digital Media project, which examines the changes in-depth, aims to build bridges between researchers and policy-makers, activists, academics and standard-setters across the world. It also builds policy capacity in countries where this is less developed, encouraging stakeholders to participate and infl uence change. At the same time, this research creates a knowledge base, laying foundations for advocacy work, building capacity and enhancing debate.
Th e Media Program of the Open Society Foundations has seen how changes and continuity aff ect the media in diff erent places, redefi ning the way they can operate sustainably while staying true to values of pluralism and diversity, transparency and accountability, editorial independence, freedom of expression and information, public service, and high professional standards.
Th e Mapping Digital Media project assesses, in the light of these values, the global opportunities and risks that are created for media by the following developments:
the switchover from analog broadcasting to digital broadcasting,
growth of new media platforms as sources of news,
convergence of traditional broadcasting with telecommunications.
Th e aim of the Mapping Digital Media project is to assess the impact of these changes on the core democratic service that any media system should provide, namely news about political, economic and social aff airs.
Th e Mapping Digital Media reports are produced by local researchers and partner organizations in each country. Cumulatively, these reports will provide a much-needed resource on the democratic role of digital media.
Mapping Digital Media: United Kingdom
Executive Summary
Th e United Kingdom has had one of the highest levels of digital television uptake in Europe. Take-up of digital television has increased by 7 percent year on year since 2005, reaching 93.1 percent of households by the start of 2011.
Freeview, launched in 2002, has been the main driver of digital television take-up. Providing more than 40 free digital television channels in addition to radio and interactive services, through a normal television aerial, Freeview is now the most widely used digital television service.
At the same time, take-up of internet at home has increased signifi cantly, reaching 76 percent of households in 2011, driven by the rise in PC and laptop ownership as well as broadband rollout which now accounts for 96 percent of home internet connections. All socio-economic and income groups have shared in the internet take-up boom.
Th ese dramatic trends have aff ected news production and consumption in ways that raise important questions about the democratic role of the media.
Despite frequent predictions to the contrary, television is still the most widely accessed and trusted news platform. Yet, young people and ethnic minorities are tuning in less to television news; and in the case of young people, news consumption generally is in decline. Research suggests that middle-aged groups consume terrestrial TV news in conjunction with a rich tableau of digital and traditional news sources, in accordance with daily uses and gratifi cations. But younger generations are increasingly tuning out of terrestrial television news.
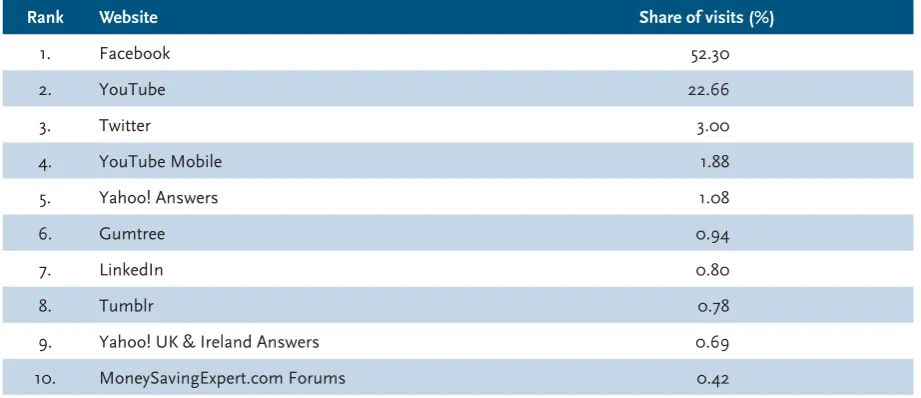
User-generated content (UGC), the blogosphere and social networking have become the most popular new media activity in the UK. Th is activity may not have much to do with news, however. Of the top 20 websites visited in the UK, only two are dedicated news providers. On the whole, studies have found that online news is still accessed largely as part of a broader news diet and, notwithstanding growing numbers, it is accessed by fewer users and for much less time than most other online activities such as shopping, games and email.
A recent study of (partly) UK news content on Facebook, Myspace and YouTube, found that these sites function mainly as refl ective communicative spaces rather than as primary sources of news. News provision online is dominated by an emerging oligopoly of online content providers and aggregators such as the BBC, the Daily Mail, the Guardian, Google, Yahoo!, AOL and MSN. Th e fact that these latter sites rely almost entirely on newswire copy further undermines the claim that the UK is enjoying a golden age of news diversity.
News participation online continues to be marginal, by any defi nition. Most traditional news sites accommodate social media feeds into their pre-established news agendas, only very occasionally signifi cantly altering their reporting frames.
Th e exception is Twitter, which has become a growing source of breaking news stories. A study of communication during the 2010 election campaign concluded that “Twitter cemented its place as a core tool of communication amongst political and media elites.”
Th e BBC is the dominant news provider across all platforms. Overall, the data suggest that it still holds a competitive edge over multi-channel news off erings. Furthermore, the BBC’s key role in digital switch-over has kept it at the cutting edge of digital innovation. Digitization has, on the whole, greatly expanded and diversifi ed the BBC news output, and the success of its online operation has gone some way to plug the public service gap in digital media.
However, there are concerns over news quality. Despite accusations of “dumbing down” its news, the evidence suggest that the BBC operates instead a news “hierarchy”, with analysis and context increasingly restricted to fl agship broadcasts with elite and relatively small audiences. Senior reporters and correspondents speak of a more directed and less questioning journalistic climate, fostering self-censorship and excessive editorial control, exacerbated by increasing resource constraints.
Away from the BBC, concerns over news quality take a diff erent form. News in the UK is increasingly available to people anywhere and at any time, but it is increasingly clear that digital media are super-serving a minority of interested and engaged citizens. Digitization has brought benefi ts to investigative journalism. In practice, however, investigative journalism has become increasingly restricted to an elite tier of news outlets.
Journalism in the UK faces an unprecedented crisis, which has been manifest partly in the increasing homogenization of content. Th ere has been a growth in recycled reports and “second-hand” stories in which news outlets become sources for other providers. Real-time journalism is associated with a reduction in the availability of verifi able information and a corresponding explosion of information “noise”. With news providers extending their services at ever lower costs, this has the paradoxical eff ect of diversifying news services whilst homogenizing news content.
In terms of policy-making in the digital environment, the key step in the UK was the establishment of Ofcom in 2003 as a response to converging media markets and to the need for a co-ordinated regulatory framework. While Ofcom has won plaudits for its research and standard-setting work, it has shown—whatever the current government may say to the contrary—a tendency to under-use rather than abuse its powers, to the detriment of the consumer and public interest.
Overall, this research shows that near universal digital media access has yielded broad benefi ts for citizenship and democracy. But key areas of concern have emerged that continue to pose threats to independence, plurality and diversity. Th ese include sustained fi nancial crises within regional and local media, public service broadcasting, and the press sector at large; acute sites of cross media concentration; and persistent digital divides in terms of access to “quality” output.
In this context, the report calls on policymakers to consider new funding options and structures to safeguard the future of public-interest oriented news. Th is should include the introduction of levies on the profi ts of the largest commercial communications companies, as well as the involvement of civil society groups and local communities, working alongside professional journalists, to create sustainable and relevant news organizations.
Context
Th e United Kingdom comprises the national regions of England, Wales, Scotland, and Northern Ireland. All except England have devolved governments with diff ering legislative powers. It has a multicultural population of 61 million that is ageing rapidly, although this has been to some extent checked in recent years by EU migration.
Th e UK economy is dominated by the service sector and has a relatively large trade defi cit in manufacturing. It is also one of the most deregulated economies in the European Union and is ranked by the World Bank as the fourth most “business friendly” economy in the world. Despite this, there has been a steep decline in direct foreign investment since 2007.1 Th e economy’s dependence on global trade and the City of London
rendered it acutely vulnerable to—and implicated in—the global fi nancial crisis of 2008.2 As a result of the
economic stimulus package and bank bailouts that followed, the UK public debt ballooned to just under 65 percent of GDP in 2010 (compared to 35 percent in 2007) with a budget defi cit of £7.1 billion.3 Th is
prompted an unprecedented regime of public spending cuts in the midst of a fl edgling economic recovery.4
Th e cuts were announced following a general election in 2010 that resulted in a hung parliament and a coalition government formed by the Conservative and Liberal Democrat parties. Given that the UK electoral system is “fi rst-past-the-post,” not based on proportional representation, this outcome refl ected fundamental divisions in the electorate, with a clear potential to create political instability. Th is potential was evident in the public unrest that surfaced at the end of 2010, primarily in response to dramatic cuts in funding higher education.
1. Th e World Bank, Foreign direct investment, net infl ows, Washington, D.C., 2010, available at http://data.worldbank.org/indicator/BX.KLT. DINV.CD.WD (accessed 20 December 2010).
2. B. Masters, “Lehman job losses hit ailing UK economy,” Financial Times, 15 September 2008, available at http://www.ft.com/cms/s/0/7484e30c-8369-11dd-907e-000077b07658.html.
3. Offi ce for National Statistics, Public Sector Finances, London, 2010, available at http://www.statistics.gov.uk/cci/nugget.asp?id=206 (accessed 20 December 2010).
Signifi cant social unrest followed in 2011, manifested acutely in the riots that swept through London and other urban centres in June. Th ough widely characterized as opportunistic and apolitical, in light of the widespread looting that followed, the riots were initially sparked by local outrage over the fatal shooting by police of an apparently unarmed suspect. Th ey also came at the heels of a string of high-profi le scandals over the past two years exposing corruption in Parliamentary fi nances (widespread expense fraud by elected politicians), the Royal Family (the Duke of York’s close relationship with several dictators as Britain’s unoffi cial trade ambassador), and most endemically, the tabloid media and police (the News of the World phone hacking scandal and alleged complicity by police and politicians in a subsequent cover-up).
Th is drew an unprecedented response from News Corporation—the parent company of the News of the World—which closed down the paper and withdrew its bid to buy out the remaining shares of BSkyB (in which it already has a controlling interest). Policymakers for their part initiated an equally unprecedented response in both the number and the scope of reform initiatives. At the centre of these is the ongoing Leveson Inquiry into the ethics and practices of the press.5 Although the outcome of the Inquiry and other initiatives
remain uncertain, British journalism is arguably at a crossroads and facing substantive reform.
Social indicators
[image:13.581.211.397.339.468.2]Population (number of inhabitants): 61.6 million Number of households: 25.6 million
Figure 1.
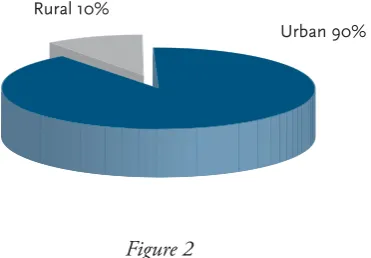
Rural/urban breakdown (% of total population)
Figure 2
Ethnic composition (% of total population)
Linguistic composition (% of total population):English is the only offi cial language.
Rural 10%
Urban 90%
Chinese 0.4% Black or Black British 2.0%
Other 1.5%
[image:13.581.124.408.507.597.2]Figure 3
Religious composition (% of total population)
Sources: Social indicators from ITU and Offi ce of National Statistics (ONS), and most recent national census (2001).
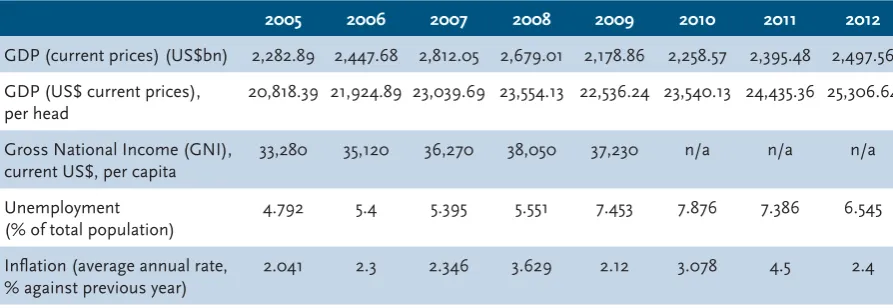
Table 1
Economic indicators, UK: 2005–2012
2005 2006 2007 2008 2009 2010 2011 2012
GDP (current prices) (US$bn) 2,282.89 2,447.68 2,812.05 2,679.01 2,178.86 2,258.57 2,395.48 2,497.56
GDP (US$ current prices), per head
20,818.39 21,924.89 23,039.69 23,554.13 22,536.24 23,540.13 24,435.36 25,306.64
Gross National Income (GNI), current US$, per capita
33,280 35,120 36,270 38,050 37,230 n/a n/a n/a
Unemployment (% of total population)
4.792 5.4 5.395 5.551 7.453 7.876 7.386 6.545
Infl ation (average annual rate, % against previous year)
2.041 2.3 2.346 3.629 2.12 3.078 4.5 2.4
Sources: International Monetary Fund (IMF), except GNI data from the World Bank.
Muslim 2.8%
Christian 71.8% No religion 15%
Other 8.3%
Hindu 1%
Jewish 0.5%
[image:14.581.66.513.281.435.2]1. Media Consumption:
the Digital Factor
1.1 Digital
Take-up
[image:15.581.61.520.379.482.2]1.1.1 Digital Equipment and Literacy
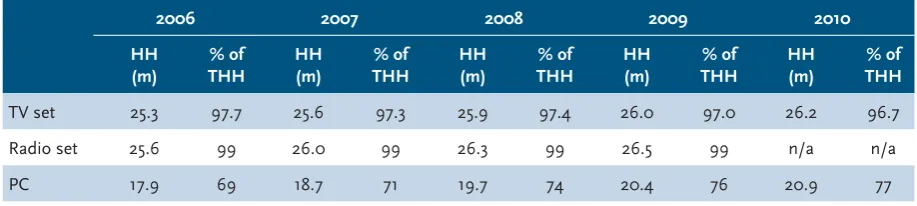
Table 2
Households owning communications equipment in the UK, 2006–2010
2006 2007 2008 2009 2010
HH (m)
% of THH
HH (m)
% of THH
HH (m)
% of THH
HH (m)
% of THH
HH (m)
% of THH
TV set 25.3 97.7 25.6 97.3 25.9 97.4 26.0 97.0 26.2 96.7
Radio set 25.6 99 26.0 99 26.3 99 26.5 99 n/a n/a
PC 17.9 69 18.7 71 19.7 74 20.4 76 20.9 77
Sources: Offi ce of Communications (Ofcom), Consumer Market Reports, London, 2006–2010; Rajar, Television Ownership in Private Domestic Households 1956-2011, available at http://www.barb.co.uk/facts/tv-ownership-private?_s=4 (accessed 6 December 2011).
Notes: HH: households; THH: total households; TV: Television; PC: personal computer; n/a: not available.
Use of digital media has become both widespread and multifarious among UK households. In a 2010 consumer survey, 79 percent of respondents attested to having accessed digital media in the past month.6
Th e rise in digital media has been experienced across all demographics but there remain signifi cant divides, particularly in the arenas of media literacy and the quality of access. According to 2010 research by Ofcom, the converged regulator which regulates television, radio, fi xed-line telecommunications, and mobiles, as well
as the airwaves, users who experience diffi culty with various digital media are most likely to be over 75 or in the lowest socio-economic and income groups.7 In terms of news, traditional platforms remain dominant,
although half of television news viewers access services associated with digital transmission.8 Th ese include
24-hour news channels, foreign news channels, and interactive or on-demand news services.
[image:16.581.65.519.200.385.2]1.1.2 Platforms
Table 3
Platform penetration in UK, 2006–2010
2006 2007 2008 2009 2010 No. of HH
(m)
% of TV HH
No. of HH (m)
% of TV HH
No. of HH (m)
% of TV HH
No. of HH (m)
% of TV HH
No. of HH (m)
% of TV HH
Terrestrial reception 13.1 51.7 12.7 49.5 12.8 49.9 12.3 47.8 11.9 44.0 of which digital 7.7 30.4 9.6 37.4 9.9 38.6 10.1 39.2 10.1 37.3
Cable reception 3.4 13.4 3.5 13.7 3.3 12.9 3.2 12.4 3.4 12.6 of which digital 3 11.8 3.3 12.9 3.3 12.9 3.2 12.4 3.4 12.6
Satellite reception 8.8 34.7 9.4 36.7 9.5 37.0 9.8 38.1 11.3 41.7 of which digital 8.8 34.7 9.4 36.7 9.5 37.0 9.8 38.1 11.3 41.7
IPTV 0.04 0.2 0.04 0.1 0.07 0.2 0.45 1.9 0.47 1.9
Total 25.3 100.0 25.6 100.0 25.7 100.0 25.8 100.0 27.1 100.0 of which digital 19.5 77.1 22.3 87.1 22.8 88.6 23.6 91.6 25.27 93.5
Sources: Ofcom, Television Update, Q4 2006–2010.
Notes: IPTV: Internet Protocol Television.
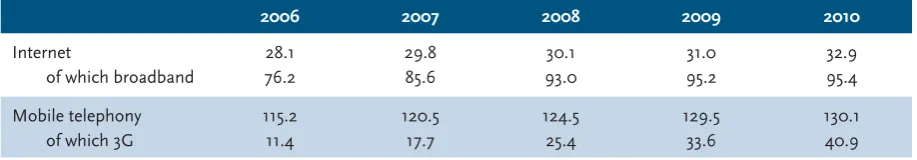
Table 4
Total internet subscriptions as % of total population and mobile phone connections as % of total population in UK, 2006–2010
2006 2007 2008 2009 2010
Internet 28.1 29.8 30.1 31.0 32.9
of which broadband 76.2 85.6 93.0 95.2 95.4
Mobile telephony 115.2 120.5 124.5 129.5 130.1
of which 3G 11.4 17.7 25.4 33.6 40.9
Source: Ofcom, Communications Market Report 2011, p. 245, available at http://stakeholders.ofcom.org.uk/binaries/research/ cmr/cmr11/UK_CMR_2011_FINAL.pdf (accessed 6 December 2011). (3G—or “Th ird Generation”—refers to mobile phone subscriptions with access to data communication at broadband speed.)
7. Ofcom, Th e Consumer Experience, London,2010, p. 52 (hereafter, Ofcom, Th e Consumer Experience, 2010), available at http://stakeholders. ofcom.org.uk/binaries/research/consumer-experience/tce-10/consumer-esperience-10.pdf (accessed 9 December 2010).
[image:16.581.62.521.485.565.2]1.1.2.1 Digital Television
Th e overall take-up of digital television has been rapid in the UK, and has increased signifi cantly year-on-year since 2005, reaching 93.1 percent of households in 2011.9 Digital satellite began in 1998 and analog satellite
services were discontinued in 2001. Cable television services continue to exist in analog form although usage has declined to the extent that digital is the near universal mode of access among cable consumers.10
In 2002 digital terrestrial services were launched in their current form, as Freeview, providing more than 40 free digital television channels in addition to radio and interactive services, through a normal television aerial. Th is has been the main driver of digital television take-up with a comparatively small increase in satellite subscription since 2003.11 It is now the most widely used digital television service,12 and by 2008 the UK
had the highest levels of digital television uptake in Europe.13 Th is is at least partly attributable to the British
Broadcasting Corporation (BBC)’s lead role in driving switch-over, building a network of digital transmitters as part of its 2006 Charter Renewal. But it also owed much to the work of the market built on the spectrum allocation policies mentioned above.
1.1.2.2 Digital Radio
In contrast, radio switch-over policy has been less successful, with digital accounting for just over a quarter of radio listening hours in 2011.14 Much of this is down to the slow migration rate of broadcasters facing
high fi xed costs and falling revenues. Many of those providers who have invested in digital radio are paying dual transmission fees for broadcasting in both analog and Digital Audio Broadcasting (DAB). But equally signifi cant has been a lack of perceived benefi t over costs from the consumers’ point of view. Th is has led some to question whether a digital radio switch-over is necessary or desirable.15 Th e Government’s Digital
Radio Action Plan nonetheless set a target date of 2015 for switch-over, subject to criteria designed to ensure that the process was consumer-led, including a requirement that digital platforms account for a minimum 50 percent of all radio listening.16
9. Ofcom, Digital TV Update Q1 2011, London,2011, available at http://stakeholders.ofcom.org.uk/binaries/research/tv-research/tv-data/dig-tv-updates/Q1_2011_DTV_Update.pdf (accessed 8 December 2011).
10. Ofcom, Communications Market Report: UK,p. 39 (hereafter, Ofcom, CMR), available at http://stakeholders.ofcom.org.uk/binaries/research/ cmr/cmr11/UK_CMR_2011_FINAL.pdf (accessed 8 December 2011).
11. Ofcom, Th e Consumer Experience 2009, London,2009, p. 39 (hereafter, Ofcom, Th e Consumer Experience, 2009), available at http://stakehold-ers.ofcom.org.uk/binaries/research/consumer-experience/research09.pdf (accessed 4 September 2010).
12. Ofcom, CMR, p.83.
13. Ofcom, Th e Consumer Experience, 2009, p. 38. 14. Ofcom, CMR, p. 157.
15. Consumer Expert Group, Digital Radio Switchover: What is in it for consumers? Report to the Department for Culture, Media and Sport (DCMS), London, September 2010, available at: http://www.vlv.org.uk/documents/DigitalRadioSwitchoverReportFinalfromDCMSAug10_000.pdf (ac-cessed 10 September 2010).
1.1.2.3 Internet
Take-up of internet at home has increased signifi cantly in recent years, reaching 76 percent of households in 2011, driven by the rise in PC and laptop ownership as well as broadband rollout, which now accounts for the overwhelming majority of home internet connections.17 Th ere has also been a concomitant upward
trend in the use of the internet in any location and in the use of mobile broadband. Although the majority of internet usage is centered around social networking and blogging sites, more than a third is occupied by online news and more than a fi fth by television/video-on-demand and downloaded music.18 Ofcom research
suggests that those without internet access are more or less equally divided between “voluntary” and “non-voluntary” categories; the primary issue for the latter group remains aff ordability.19
1.2 Media
Preferences
1.2.1 Main Shifts in News Consumption
News outlets have continued to proliferate since 2005 as a result of digital media expansion, and there have been corresponding changes in consumption habits. Broadly, the most signifi cant changes have been a relatively steep decline in print news consumption and a moderate decline in radio news listenership, both of which have been somewhat off set by a small increase in television consumption and a larger increase in online news consumption. Nevertheless, the rise of digital media has exacerbated, if not precipitated, a crisis in funding for professional journalism (see section 6).
1.2.1.1 Online News
Research in 2006 found that the online news audience was increasing rapidly.20 However, other research
suggested that the increase in reading or downloading news online between 2003 and 2006 was marginal.21
Much of this discrepancy was attributable to the increasing diffi culties in measuring and defi ning news, particularly in the context of social media. A broader categorization tends to result in more signifi cant growth indicators, in line with the exponential rise of social networking sites and the blogosphere. As mentioned above, just over one third of new-media usage is taken up with online news excluding social networking and blogging sites, but current traffi c reports suggest that of the top 20 websites visited in the UK, only one is a dedicated news provider.22
17. Ofcom, CMR, p. 72. 18. KPMG, Time is Money, p. 5.
19. Ofcom, Consumer Experience 2010, pp. 47–51. 20. Ofcom, New News, Future News.
21. ONS, Focus On the Digital Age, London, 2007, p.11, available at http://www.statistics.gov.uk/downloads/theme_compendia/foda2007/Focus OnDA.pdf.
On the whole, studies have found that online news is still accessed largely as part of a broader news diet and, notwithstanding growing numbers, it is accessed by fewer users and for much less time than most other online activities such as shopping, games, and email. Ofcom noted that in 2010 only 2 percent of total internet time was taken up by news consumption. Th is contrasts, however, with the 37 percent of all adults who say they use the internet to “keep up to date” with news.23 Th is suggests that although more people may access
news, usage is blurred with other genres and consumption may be more superfi cial as a result. On the whole, users predominantly access online news sites that are run by traditional news providers,24 and web searching
itself tends to favor established sites in a “winner takes all pattern.”25 Although the dominance of traditional
news providers is not total, it is eclipsed only by an emerging oligopoly of online content aggregators such as Google, Yahoo!, AOL, and MSN.26
1.2.1.2 Television News
Television is the most widely accessed and trusted news platform,27 and consumption increased slightly
between 2002 and 2006. Furthermore, the number of hours devoted to news on the fi ve terrestrial public service broadcasting (PSB) channels increased from 2004 to 2010,28 and audiences for weekday evening
news shows have remained largely stable after a steady decline throughout the 1990s and early 2000s. Th is is at least partly attributable to the growth of 24-hour and foreign news channels accessible to digital viewers. Signifi cantly, however, research across the board has found that young people and ethnic minorities are tuning in less to television news and, in the case of the former, consumption of news generally is in decline.
Qualitative research suggests a “backlash against excessive attention to celebrities at the expense of properly explaining news of more direct relevance to people.”29 Although this fi nding applied to all demographic
groups, the authors caution against drawing far-reaching conclusions, given that celebrity-led programs in general are nevertheless very popular. However, they argue that there “does seem to be genuine public resistance to some broadcasters’ belief that the key to public engagement with news and political news will be achieved via the medium of celebrity presenters or other celebrity involvement.”
1.2.1.3 National Press
Th e same research found that print news is in decline, a pattern refl ected in recent data that show a year-on-year fall in readership for all major titles.30 However, it is diffi cult to ascertain the role of digital media in this
decline. Th e growth of online news consumption, particularly among younger groups, has likely played a part
23. Ofcom, CMR, pp. 210, 220.
24. I. Hargreaves and J. Th omas, New News, Old News, Cardiff University, Cardiff , 2002, p. 43 (hereafter, I. Hargreaves and J. Th omas, New News, Old News).
25. M. Hindman, Th e Myth of Digital Democracy, Princeton University Press, Princeton, NJ, 2009, p.132. 26. Content aggregators are websites that host news content provided by other sources.
27. I. Hargreaves and J. Th omas, New News, Old News, pp. 46, 74. 28. Ofcom, CMR, p. 127.
29. I. Hargreaves and J. Th omas, New News, Old News, p. 77.
in accentuating a long-term decline in newspaper circulation. At the same time, migration of advertisers to online search engines has left print outlets facing a double-edged assault on revenues. But the decline has also been greatly exacerbated by the fi nancial crisis, which has combined with changing consumption patterns to create the “perfect storm” for the newspaper industry.31
1.2.1.4 Local and Regional Press
Structural decline in newspaper circulation has had a disproportionate impact on the local and regional press.32 However, there is evidence to suggest that it owes as much to market consolidation as to crisis (whether
wrought by digitization or sustained economic recession). Prior to its economic woes, Trinity Mirror Group, which had fast become the largest owner of local and regional news titles in the UK, axed 300 jobs “in spite of a buoyant market.”33 Such cuts may have more to do with the commercial opportunities presented by
technological change than with the risks, as well as scale economies derived from mergers and acquisitions.
1.2.1.5 Radio News
Consumption of radio news has also experienced a decline in recent years, and this is in tandem with a slight fall in radio listening hours generally, although the number of people listening to the radio actually reached a new high in 2010.34 Th is was in part driven by the proliferation of devices, platforms, and services associated
with digital delivery (there has been a marked growth in the use of podcasts and internet radio, for instance). As with online news, the signifi cance of news delivery via radio is diffi cult to defi ne and measure. Although music and light-entertainment genres dominate listening hours, much of this is interspersed with regular news bulletin updates in accordance with license regulations. Furthermore, much of talk radio has a news and current-aff airs basis, even if it is not branded as such. Ofcom’s research into local radio in 2009 found that news was the most valued radio service among listeners, particularly among older age groups.35
1.2.2 Availability of a Diverse Range of News Sources
Clearly, the proliferation of news outlets associated with digital media development has, in one sense at least, dramatically enhanced the diversity of news services available. Th is is perhaps refl ected most signifi cantly in the growth of 24-hour and foreign news channels, which have particularly strong reach among ethnic minority audiences.36 In addition to the regulated news bulletins and analysis programs on the fi ve terrestrial
channels, digital television viewers now have access to at least two UK-based 24-hour news channels, and premium satellite and cable subscriptions come with a range of international news services.
31. R. Greenslade, “We journalists are not to blame for the decline of newspapers,” the Guardian, 3 October 2008, available at http://www.guardian. co.uk/media/greenslade/2008/oct/03/1 (accessed 20 September 2010).
32. Structural decline refers to a long-term fall in circulation related to market changes caused by factors such as technology development and owner-ship consolidation, rather than recessionary pressures.
33. R. Morrison, “Stop press: the sad decline of local newspapers,” the Times,28 February 2006, available at http://www.timesonline.co.uk/tol/ comment/columnists/richard_morrison/article735589.ece (accessed 14 September 2010).
34. Rajar, “Rajar Data Release – Quarter 2, 2010,” news release,London 2010, p. 1, available at http://www.rajar.co.uk/docs/news/data_re-lease_2010_Q2.pdf (accessed 12 September 2010).
35. Ofcom, “Ofcom deregulates commercial local radio,” news release, London 2010, available at http://media.ofcom.org.uk/2010/04/15/ofcom-deregulates-commercial-local-radio/ (accessed 4 October 2010).
A diversity of news services, however, is not necessarily matched by diversity in news content. In television news, commentators point out that proliferation has resulted, paradoxically, in homogenization of content as news broadcasters increasingly resort to herd behaviour.37 According to Alex Th omson, chief correspondent
at Channel 4 News: “It’s about the institutional insecurity of a business that’s seeing its audiences diminish because they’re fragmenting, because advertising’s fragmenting. Th is has led, in my view, to a profound lack of confi dence and, consequently, too many news programs are chasing the same stories, the same agenda, almost in the same order very often.”38
Th e point here is not about a decline in news audiences en masse but that individual broadcasters have faced the prospect of declining audiences and advertisers as a result of increased competition. Th is has led to an atmosphere of insecurity in which news broadcasters become more averse to the risks associated with original content. Th is has had a particularly acute impact on regional television news. In 2008, Ofcom approved ITV plans to reduce its public service commitment to local and regional programming, including an overall reduction in news minutage. However, it should be noted that audiences for weekday evening news shows on BBC1, ITV, Channel 4, and Five have remained relatively stable over recent years, following a steady decline throughout the 1990s and early 2000s.39 Th is suggests that the impact of multi-channel competition may
have leveled off .
Analysis of the print sector demands a similar distinction between the quantity of diff erent news services available, and the diversity of news content. Despite wholesale closure of local newspapers in recent years,40
major urban centers have actually seen a rise in the number of daily papers on off er, primarily as a result of the burgeoning “free-sheet” market. Studies of newspaper content have, however, revealed increasing homogenization associated with the declining resources available to professional journalists. Th is has seen a marked growth in recycled “second-hand” stories, as well as straightforward publication of newswire copy and press releases.41
Th e same cannot be said of online news, which does support a wealth of alternative and niche news voices. From the point of view of consumption, the internet off ers endless opportunity for news selection which may be said to enhance diversity in the sense that it enables users to tailor their news according to individual interests. In another sense, this can limit diversity by fostering a “daily me” diet of news which ensures that particular niche categories attract a progressively less diverse audience.42 However, news diversity online is
primarily associated with the rise of user-generated content (UGC), the blogosphere and social networking,
37. N. Fenton (ed.), New Media, Old News: Journalism and Democracy in the Digital Age, Sage, London, 2010 (hereafter, N. Fenton (ed.), New Media, Old News).
38. Interview with Alex Th omson, Chief Correspondent at Channel 4 News, London, 16 August 2010 (hereafter, Interview with Th omson).
39. Ofcom, Public Service Broadcasting: Annual Report 2009, London, 2009, p. 76, available at http://stakeholders.ofcom.org.uk/binaries/broadcast/ reviews-investigations/psb-review/psbrpt.pdf (accessed 14 September 2010).
40. “Newspaper closures: Stop press,” the Guardian, 25 August 2009, available at http://www.guardian.co.uk/media/2009/aug/25/local-newspaper-closures (accessed 9 October 2010).
which have fast become the most popular new-media activities in the UK.43 Such activities provide
non-traditional platforms for professional journalists, “citizen” journalists, or ordinary users. But the extent of news diversity manifested by Web 2.0 applications must be measured against the increasing online dominance of traditional, as distinct from “alternative,” providers that has resulted in an emerging oligopoly of online content aggregators such as Google, Yahoo!, AOL, and MSN. Th e fact that these sites rely almost entirely on newswire copy44 further undermines the claim that the UK is enjoying a golden age of news diversity.
1.3 News
Providers
1.3.1 Leading Sources of News
1.3.1.1 Print
Th ere has been little change in the top fi ve newspapers in the UK, which have long been dominated by tabloid and mid-market outlets. According to fi gures from the Audit Bureau of Circulations, the biggest-selling titles in 2005 were the Sun (daily circulation 3.38 million), the Daily Mail (2.41 million), the Daily Mirror (1.7 million), the Daily Express (0.95 million), and the Daily Telegraph (0.92 million). By October 2011, the top circulation titles were the Sun (2.75 million), the Daily Mail (2 million), the Daily Mirror (1.12 million), the Daily Star (0.66 million), and the Daily Telegraph (0.6 million). Th e top “quality” titles (the Times, the Independent, the Guardian, and the Daily Telegraph) experienced an average 25 percent decline in circulation over the same period, compared with an 18 percent decline for the leading tabloid/midmarket titles (the Sun, the Daily Mirror, the Daily Star, the Daily Mail, and the Daily Express).45
1.3.1.2 Online
BBC News dominates the online sector and this has remained consistent over the last fi ve years. In September 2006, it attracted just under six million unique visitors compared to two million for Guardian Unlimited, the next highest ranking site.46 Th e following three biggest sites—Yahoo!, AOL, and Google News—each attracted
between 1.5 and two million unique visitors. In December 2011, the top fi ve news sites, in descending order of traffi c, were the BBC, the Daily Mail, Sky, the Guardian, and the Telegraph.47 Th e displacement of Google
and AOL by the Daily Mail and Sky refl ects the growing presence of news organization sites (newspapers and broadcasters) over news content aggregators. Th e Daily Mail was the last of the major newspapers to establish an online publication, in 2004, and it has since achieved record traffi c growth rates. All of the top
43. KPMG, Time is Money, p. 5.
44. House of Lords Select Committee on Communications, Th e Ownership of the News. Volume II: Evidence,Th e Stationery Offi ce Limited, Nor-wich, 2008,, available at http://www.publications.parliament.uk/pa/ld200708/ldselect/ldcomuni/122/122we01.htm (accessed 9 September 2010).
45. Circulation fi gures available at http://www.abc.org.uk/.
46. Ofcom, New News, Future News, p. 34.
fi ve news sites off er their content for free. In 2010, the Times and Sunday Times websites both became a paid-for subscription service, but it is too early to assess whether this model will be sustainable and attract other leading news sites to follow suit. Th e fact that content from commercially oriented new sites remains largely free is at least partly a refl ection of the BBC’s dominant position, as well as the broader competition from non-profi t providers.
1.3.1.3 Radio
Th e UK radio map is dominated by the BBC and (mostly local) commercial providers. A community radio license was introduced in 2003 and the sector has been growing steadily but still only attracts less than 3 percent of radio listenership.48 Th e balance between BBC and commercial shares of listenership has
remained more or less stable over the past fi ve years (55 percent to 43 percent, respectively). Th e BBC carries regular news bulletins on all of its fi ve national analog channels, including fl agship programs such as Radio 4’s Today (6 to 9 a.m.). Radio 5 is dedicated to news and sport, and has maintained its share of listenership over the period.
In addition, the BBC operates over 40 local and regional stations that have maintained a stable audience over the last fi ve years, and these stations are far more news- and speech-oriented than the more music-based commercial competitors. Th at said, the three analog national commercial stations and over 300 local commercial stations are all obliged to provide regular news bulletins. Most of these are produced by Independent Radio News (IRN), which in 2007 boasted 26 million listeners.49 Content is largely provided
to commercial stations for free and funded by the sale of advertising within and on either side of the bulletin.
1.3.1.4 Television
According to Ofcom, “the UK television news industry has only three big ‘players,’ the BBC, ITN, and Sky News—although the publicly funded BBC is far bigger than the other two.”50 In September 2006, BBC1
attracted over 50 percent of news viewership. Th e next highest outlet was ITV1, with 27 percent. Sky News, the BBC News Channel, and Channel 4 each attracted between 4 and 5 percent of news viewers. Th is picture was largely unchanged in 2010. Primetime BBC news bulletins regularly attracted around fi ve million viewers compared to three million for their ITV1 counterparts.51 Although ITV is commercially funded, it is
still considered part of the UK’s PSB sector in view of its regulatory obligations to provide regular impartial news both nationally and regionally.
48. Rajar, Listening fi gures: Quarterly listening, updated quarterly, available at http://www.rajar.co.uk/listening/quarterly_listening.php (accessed 27 November 2010).
49. Ofcom, New News, Future News, p. 38. 50. Ofcom, New News, Future News, p. 27.
On the whole, television news off erings range from light-entertainment formats, such as breakfast TV, to in-depth analysis programs, such as BBC’s Newsnight. Th e advent of digital and multi-channel television has proliferated in the news landscape in a way similar to that which has long existed on analog radio and has been marked by the growth of rolling 24-hour news channels. Of these, Sky News and the BBC News Channel are by far the most watched. In 2005, Sky attracted slightly more viewers, with a 0.7 percent share of total television audience compared to 0.6 percent for the BBC News Channel.52 By 2010, however, the tide
had turned in the BBC’s favor with Sky attracting a 0.5 percent share versus the BBC’s 0.8 percent.
1.3.2 Television News Programs
As mentioned above, recent research has confi rmed that news audiences for the fi ve terrestrial broadcasters have remained relatively stable over the past fi ve years, in spite of the expanded choice heralded by digital television uptake.53 Between 2004 and 2009, the fl agship terrestrial news programs lost on average just
200,000 viewers while take-up of digital multi-channel television increased from 63 to 91 percent of households. Th e combined reach of the terrestrial news off erings is just over 50 percent compared to 16 percent for the leading 24 news channels. Th e BBC’s News at Ten (broadcast at 10 p.m.) is the most popular program, with an average audience in 2009 of 4.7 million. Its rival on ITV has added 100,000 viewers since a low point in 2007, when it averaged 2.4 million. Th e average audience for Channel 4 News in 2009 was 791,000, marking a loss of around 150,000 viewers over the preceding fi ve-year period, while the audience for Five News grew from 548,000 in 2007 to 768,000 in 2009.
1.3.3
Impact of Digital Media on Good-quality News
Digital channels are subject to the same, if not greater, economic pressure as their analog counterparts, and have largely failed to expand the range of voices, perspectives, and narratives on off er. While they are particularly well placed to cover live and breaking events, their audiences remain very small (as described above). Online and, in particular, social media do have the potential to expand the news agenda and to amplify a greater diversity of voices, but very insecure funding models and their reliance on temporary and under-resourced staff means that, as yet, this potential has yet to be fully realized.
1.4 Assessments
Overall, the fi gures suggest that PSB holds a competitive edge over multi-channel news off erings. Demographically, however, the terrestrial television news audience is ageing: 39 percent of viewers in 2005 were over 65, compared to 41 percent in 2009. Research suggests that middle-aged groups consume terrestrial television news in conjunction with a rich array of digital and traditional news sources in accordance with daily uses and gratifi cations. But younger generations are increasingly tuning out of terrestrial television
52. BARB, Multichannel Viewing Summary 1999-2009, available at http://www.barb.co.uk/report/weeklyViewingSummary?_s=4 (accessed 17 No-vember 2010).
news. Th is leaves the crucial unanswered question of whether they will return to the mainstay of PSB news as they get older or remain “lifelong rejecters.”
Consumer-attitude surveys suggest that trust and credibility are the main factors behind the endurance of PSB news. But, increasingly, consumers cite convenience and selectivity as the primary value of digital news services. Rolling news channels enable consumers to “catch up” on news at a time of their convenience. Th e growth of these services may in turn have infl uenced the broader news habits of UK consumers. Commercial radio groups maintain that their listeners prefer more regular, but less lengthy, news bulletins.
Convenience may also aff ect preferences in less visible ways. Communities may prefer a local newspaper but, if one does not exist that meets their criteria, they will turn to other outlets.54 Declining circulation of local
newspapers is therefore not by itself an indication of a fall in demand for relevant news. Indeed, a recent report by the Media Trust calls for the creation of local news hubs staff ed by both professional journalists and local community members.55 Th ey would work across media platforms and facilitate the ability to share
information and improve the quality of journalistic investigations in a sustainable fashion that could be responsive to local demands for an easily identifi able and visible center for newsgathering.
News selectivity, on the other hand, enables consumers to access news that is more interesting and relevant to them personally. Th is is particularly a function of online news, where the breadth of news services is both broader and more diff erentiated than on other digital platforms. Nevertheless, the impact of selectivity on news habits should be treated with caution. For one thing, the phenomenon of news content aggregation suggests the opposite: that online news consumers are increasingly drawn to the most popular stories. Content aggregation is not limited to “pure” providers such as Google, Yahoo!, and MSN, but is used increasingly by traditional broadcasters and newspapers in their online services.
After trust and credibility, interactivity is perhaps the third most signifi cant factor in the use of digital news. Two of Britain’s most popular news websites—Guardian.co.uk and Dailymail.co.uk—have each amassed over a million reader post contributions, and the 10 most popular topical polls hosted by Th isisLondon. co.uk—the website of London’s biggest newspaper, the Evening Standard—average 48,000 votes apiece.56
Despite these fi gures, however, news interactivity is on the whole restricted to a small minority of the digital news audience.57 Surveys suggest that most people still prefer to consume news passively on digital platforms,
although such fi ndings should be considered in the context of methodological diffi culties (primarily in determining which types of interactivity count as news).
54. Goldsmiths Leverhulme Media Research Centre, Meeting the News Needs of Local Communities, Media Trust, London, 2010 (hereafter, Gold-smiths Leverhulme Media Research Centre, News Needs of Local Communities).
55. Goldsmiths Leverhulme Media Research Centre, News Needs of Local Communities.
56. N. Th urman, “Forums for citizen journalists? Adoption of user generated content initiatives by online news media,” New Media and Society, Volume 10(1), 2008, p. 2.
Th ere can be little doubt that digital media have fundamentally changed the total news off er, expanding both the range and type of news service available (where range refers to the growing number of outlets on all platforms and associated news “brands” and type refers to the various new ways in which people can consume news, from downloading radio podcasts to inadvertent consumption through social network activity). Equally, digital media have extended the reach of news through space and time. Th e growth of mobile news access, particularly among younger age groups, suggests that news is increasingly available to people anywhere and at any time.
However, the preceding analysis suggests that these changes may not be as radical as they appear at fi rst glance. Not only has traditional PSB news on television experienced a levelling off of audience decline, but the 24-hour news supply actually contracted in 2006 with the closure of the ITV News Channel. Th ere has also been, according to some, a tendency toward homogenization of news content across television as a whole, although this is notoriously diffi cult to substantiate empirically. Taken together, these factors suggest that digital television has not necessarily heralded a radical diversifi cation of the total news off er.
Th is is even more the case in radio, where upgrade to the digital DAB platform has been protracted and slow. In any case, unlike television, DAB radio will support comparatively fewer numbers of providers than analog bands due to the multiplex licensing system and the potential it carries for new forms of gatekeeping (see section 5.1.1). Internet radio and podcasting might be growing rapidly, but they are still very much a minority activity among even digital news users. Furthermore, content on these platforms is dominated by music and comedy without the PSB obligations to carry news.
Th e internet has clearly diversifi ed news off erings in important ways, but there are also signifi cant counter trends such as content aggregation (as against news personalization)58 and the rise of traditional news
organizations online (as against the rise of social media, alternative news providers, and the blogosphere).
2. Digital Media and Public or
State-Administered
Broadcasters
2.1
Public Service and State Institutions
2.1.1 Overview of Public Service Media; News and Current Affairs Output
Th e BBC is the dominant news provider across all platforms in the UK. It generates around 120 hours of news broadcasting a day in addition to extensive online coverage. Although it is the only publicly funded broadcaster, Channel 4 is commercially funded but publicly owned, and all terrestrial television channels are considered a part of a broader public service broadcasting “compact” in view of their license regulations (non-terrestrial outlets are not subject to any public service regulation).
2.1.1.1 BBC Television News
BBC News produces regular national and regional programming across its two national terrestrial channels, and its fl agship programs reach more than 50 percent of the terrestrial television news audience (which, in turn, accounts for more than 50 percent of the total television news audience). In addition, further news programs are broadcast on the digital channels BBC3 and BBC4. Th e BBC News Channel is the most watched 24-hour news channel in the UK. It provides round-the-clock updates as well as feature programs and analysis. Coverage for the BBC Parliament channel is outsourced but the BBC provides editorial and journalistic input. Finally, news content is available on the BBC’s digital interactive television services as well as the Ceefax teletext system.
2.1.1.2 BBC Radio News
in 2009 of 188 million.59 Traditionally funded by the Foreign & Commonwealth Offi ce (FCO), the World
Service will be funded from 2014 by the domestic license fee.
2.1.1.3 BBC Online
Online has seen the largest expansion of BBC news services in recent years, and the investment has paid off in terms of audience reach: it is by far the most visited news website. It is also the only one of the top 10 online news providers that is subject to public service regulation. It has, however, been threatened with a 25 percent cut to its budget as part of the BBC’s Strategy Review.60
2.1.1.4 Editorial Controversies
In spite of—or perhaps because of—its stated and perceived commitment to impartiality, the BBC is regularly at the center of controversies concerning political bias in its news coverage, and it has long been the subject of content-analysis studies attempting to substantiate claims either way. Perhaps the most notable example of this in recent years concerned coverage of the Iraq War in 2003, where the BBC was regularly accused by both the Government and the conservative press of harboring an anti-war agenda in its coverage. Following the invasion, an extensive study by the Cardiff School of Journalism, Media and Cultural Studies found that out of the main terrestrial news broadcasters, the BBC was most likely to use the Government and military as its source and the least likely to question factual assumptions, and that there were notably fewer reports of civilian casualties compared to other PSB channels. According to Justin Lewis, the report’s author: “Far from revealing an anti-war BBC, our fi ndings tend to give credence to those who criticised t he BBC for being too sympathetic to the Government in its war coverage.”61 Th e BBC suff ered a further blow to its authority
(although not its popularity) with the publication of the Hutton Report in 2004, which criticized aspects of BBC newsgathering and led, according to some critics, to increased “timidity,” “editorial caution,” and a “BBC more prone to censorship.”62 Th e most recent license fee settlement, in 2010, in which the BBC
accepted a freeze to its license fee and a 16 percent funding cut over fi ve years, and further agreed to fund the BBC World Service from its own budget (where previously it was funded by the FCO), has led to similar claims of government interference with the independence of the UK’s main public service broadcaster. Th e cuts by themselves do not necessarily represent encroachment on independence. Th e overall picture, however, certainly seems to be one in which the BBC’s capacity to resist political pressure has been signifi cantly weakened since 2004.
59. BBC, “BBC’s international news services attract record global audience of 238 million,” news release, 2 June 2009, available at http://www.bbc. co.uk/pressoffi ce/pressreleases/stories/2009/06_june/02/audience.shtml (accessed 21 September 2010).
60. BBCStrategy Review, BBC Trust, London, March 2010, available at http://downloads.bbc.co.uk/aboutthebbc/reports/pdf/strategy_review.pdf (accessed 25 September 2010).
61. J. Lewis, “Biased broadcasting corporation,” the Guardian, 4 July 2003, available at http://www.guardian.co.uk/news/2003/jul/04/comment. 62. G. Born, Uncertain Vision: Birt, Dyke and the Reinvention of the BBC, Secker & Warburg, London, pp. 464-5 (hereafter, G. Born, Uncertain
2.1.2 Digitization and Services
Digitization has, on the whole, greatly expanded and diversifi ed the BBC’s news output. As detailed above, on television it has resulted in additional channels, programming, and new interactive service, while online it has resulted in an extensive news service that includes live streaming of radio and television broadcasts, “catch-up,” and on-demand content (partly through the BBC’s iPlayer, the most widely used TV-on-demand service). It also off ers applications for mobile news, news feeds, and news alerts.
On radio, all fi ve of the BBC’s national analog channels are simulcast both online and on DAB in addition to fi ve further specialist channels available digitally. Th ese channels are considerably more audience-targeted— for example, 1Xtra, aimed at urban-music listeners, and 6 Music, which caters for a range of alternative popular music genres. Recent proposals by the BBC management to close 6 Music and the Asian Network as part of the 2010 Strategy Review were met with widespread criticism and successful campaigns to save the stations.
What is clear is that the BBC has invested heavily in expanding both digital news output and delivery. Indeed, it has been accused, in particular by its commercial rivals, of overinvesting in these areas, an argument given weight by the relatively small audiences for its digital-only radio stations. What is less audible in public discourse surrounding BBC spending are the longstanding cuts in operational journalism which have been made partly as a means to fund digitization (see sections 4.1.1 and 8.1).
It is also worth noting that there has been a vigorous debate about future funding of the Welsh language television channel, S4C. In the context of digital switch-over and public funding cuts, some have argued that it is more diffi cult to justify the subsidizing of minority services.63 Indeed, as part of the Government’s
Comprehensive Spending Review in October 2010, the DCMS announced that S4C would have its budget cut by 25 percent over the next four years, with most of its funding to be supplied by the license fee from 2013 onwards. While saving public expenditure was the primary motivation for this cut, it is clear that arguments concerning “abundance” can be mobilized to cut services that are not easily justifi able in simple market terms.
Finally, in October 2011, the BBC announced plans to reduce its entire budget by 20 percent over the next fi ve years in order to comply with the demands of a reduced license fee settlement. Th e proposals contained in Delivering Quality First64 are set to involve the loss of some 400 jobs in local broadcasting, a reduced number
of regional television bulletins, and the sharing of some local radio programmes.65
63. M. Shipton, “Figures reveal of S4C to attract TV audiences,” the Western Mail, 10 March 2010.
64. BBC, Delivering Quality First, 2011, available at http://www.bbbc.co.uk/aboutthebbc/dqf (accessed 9 December 2011)..
2.1.3 Government
Support
Th ere has been no additional state-level support for the funding of public service digitization. Th e BBC’s funding is derived 100 percent from the license fee, paid on the use of television in the home. Furthermore, £603 million of this was ring-fenced for investment in a digital switch-over help scheme as part of an agreement in 2006 between the Government and the BBC over its Charter Renewal. Th is meant that the BBC received more favorable license-fee settlement terms in exchange for investment in and administration of the help scheme. Th ere is no evidence to suggest that this agreement had any direct eff ect on the BBC’s independence (although it did require it to assist with the delivery of one of the Government’s key public-policy objectives) or that it has won any additional legal advantages or privileged access to spectrum as a result of its investment more broadly in digitization.
Th ere has, however, been fi rm political support from the coalition government for the development of commercial television services providing local news and informational content. Th is followed the rejection by the BBC Trust in 2008 of a proposal for the BBC to off er web-based local video services owing to the perceived negative impact they might have on commercial rivals. Instead, the Shott report on the viability of local television, commissioned by the DCMS and published in December 2010,66 found that while it
would be diffi cult to sustain local television channels distributed by digital terrestrial television (DTT), “in the long-term, local TV will be well placed to exist through distribution to television sets and other devices through IPTV.”67 Th is was followed in January 2011 by the publication by the DCMS of a Local
Media Action Plan, inviting expressions of interest to operate new local television channels on DTT,68 and
subsequently by a consultation paper, A new framework for local TV in the UK, in July 2011.69 It remains to
be seen whether a series of for-profi t local television services, supported by a national advertising contract and some programming provided by the BBC, will be either fi nancially sustainable or a signifi cant factor in increasing the diversity of public service output in the UK.
2.1.4 Public Service Media and Digital Switch-over
Digital radio aside, the process of digitizing terrestrial platforms by the BBC must be viewed on balance as a success. In every aspect of digital news delivery—from the iPlayer to its 24-hour news channels—the BBC has eclipsed its commercial rivals in terms of audience reach. At the same time, it has long faced a crisis of engagement with particular audiences, notably young people and ethnic minorities. While there is some evidence to suggest that digitization is helping the BBC to reconnect with these groups, it has not yet managed to reverse this trend of disengagement.
66. N. Shott, Commercially Viable Local Television in the UK, DCMS, London, 2010 (hereafter, N. Shott, Commercially Viable Local Television). 67. N. Shott, Commercially Viable Local Television, p. 2.
68. DCMS, Local Media Action Plan, London, 19 January 2011, available at http://culture.gov.uk/images/ConDoc-Local_Media_Action_ Plan_190111.pdf (accessed 25 January 2011).
Much of the public discourse surrounding digitization and audience engagement centers on the potential to revolutionize traditional relationships between the producers and consumers of news. Th e BBC has certainly embraced user-generated content (UGC), but one recent study found that its use of audience material remains “fi rmly embedded in the longstanding routines of traditional journalism practice.”70
2.2. Public Service Provision
2.2.1 Perception of Public Service Media
Th e notion of “public service” in the context of UK broadcasting has evolved ever since the BBC’s fi rst Director-General described its remit as “to inform, educate and entertain.” Today, public service broadcasting is understood in much less missionary terms with an emphasis on catering to tastes and interests rather than shaping them. Th e BBC’s Strategy Review around the turn of the century brought audience targeting into sharp focus for news and current aff airs for the fi rst time.71 In essence, the BBC’s news mission has evolved
from one that serves “the nation and its regions” to one that serves a multiplicity of fragmenting audiences along ethnic, demographic, and socio-economic lines. While this has led to accusations of the BBC “dumbing down” its news off erings, the evidence suggests that it operates instead a news “hierarchy” in which analysis and context are increasingly restricted to fl agship broadcasts with elite and relatively small audiences.72
Nevertheless, the infl uence of audience targeting and news branding in the BBC has shifted the terms of debate over public service media. Populists and market advocates tend to focus their critique of the BBC less as a paternalistic and out-of-touch institution and more as a “bloated” monopoly that uses digitization as a cover for extending its anti-competitive reach across media.73 Such arguments formed the basis of the
BBC Trust’s rejection of a BBC management proposal to invest in new online local news services, including “hyperlocal” websites. Th e plan was perceived by many as a timely antidote to market failures, both in online news and the local and regional press.74
Critics argue that the key foundational justifi cation for the BBC’s monopoly over the license fee was spectrum scarcity, and the need for state regulation to ensure diversity and choice where the market couldn’t. With digitization, however, it is argued that this justifi cation no longer applies. In recent years, vocal opposition from the tabloid press and elsewhere has highlighted the expansion of the BBC’s management, as well as celebrity salaries, to prove its over-sized and out-of-touch mindset.
70. A. Williams, C. Wardle, and K. Wahl-Jorgensen, “‘Have Th ey Got News for Us?’ Audience revolution or business as usual at the BBC?,” Journal-ism Practice, 14 April 2010 (hereafter, A. Williams, C. Wardle, and K. Wahl-Jorgensen, “‘Have Th ey Got News for Us?’”).
71. G. Born, Uncertain Vision: Birt, Dyke and the Reinvention of the BBC, Vintage, 2005.
72. J. Harrison, Terrestrial TV News in Britain: Th e Culture of Production, Manchester University Press, Manchester, 2000.
73. See, for example, BBC, “Murdoch attack on ‘dominant’ BBC,” BBC News, 29 August 2009, available at http://news.bbc.co.uk/1/hi/8227915. stm (accessed 12 September 2010).
Th e BBC itself prefers to justify its role and funding by demonstrating “public value,”75 which it defi nes in
three respects: individual value (the value of BBC services to individual listeners and viewers), citizen value (“merit good” aspects such as contribution to a better-informed democracy and more inclusive society), and net economic value (the value of the BBC to the wider media sector). However, these are in some ways confl icting values and, faced with the pressures of its need to service multiple audiences and objectives, the BBC has found itself increasingly caught in a vice. On the one hand, demonstration of public value requires it to achieve suffi cient audience reach in order to justify its receipt of the full license fee income; on the other hand, it must continue to provide the merit goods that, in the words of a recent report by the Work Foundation, “viewers and listeners are not aware that they want or need.”76
A survey in 2006 found that the British public were willing to pay over and above the current license fee to support BBC services through to 2017,77 and this is refl ected in Ofcom’s most recent PSB review, which
found overwhelming public support for PSB and for the BBC as a “cornerstone” of the sector.78
2.2.2 Public Service Provision in Commercial Media
Public service obligations are formally applied to the three commercially funded terrestrial television broadcasters, as well as to over 300 commercial radio license-holders. Th ere is widespread variation as to the extent of these obligations, which cover such broad areas as advertising sales, news provision, regional programming, and access services for the hearing-impaired. At their heart is a commitment to providing regular news according to standards of impartiality and balance. Recent research by Ofcom suggests strong public support for public service broadcasting beyond the BBC, with nine out of 10 respondents saying they did not want the BBC to be the only public service broadcaster.79
In recent years, public service regulation of commercial broadcasters has come under pressure, most notably in respect of ITV’s commitments to regional programming. In 2008, Ofcom approved ITV’s plans to reduce its public service commitment to local and regional programming, including an overall reduction in news minutage, as well as a 50 percent cut in non-news content. Th e emphasis was placed on programming seen as “increasingly commercially unattractive, such as current aff airs, nations and regions programming, challenging drama, scripted comedy, and drama and factual programming for children … made worse by the deterioration in the advertising market.”80 Although not an explicit reference to digitization, the crisis
75. BBC, Building public value: Renewing the BBC for a digital world, BBC, London, 2004, available at http://downloads.bbc.co.uk/aboutthebbc/ policies/pdf/bpv.pdf (accessed 2 October 2010).
76. R. Collins, Public Value and the BBC, Th e Work Foundation, London, 2007, p. 62, available at http://www.theworkfoundation.com/assets/ docs/publications/174_publicvalue_bbc.pdf (accessed 15 September 2010). A “merit good” is a commodity that individuals or society need, regardless of ability to pay for it.
77. R. Fauth et al., Willingness to Pay for the BBC during the next Charter period, Th e Work Foundation, London, 14 September 2006, available at http://www.theworkfoundation.org/Assets/Docs/DCMS_willingness%20to%20pay.pdf (accessed 15 September 2010).
78. Ofcom, Ofcom’s Second Public Service Broadcasting Review: Putting Viewers First, London, 2009, p. 5 (hereafter, Ofcom, Putting Viewers First). 79. Ofcom, “Ofcom publishes its second consultation into the future of Public Service Broadcasting,” news release, 25 September 2008, available at
http://media.ofcom.org.uk/2008/09/25/ofcom-publishes-its-second-consultation-into-the-future-of-public-service-broadcasting/ (accessed 12 September 2010) (hereafter, Ofcom, news release, 25 September 2008).