ORIGINAL RESEARCH ARTICLE
AN APROACH FOR COMPUTATIONAL SIMULATION OF THE ELEMENTS
PIEZORESISTIVES OF GRAPHITE
1,2*
Renan Gabbi,
2Luiz Antônio Rasia,
2Antonio Carlos Valdiero and
3Maiara Thaís Tolfo Gabbi
1
Federal Institute of Education, Science and Technology Farroupilha,
Campus
Panambi, R. Erechim, 860 -
Planalto, Panambi - RS/Brazil, 98280-000, (55) 3376-8826,
2
Regional University of the Northwest of the State of Rio Grande do Sul, R. Pref. Rudi A. Franke, 540 - Arco-Íris,
Panambi - RS/Brazil, 98280-000
3
Federal University of Santa Maria,
Campus
Palmeira das Missões, Av. Independência, 3751 - Vista Alegre,
Palmeira das Missões - RS/Brazil, 98300-000
ARTICLE INFO ABSTRACT
This paper presents a methodology for fabrication and mathematical simulation using the finite element method of a graphite piezoresistive sensor element 2B deposited on a flexible polymer substrate using Graphite on Paper. The computational simulation aims to find the region of greatest mechanical stress of a crimped beam, when a pressure is applied on it. The steps for the simulation are the definition of the geometry, the generation of the mesh, inclusion of the physical properties of the material and execution of the simulation. The mathematical modeling of the maximum mechanical stress is described experimentally and computationally. The experimental data were compared with the computer simulation and presented a relative percentage error of 8, 9%, indicating that graphite is a good material for the development of piezoresistive sensor elements. In this work, it is verified that the piezoresistor should be positioned at 0.4591mm of beam crimping and in the center of the beam to take advantage of the maximum mechanical stress curves. The result is extremely important as it will define the best location for deposition of graphite film in future fabrications.
Copyright © 2018,Renan Gabbi et al. This is an open access article distributed under the Creative Commons Attribution License, which permits unrestricted use, distribution, and reproduction in any medium, provided the original work is properly cited.
INTRODUCTION
Piezoresistive pressure sensors based on micro electro-mechanical systems (MEMS) have many applications in the aerospace and biomedical areas. These sensors occupy a large part of the MEMS market compared to accelerometers,
biosensors, gyroscopes and temperature sensors (Meena et al.,
2017). Many of these sensors use the piezoresistive effect as a
working principle (Rasia et al., 2017).
*Corresponding author: 1,2Renan Gabbi, 1
Federal Institute of Education, Science and Technology Farroupilha,
Campus Panambi, R. Erechim, 860 - Planalto, Panambi - RS/Brazil,
98280-000, (55) 3376-8826. 2
Regional University of the Northwest of the State of Rio Grande do Sul, R. Pref. Rudi A. Franke, 540 - Arco-Íris, Panambi - RS/Brazil, 98280-00.
In this work, pencil graphite is used for the production of piezoresistors and paper as a substrate in order to obtain low cost manufacturing processes when compared to the processes used for silicon. Monocrystalline and polycrystalline silicon is a material that has been characterized by Kanda (1982) for the manufacture of piezoresistive sensor devices. Currently, there is a need to study new materials (semiconductors, polymers and metals) to replace silicon in different areas and MEMS
devices (Rasia et al., 2017). In the last decade graphite has
been attracting the attention of the international scientific community to the development of new electronic products due to the low cost, lightness, flexibility and biocompatibility
(Kanaparthi et al., 2017). These characteristics provide a good
indication for the development of piezoresistive sensor elements using graphite films deposited on flexible A4 paper type polymer substrates, known as the GoP - Graphite on Paper.
ISSN: 2230-9926
International Journal of Development Research
Vol. 08, Issue, 02, pp.19150-19155, February, 2018
Article History:
Received 19th November, 2017 Received in revised form 16th December, 2017 Accepted 23rd January, 2018 Published online 28th February, 2018
Key Words:
Sensor Element. Piezoresistivity.Graphite
On Paper. Mathematical Modeling. Finite Element Method.
Citation: Renan Gabbi, Luiz Antônio Rasia, Antonio Carlos Valdiero and Maiara Thaís Tolfo Gabbi, 2018. “An aproach for computational simulation
of the elements piezoresistives of graphite”, International Journal of Development Research, 8, (02), 19150-19155.
Graphite is composed of carbon atoms that are linked by covalent bonds. Each carbon atom is bonded to three other carbon atoms. Graphite is composed of infinite layers of
carbon atoms hybridized with sp2 bonds. In each layer, called
graphene sheet, one carbon atom is attached to three other
atoms, forming a planar array of fused hexagons (Gabbi et al.,
2015). In order to analyze the mechanical stress distribution in the piezoresistive sensor element, the computational simulation was performed with the ANSYS AIM Student 18.2
software, using the finite element method (Panzer et al., 2009)
and some steps: definition of geometry, generation of mesh, inclusion of material properties and execution of the
simulation (Gabbi et al., 2017a). The sensitivity of the material
was analyzed through the theory of small deflections (Lin et
al., 1999).
MATERIALS AND METHODS
[image:2.595.322.547.54.165.2]In this work, the geometry of the piezoresistive sensor element consists of a square region and a rectangular shaped beam, with the dimensions shown in Figure 1, where it is possible to observe the piezoresistor having dimensions, 0,005m in length, 0,001m in width and 9,61E-11 m thickness.
Figure 1. Geometry of the sensor element
Experimental Procedure
For the fabrication of the sensor elements a few steps were followed: polymer substrate sizing, GoP deposition, copper contact fixation and encapsulation, shown in Figure 2.
Figura 2. Manufacturing steps of the sensor elements
In the fabrication of the sensor elements, 2B graphite was deposited in flexible polymer, where pencil marks are directly
drawn on the substrate (Gabbi et al., 2017 b). Using the
[image:2.595.316.519.307.432.2]manufacturing steps described in Figure 2, in a clean environment, air temperature of 26º C and humidity of 59%,
Figure 3. Photograph of sensor element manufactured
the sensor elements were made. Figure 3 shows a photograph of the final result of the manufactured sensor element. The dimensions of the piezoresistor are shown in Figure 4, out of scale, where the thickness (t) is very small compared to the length (L) and width (w). The thickness of the paper was
measured with a Mitutoyo model micrometer being of the
[image:2.595.53.272.336.438.2]order of 88 μm while the other measurements of the sensor element are shown in Figure 1.
Figure 4. Geometry of piezoresistor
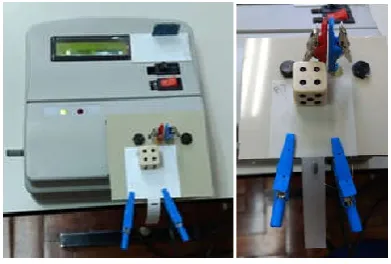
The experimental arrangement is based on the cantilever method. With the application of a mechanical effort, small "weights", with mass varying from 0.104g to 1.23g are used as shown in Figure 5. The experimental bench works also as an ohmmeter to measure piezoresistors in the Giga Ohms scale showing the results to seven decimal places and storing the results on an SD Card type memory card. The data can be used
in other software for plotting graphs (Valdiero et al., 2016).
Figure 5. The experimental bench
Computational Simulation Methodology
[image:2.595.39.287.541.710.2] [image:2.595.336.532.566.698.2]pressure is applied on it.Some steps presented in Figure 6 are fundamental for the execution of the simulation.
Figure 6. Diagram of the steps of the computational simulation
Definition of Geometry
The first step is to construct the geometry of the beam, where the dimensions of the beam are defined. In this work the piezoresistive sensor element presents the geometric form of a rectangular block, with dimensions shown in Table 1 and geometry constructed in Ansys software, Figure 7.
Table 1. Dimensions of clamped beam
Length (L) Width (w) Tickness (t) 0.045m 0.01m 0.00009m
Figure 7. Definition of the geometry of the sensor element
Generation of the Mesh
The second step of the process is the mesh generation consists of the decomposition of the total volume into smaller elements where the finite element method is applied to solve the systems of equations defining the beam.In this work the mesh is automatically generated through the mesh generator which scans and picks hexahedron elements. In case this mesh is not completely defined the generated one makes a mesh in tetrahedral format. When it is not possible to define a perfect geometric mesh, a lower quality mesh is assumed, where it is necessary to manually specify the appropriate shapes (Ansys®, 2017). Frame 1shows the mesh configuration types of Ansys AIM and Figure 8 shows the mesh generated for the clamped beam. Table 2 lists the number of elements and the number of nodes for the piezoresistive element, 15695 nodes and 2156 elements, while Firdaus (2012) presents a number of smaller nodes and a number of major elements compared to this work.
Figure 8. Simulated piezoresistive sensor element mesh
Table 2. Numbers of elements and nodes
Design Numberof Nodes NumberofElements Cantilever 15695 2156
Physical Properties
The next step is the determination of the boundary conditions of the problem, the physical properties of the material are reported, as well as the region where the pressure is applied and the crimping region shown in Figure 9.
Figure 9. Contour conditions, pressure application and beam clamped
Table 3 lists the A4 paper properties used in the manufacturing of piezoresistive sensor elements. To generate the mechanical stress adequate to the Ansys patterns (Firdaus, 2012), weights were applied at the free end of the cantilever as suggested by equation:
(1)
where, F is the applied force and A is the area.
Table 3. Properties of Flexible Polymer
Properties Value Reference Young´s Modulus 2.60 E+09 Pa (Silva et al., 2016) Poison´s ratio 0.26 (Silva et al., 2016) Density 852.27kg/m *
*It is the ratio of the weight to the thickness of the paper, 75g / m² per 0,000088 m
Table 4 presents the conversion performed of the 10 mass used during the computational simulation.
Experimental Mathematical Modeling
The geometric dimensions of the crimped beam are shown in Table 1 whose test structure, without deflection, is shown in Figure 9. The force applied on the paper film can be used to calculate strain and stress at a given point on the beam
according to the equation (Rasia et al., 2010):
whereε is the mechanical deformation, E is the elasticity, t is thickness and w is width. Equation (2) was adapted from
Geremias et al. (2015) and rewritten as:
Table 4. Conversion of the applied mass, loads, in pressure
Symbol Mass (kg) Area (m2) Pressure (Pa) 1.04E-04 8.80E-07 1.15E+03 1.42E-04 8.80E-07 1.58E+03 2.80E-04 8.80E-07 3.11E+03 3.59E-04 8.80E-07 3.99E+03 3.92E-04 8.80E-07 4.37E+03 4.09E-04 8.80E-07 4.56E+03 4.48E-04 8.80E-07 4.99E+03 6.39E-04 8.80E-07 7.12E+03 8.34E-04 8.80E-07 9.29E+03 1.23E-03 8.80E-07 1.38E+04
(3)
The maximum mechanical stress is obtained by:
(4) is maximum deflection, calculated by:
(5)
Substitutingequation (5) into (4) gives:
(6)
Simplifying equation (6) we obtain the maximum mechanical stressgive by:
(7)
The unit of measure of is N/m² = Pa.
The equivalent mechanical stress or Von Mises Stress (ANSYS
AIM Student 18.2) is calculated by the equation:
(8)
RESULTS AND DISCUSSION
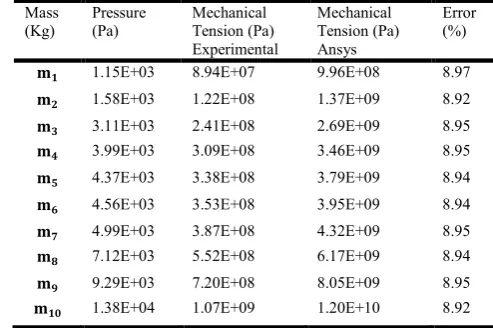
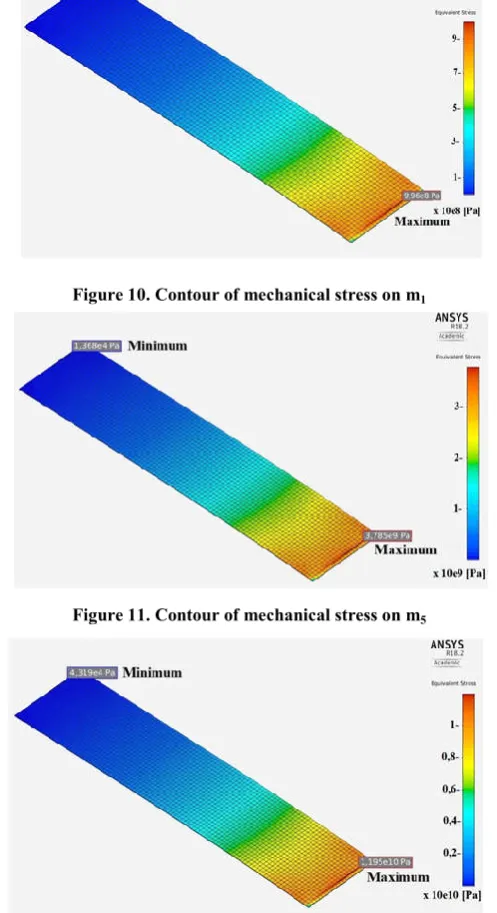
[image:4.595.306.553.611.775.2]Table 5 presents a comparison between the experimental and simulated data of maximum mechanical stress. This same table shows the relative percentage error of 8.9% between the simulated value and the experimental value. This result shows that the mechanical stress increases with the applied load increase in a practically linear shape. Figure 10 shows the maximum mechanical stress contour curves near the crimping region obtained when m1 is applied to the beam. Finally Figure 12 illustrates the point where the mechanical stress is maximum for the last mass applied in this simulation. The analysis shows that despite the difference between the mechanical stresses, the relative error range remains in the same order. Probably the improvement of the experimental arrangement gives more accurate values. The results show that the piezoresistor should be positioned at 0.4591mm from the beam crimping and in the center of the beam to take advantage of the maximum mechanical stress curves. This ensures that the piezoresistor is aligned on the beam when deposited. Figure 13 shows a difference between the values of the experimental and simulated arrangement.
Table 5. Comparison between simulated and experimental data
Mass (Kg)
Pressure (Pa)
Mechanical Tension (Pa) Experimental
Mechanical Tension (Pa) Ansys
Error (%)
1.15E+03 8.94E+07 9.96E+08 8.97 1.58E+03 1.22E+08 1.37E+09 8.92 3.11E+03 2.41E+08 2.69E+09 8.95 3.99E+03 3.09E+08 3.46E+09 8.95 4.37E+03 3.38E+08 3.79E+09 8.94 4.56E+03 3.53E+08 3.95E+09 8.94 4.99E+03 3.87E+08 4.32E+09 8.95 7.12E+03 5.52E+08 6.17E+09 8.94 9.29E+03 7.20E+08 8.05E+09 8.95 1.38E+04 1.07E+09 1.20E+10 8.92
Frame 1. Configuration of the element type
Description Consideration
Aut
o
ma
tic The “mesh generator” generates a sweep of the hexahedral shapes and provides a tetrahedral mesh when the geometry is not well defined.
No default settings are required.
Tet
ra
ed
rons The “mesher” generates a tetrahedral mesh. This geometry is preferred when it is not possible to obtain a suitable scan. Tetrahedral shapes are easier to use when geometries are more complex. In
these cases the quality of the mesh is easily generated and easily modified.
Hexaedr
ons
The “mesher” generates a hexahedral mesh.
Figure 10. Contour of mechanical stress on m1
[image:5.595.37.286.76.533.2]Figure 11. Contour of mechanical stress on m5
Figure 12. Contour of mechanical stress on m10
Figure 13. Maximum stress for piezoresistive MEMS cantilever when varying mass is applied
The behavior of the curves are linear and this difference develops with experimental procedures that need to be improved. Whencomparedwiththeresultsshown in theliterature.
Figure 14. Relation between tension and mechanical deformation
Figure 14 shows the comparison between the simulated and experimental results of tension and mechanical deformation. The curves are practically linear and show a good approximation of the results.
Conclusion
This paper describes a methodology for the computational simulation and choice of the best positioning of piezoresistive elements of graphite in regions of maximum mechanical tension. These results are important for manufacturing processes of piezoresistive effect sensing devices.
Acknowledgments
This work was supported by Institutional Program to Incentive to the Professional Qualification of the Servers of the Federal Institute Farroupilha (PIIQP) and Program Post-Graduatte in Modeling Matemathical of the University Regional the Northwest State of the Rio Grande do Sul.
REFERENCES
Ansys, 2017. Structural Analysis, Release 18.2, Help System. Mechanical APDL Structural Analysis Guide. ANSYS,
Inc., Canonsburg, PA.
Firdaus, S. M., Omar, H. and Azid, I. A. 2012. High Sensitive Piezoresistive Cantilever MEMS Based Sensor by Introducing Stress Concentration Region (SCR). Finite Element Analysis - New Trends and Developments, Dr.FarzadEbrahimi (Ed.), InTech, DOI: 10.5772/48253. Gabbi, R., Hammes, G., Scarton, L., Silva, G. G., Rasia, L. A.
and Valdiero, A. C. 2015.Modeling Graphite Films for Applications in Devices Sensors. In: 9th Congress of Science and Technology of Taquari Valley & 1st Congress of Science and Technology of COMUNG, Lajeado, RS - Brazil: Ed.Univates, v. 9. pp. 178-181.
Gabbi, R., Rasia, L. A., Pedralli, P. C., Silva, G. G., Scarton, L. and Valdiero, A. C. 2017 a Computational Simulation of a Piezoresistive Graphite Sensor Element using Finite Element Method. In: XVI Brazil MRS Meeting, 2017, Gramado. Proceedings SBPMat. Rio de Janeiro- Brazil: SBPMat, 2017. v. 1. pp. 828-828.
[image:5.595.53.273.563.730.2]XXXVI National Congress of Applied and Computational Mathematics (CNMAC 2016), held at the Center for Training and Events of FAURGS / UFRGS, Gramado-RS-Brazil, September 05 to 09; pp 010391-1 - 010391-7. DOI: http://dx.doi.org/10.5540/03.2017.005.01.0391
Geremias, M., Moreira, R. C., Rasia, L. A. and Moi A. 2015. Mathematical modeling of piezoresistive elements.In. 3rd
International Congress on Mechanical Metrology
(CIMMEC2014). Journal of Physics: Conference Series 648 (2015) 012012 doi:10.1088/1742-6596/648/1/012012. Kanaparthi, S. and Badhulika, S. 2017. Low cost, flexible and
biodegradable touch sensor fabricated by solvent-free processing of graphite on cellulose paper. In:Sensors and Actuators B 242, pp. 857-864.
Kanda, Y. 1982. A graphical representation of the piezoresistance coefficients in silicon. In: IEEE Trans. Electron Devices 29, pp. 64-70.
Lin, L., Chu, H. C. and Lu, Y. W. 1999. A Simulation Program for the Sensitivity and Linearity of Piezoresistive Pressure Sensors. In: Journal of Microelectromechanical Systems 8, pp. 514-522.
Meena,K.V., Mathew, R., Leelavathi, J. and Sankar, A. R. 2017.Performance comparison of a single element piezoresistor with a half-active Wheatstone bridge for miniaturized pressure sensors. In: Measurement 111, pp. 340-350.
Panzer, H., Hubele, J., Eid, R. and Lohmann, B. 2009. Generating a Parametric FiniteElement Model of a 3D Cantilever Timoshenko Beam Using Matlab.In: Technical Reports on Automatic Control 4, pp. 1-8.
Rasia, L.A., Leal G., Koberstein, L.L., Furlan H., Massi M., Fraga M.A. 2017. Design and Analytical Studies of a DLC Thin-Film Piezoresistive Pressure Microsensor. In: Figueroa-García J., López-Santana E., Villa-Ramírez J., Ferro-Escobar R. (eds) Applied Computer Sciences in Engineering. WEA 2017.Communications in Computer and Information Science, vol 742.Springer, Cham.
Rasia, L.A., Mansano, R.D., Damiani, L.R. et al. J Mater Sci 2010.45: 4224.https://doi.org/10.1007/s10853-010-4517-1 Silva, G. G., Scarton, L., Gabbi, R., Dutra, A. M. R., Rasia, L.
A. andValdiero, A. C. 2016. Modelagem, Caracterização e Análise dos Fatores de Sensibilidade de Elementos Piezoresistivos de Grafite.In: SODEBRÁS, v. 11, pp. 112-115.
Valdiero, C. A., Rakowiski, A. L., Rasia, L. A. and Valdiero, A. C. 2016. Platform for characterization of sensor elements.In: VI Seminar on Innovation and Technology, Hall of Knowledge, UNIJUÍ, Ijuí, RS - Brazil: Ed. Unijui, pp. 1-7.