ORIGINAL RESEARCH ARTICLE
E-GOVERNMENT ASSESSMENT
1
Roumen Trifonov,
2Radoslav Yoshinov,
3Boyan Jekov and
1Galya Pavlova
1Technical University of Sofia, Bulgaria
2Telematics Laboratory at Bulgarian Academy of Sciences, Sofia, Bulgaria
3University of Library Studies and Information Technologies, Sofia, Bulgaria
ARTICLE INFO ABSTRACT
In today’s big growth of Information and Communication Technologies and fast development of electronic world, E-Government is the basic regulatory body has been laying the legislative norms, frameworks and standards for expansion of our e-world and e-living. The user satisfaction is the driving force for e-services, e-business and e-government development. There is much debate among scholars about what constitutes e-government success, what method is best for measuring it, and which variables best describe it. The research’s goal is to show us the main indicators an factors measuring the e-governmance development and their the most efficient effect on customer satisfaction which increasingly used the offered e-services.
*Corresponding author
Copyright ©2017,Roumen Trifonov et al.This is an open access article distributed under the Creative Commons Attribution License, which permits unrestricted use, distribution, and reproduction in any medium, provided the original work is properly cited.
INTRODUCTION
Information and communication technology (ICT) has radically transformed the way individuals, organizations, and governments used to work. In the last several decades, E-governance is undoubtedly one of the most critical developments in the field of information Governance. Local, regional, and national governments around the globe have been tasked with leveraging such power to develop electronic government (e-government). E-government involves the use of information and communication technologies, particularly web-based applications to provide faster, easier and more efficient access to and delivery of information/services to the public (LeeJ., 2010). The e-Governance model takes into account four major dimensions, which we consider as necessary to describe the transformation process of State. The model offers a framework to assess the state of transformation for governments and administration. The evaluation is made on four dimensional bases: Level, Actor, Function and Technology.
User satisfaction is the basic factor in e-governance progress and the dependence between them is straight proportional. User satisfaction is a crucial factor for continual usage of Government services and for the success or failure of e-Government projects. It is a main driving factor, but far not the one. The appearance, progress and most the impact of these factors are in interests of many scientists and universities all over the world. Their Researches and Studies have led to the formation of different indicators and measurements affecting on the success and weak development of e-government process, as well as various evaluation methodologies of factors and e-government as whole. This article provides in Section 2 systematized overview of the examined by different scientists and university professors indicators and factors, which are affecting on the E-government performance. In Section 3 are presented the basic and most popular methodologies used for evaluation of the mentioned factors, indicators and indexes. Section 4 consist the most popular evaluation methodologies and assessment of services, user satisfaction and e-government.
ISSN: 2230-9926
International Journal of Development Research
Vol. 07, Issue, 09, pp.14874-14881, September,2017
Article History:
Received 28th June, 2017 Received in revised form 19th July, 2017
Accepted 20th August, 2017
Published online 30th September, 2017
Citation: Roumen Trifonov, Radoslav Yoshinov, Boyan Jekov and Galya Pavlova. 2017. “E-government assessment”, International Journal of
Development Research, 7, (09), 14874-14881.
ORIGINAL RESEARCH ARTICLE OPEN ACCESS
Keywords:
INDICATORS AFFECTING ON THE E-GOVERNAMENT PERFORMANCE
In order to define the development of process, product or even a person is necessary to supervise the working process and consequently to be defined qualities and indicators, which could be ranked in a certain scale. The indicators are quantitative measurements of qualitative performance of process, product, organization or person. Herewith we are presenting you some indicators affecting positive or negative of the micro processes determining the progress or changing of e-government process.
Usability and Credibility
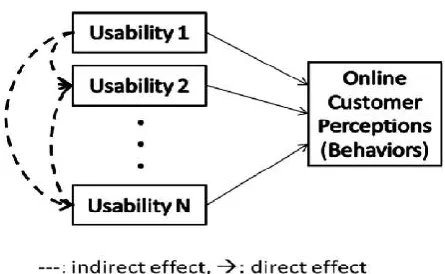
Basically, credibility refers to “judgmentsmade by a perceiver concerning the believability of a communicator” (O'KeefeD., 2002). Although credibility has many definitions, it can be argued that two fundamental factors characterize it: trustworthiness and expertise (Hilligoss, B., & Rieh, S. Y., 2008). The former is about reliability, while the latter is about the user's perception of the source of knowledge and skills (Fogg,, 2003). However, some studies use multiple criteria to describe credibility, allowing for a more comprehensive understanding. For instance (Rieh, 2002) interprets credibility as trustfulness, reliability, accuracy, authority and quality, while (Fogg,, 2002) proposes a set of ten credibility guidelines that try to capture the complexity of the concept. Several studies show that usability and credibility share some important website design attributes. Accordingly, evidence suggests that usability closely interrelates to credibility; hence an assessment that explores how usability of egovernment websites impacts their credibility (and vice versa) can provide useful insights into the development of e-government.
between the usability and customer/users perception is shown on Fig. 1
Maturity
This indicator reflects on the governments’ progression speed and openness to the new concepts. It is not exactly an indicator, but more over a result of benchmarking and it is closely related to the readiness for change of the governments.
Maturity has a direct dependence with the E-Government Openness index (eGovOI) which is going to be reviewed more precisely in Section 3. The dependence between the Maturity and eGovOI is shown in the following Equation:
F = eGovOI(new)−eGovOI(old) U (1) NoYears
where: F – Maturity (progress), N – Number of the years passed between the two adjacent benchmarks. So the amount of progress is measured like ratio between the difference of current and previous e-Government openness index and the number of years between two measured indices
Basic dataset indicator
[image:2.595.335.558.49.186.2]The basic dataset (BDS) indicator determines the presence of a predefined set of high-value open data categories. These categories can vary in different countries, but to establish a standard assessment model, it is crucial for a basic set of categories to be defined and adopted.
Figure 1. Usability and Online Customer Perceptions correlation
.
Upon analysis of open data portals around the world (Veljković, N. et all, 2011), we have singled out the nine most common data categories: Finance and Economy, Environment, Health, Energy, Education, Transportation, Infrastructure, Employment and Population. These categories are present in each analyzed portal,which emphasizes the common importance of updating and publishingsuch information. Consequently, these categories have been imposed to form our predefined basic dataset. The assessment of a BDS indicator requires the analysis of availablecategories on governments' data portals. The BDS indicator takes values from the range (0, 1). The value 0 indicates that there is no high-value dataset category present on the open data portal; the value 1 indicates that all categories are present (Veljković, N. et all, 2014).
The BDS indicator is defined according to the following formula:
BDS = n/N (2)
where “n” - number of categories that are present on the open data portal and “N” - total number of categories (N= 9).
Data Openness indicator
The data openness (DO) indicator is focused on evaluating the degree of openness of the published data and is thus comprised of eight criteria that are consistent with the Open Government Working. Group's list of eight preferable characteristics for open data (2007). Table 1 gives short descriptions of each criterion alongwith their values and a total value for the DO indicator (Veljković, N. et all, 2014). To evaluate the Data openness is necessary to choose a relevant subset of the data for each published dataset category. This happens with statistical approach which provides a reliable method for sample size determination with given restrictions, such as the confidence level andmargin of error. The Evaluation gives 5 levels of Data Openness - cradle (0-5%); basic openness (6-35%); average openness (36-75%); openness (76-90%) and high openness (˂90%).
Transparency indicator
The T indicator takes its values from the range (0, 1), where 0 stands for the lack of transparency and 1 is associated with high transparency. Here also there are 5 levels of transparency (Cradle, basic, average, transparency and high) which covers the same shares like the Data Openness, but here the transparency level consists 4 criteria – Authenticity, Understandability, Reusability and Transparency.
INDEXES OF E-GOVERNMENT DEVELOPMENT
E-Government Openness index
E-government Openness Index is an overall measure of each of the five assessment indicators and a base indicator for Maturity (Fig. 2).The evaluation process is very detailed, and it provides an in-depth analysis of not only the five principal indicators but also the indicators' key components.
The results obtained could point to the exact weak spots of the government, addressing with great precision the areas that must be improved and, thus, helping to build steady trust with the government. The eGovOImaps its values on a 0–100% scale,which reflects the current state of government openness. A total lack of openness is determined with 0%, while 100% represents full openness (Veljković, N. et all, 2014).
According to the above figure the equation of eGovOI is constructed as follow:
eGovOI=0.15*BDS+0.33*DO+0.26*T+0.13*P+0.13*C (3)
Openness index distinguishes 5 levels of openness based on the 5th indicators performance. Table 3 shows the dependencies of the indicators and the eGovOI levels
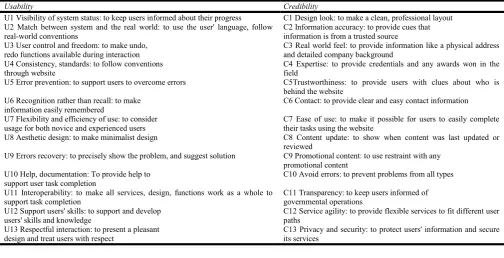
Table 1. Usability and Credibility main functions/ interpretations
Usability Credibility
U1 Visibility of system status: to keep users informed about their progress C1 Design look: to make a clean, professional layout U2 Match between system and the real world: to use the user' language, follow
real-world conventions
C2 Information accuracy: to provide cues that information is from a trusted source U3 User control and freedom: to make undo,
redo functions available during interaction
C3 Real world feel: to provide information like a physical address and detailed company background
U4 Consistency, standards: to follow conventions through website
C4 Expertise: to provide credentials and any awards won in the field
U5 Error prevention: to support users to overcome errors C5Trustworthiness: to provide users with clues about who is behind the website
U6 Recognition rather than recall: to make information easily remembered
C6 Contact: to provide clear and easy contact information
U7 Flexibility and efficiency of use: to consider usage for both novice and experienced users
C7 Ease of use: to make it possible for users to easily complete their tasks using the website
U8 Aesthetic design: to make minimalist design C8 Content update: to show when content was last updated or reviewed
U9 Errors recovery: to precisely show the problem, and suggest solution C9 Promotional content: to use restraint with any promotional content
U10 Help, documentation: To provide help to support user task completion
C10 Avoid errors: to prevent problems from all types
U11 Interoperability: to make all services, design, functions work as a whole to support task completion
C11 Transparency: to keep users informed of governmental operations
U12 Support users' skills: to support and develop users' skills and knowledge
C12 Service agility: to provide flexible services to fit different user paths
U13 Respectful interaction: to present a pleasant design and treat users with respect
[image:3.595.45.550.83.341.2]C13 Privacy and security: to protect users' information and secure its services
Table 2
Calculation of Data Openness indicator Max
Complete Description is available
0.25
Can be downloaded 0.25 Machine readable 0.25 Linked data 0.25 1
Primary Are data provided in original form and can be used for further analyses? 1
Timely Time period
0.3 Update frequency 0.4 Last update 0.3 1
Accessible Are data accessible to anyone for any purpose? 1
Machine processable PDF, XLS – 0.2 CSV – 0.5 XML, RDF – 1 1
Non–discriminatory Are data available to anyone? 1
Non–proprietary Are data available in non–proprietary formats? 1
License free Are data published under open license? 1
[image:3.595.67.530.531.593.2]DO 8/8
Table 3. Dependencies of the indicators and the eGovOI levels
Basic dataset Data openness Transparency Participation Collaboration eGovOI Openness level
0–0.2 0–0.05 0–5% 0— cradle
0.21–0.5 0.06–0.35 0–0.2 6–25% 1— basic openness
0.5–0.9 0.36–0.75 0.21–0.75 0–0.3 0–0.3 26–65% 2— average openness
˂ 0.9 0.75–0.9 0.76–0.9 0.31–0.6 0.31–0.6 66–82% 3— openness
.
Figure 2. E-Government Openness Index share’s distribution
[image:4.595.120.488.480.761.2]Figure 4 KPI and user satisfaction relationship
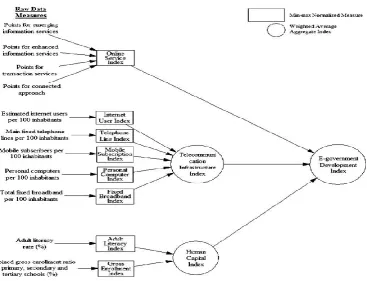
[image:5.595.109.500.352.764.2]UN E-Government Development Index
The UN E-government Development Index was constructed as TheUN research team identified a core set of measures that they assert reflect the “willingness and capacity of national administrations to use online and mobile technology in the execution of government functions” (Whitmore, A., 2012).The UN researchers collected the information from the 192 member countries and created 11 measures, called normalized indices. In order to put all measures in unified scale (0;1), as they used min-max normalization to calculate the raw data score for a specific country. The Calculation formula is presented in the equation below:
Gross enrollment Index (country x) = (Gross enrollment Score (country x) – minimum Gross enrollment Score (all countries)) / (maximum Gross enrollment Score (all countries) – minimum Gross enrollment Score (all countries)) (4)
All the 11th indicators are divided into three groups of Aggregate indexes – Human Capital Index, Online Service Index and Telecommunication Infrastructure Index. Their values are extracted of the weighted average of its normalized sub-indexes. Human Capital Index consist two sub-indexes: 1) Adult Literacy Index and 2) Gross enrollment Index. Telecommunication Infrastructure Index is created by five indicators: 1) Internet User Index; 2) Telephone Line index; 3) Mobile Subscription Index; 4) Personal Computer Index and 5) Fixed Broadband Index. Online Service Index has four categories of indication: 1) Emerging Information Services; 2) Enhanced Information Services; 3) Transaction Services and 4) Connected Approach.
The three aggregate indices are measured according to the following equations:
Human Capital Index = 2/3(Adult Literacy Index)+ 1/3(Gross Enrollment Index) (5)
Telecommunication Infrastructure Index = 1/5(Personal Computer Index) +1/5(Internet User Index)+ 1/5(Telephone Line Index) + 1/5(Mobile Subscription Index) + 1/5(Fixed Broadband Index) (6)
Online Service Index(country x)=(Σpoints f or each category(country x)–MINΣpoints f or each category (all countries)) / (MAXΣpoints for each category(all countries) –
MINΣpoints f or each category(all countries)) (7)
At last the values of the three aggregate weighted Indexes are taken for the calculation of the European Development Index which is defined by the following formula:
E-Government Development Index = 0.34(Online Service Index) + 0.33(Telecommunication Infrastructure Index) + 0.33 (Human Capital Index) (8)
All the Indicators and Indexes show some quantitatively impact of the e-government progress, but without the methodology of evaluation is not possible to see the whole picture and to assess if the progress is positive or negative. In the next session we are going to examine three different methodologies which are helping us to understand the important indicators and their assessment so that we can make
our own conclusions whether the motion of a certain e-government takes positive, negative or no directions.
METHODOLOGIES OF MEASURING AND ASSESSMENT
COBRA
The latest researched methodology for evaluation of customers’ satisfaction (the most influential factor for e-government development) is called COBRA – Cost, Opportunity, Benefit, Risk Analysis. The Methodology is based on four key performance indicators – cost, benefit, risk and opportunity. The relationship between the four KPIs and user satisfaction, which is the best measurement for the provided e-services in an e-government, is shown on Fig. 4. The Co-relation between benefit and opportunity has an expected positive impact to customer satisfaction, whereas the cost and risk are with negative expectations to the users’ satisfaction. There are three analyses which are examining benefit-opportunity and cost-risk connections.
Social Exchange Theory (SET) – The theory was proposed by Blau (1964) to explain the social relationships by using an economy concept of cost and value (benefit). Refracted through the prism of e-services the SET theory will look like as follow: the cost and risk would represent the user's inputs when using an e-service interaction, whereas the benefit and opportunity would represent the value of such interaction. By analogy, if the benefit and opportunity values are greater than the cost and risk values, then an e-service user would be more satisfied and more likely to continue using such e-service; otherwise the user will not re-use (Osman, I. H. et all., 2014).
Expectation – Confirmation Theory (ECT) - ECT was proposed by Oliver (1980) to study consumer satisfaction, repurchase intention and behaviour. Based on this theory, consumers compare their initial expectation prior to purchase with the actual performance after a period of initial consumption. Accordingly, the consumers are satisfied if their initial expectation matches the actual perceived performance. In an e-service context, users have an initial expectation about cost, benefit, risk and opportunity, and if they find evidence that the actual e-service fulfils their expectation, then users' satisfaction level will be high and they will probably re-use the service (Osman, I. H. et al., 2014).
SWOT Theory – the SWOT analysis was developed to evaluate companies’ services or product comparing to the competitors. The theory considers both internal (Strengths and weaknesses) and external (Opportunity and threats) factors for companies’ behavior. In COBRA vision the theory is represented like internal factors (Cost and Benefit) and external (risk and opportunity). Users tend to use e-services if the obtained benefits and opportunities from using online service are higher than those from traditional government services.
MUSA
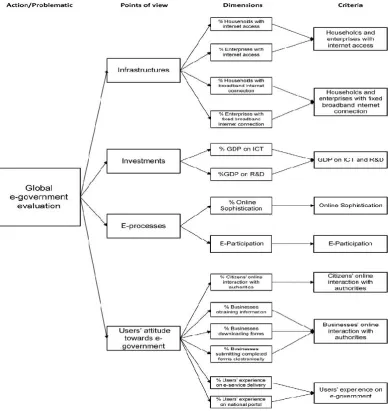
analysis, adopting the principles of analytic-synthetic approach and the theory of value systems or utility (Grigoroudis, E. and Y. Siskos, 2002). E-government evaluation is divided in a number of points of view: 1) infrastructures, 2) investments, 3)e-processes, and 4) users’ attitude towards e-processes that frame all the problem’s evaluation parameters. These parameters, namely dimensions, are then grouped and sub-aggregated to model the final eight evaluation criteria illustrated in Fig. 5.
Access to the web - This criterion expresses the percentage of households and enterprises that have access to the web by any means.
Broadband Internet connection - It shows the percentage of each country’s households and enterprises witha fixed broadband Internet connection.
Gross domestic product (GDP) on information & communications technology (ICT) and research & development (R&D). This criterion indicates the percentage of each country’s GDP invested on ICT and R&D.
Online sophistication – Online sophistication shows each country’s maturity on online service delivery.
e-participation – This criterion expresses the interaction achieved between governments and citizens regarding information sharing, e- consultation and e-decision making.
Citizens’ online interaction with authorities – This criterion indicates the percentage of citizens that are already using the web to interact with authorities.
Businesses’ online interaction with authorities – This criterion indicates the percentage of businesses using the web to interact with authorities.
Users’ experience – This criterion expresses citizens’ experience over 20 e-services and the national portal (Siskos, E.N. et all, 2014).
The MUSA method follows the general principles of ordinal regression analysis under restrictions, using linear programming techniques to solve. The basic ordinal regression equation is:
∗= ∑
ᵢ ᵢ ∗
(9)∑
ᵢ=1
where n is the number of criteria and bi is the weight of the i criterion.
The value functions are normalized in the internal y*¹=0, y*ᵃ=100
x*¹=0, x*ᵃᵢ=100 for i=1,2,...,n
The model has the objective to achieve the maximum possible consistency between the Y and preferences in estimating Y*, which is also the collective satisfaction function. To minimize possible deviations introduced for each customer j a double error variable. Thus the equation (10) takes the form:
∗= ∑
ᵢ ᵢ ∗ − ⁺ + ⁻
(10)where
∗ is the estimation of the global value function
Y* ,and
⁺ and
⁻ are the overestimation and the underestimation
error, respectively (Bournaris T.et all, 2013).
Conclusion
The e-government evaluation process is an independent procedure enabling each individual to specify her/his own preferences on criteria value functions and weights, and results in a personalized country ranking . Reviewed in the research indicators allow to combine them in a way convenient for the needs of specific futures studies or ranking, as the combination could be done either between the different indicators or between the indicators and indexes. Both Methodologies can be easily implemented on different data which means that an e-government assessment can be scheduled every time that new data on the criteria appears. Presented in this article evaluation methods together with all the e-government indicators and indices are a good base for future science researches in direction of inventing and developing new methods for definition of E-government progress and finding more appropriate and precise indexes for ranking.
REFERENCES
Blau, P. M. 1964. Exchange and power in social life. NY: John Wiley & Sons.
Bournaris T., Manos, B., Moulogianni C., Kiomourtzi, F. & Tandini M. 2013. Measuring Users Satisfaction of an e-Government portal. 6th International Conference on
Information and Communication Technologies in
Agriculture, Food and Environment, (pp. 371-377). Fogg, B. J. 2002. Stanford guidelines for web credibility, a
research summary from the Stanford persuasive technology lab. Retrieved from Stanford University : www.webcredibility.org/guidelines)
Fogg, B. J. 2002. Stanford guidelines for web credibility, a research summary from the Stanford persuasive
technology lab. Stanford University.
www.webcredibility.org/guidelines
Fogg, B. J. 2003. Persuasive technology using computers to change what we think and do. Morgan Kaufmann Publisher.
Grigoroudis, E. and Y. Siskos. (2002). Preference disaggregation for measuring and analysing customer satisfaction: The MUSA method. European Journal of Operational Research, 143(1), 148-170.
Hilligoss, B., & Rieh, S. Y. 2008. Developing a unifying framework of credibility assessment:Construct, heuristics, and interaction in context. , ),. Information Processing andManagement, 44(4, 1467–1484.
Lee, J. 2010. 10 year retrospect on stage models of e-government: A qualitative metasynthesis. Government Information Quarterly, 27(3), 220–230.
O'Keefe, D. J. (2002, June 20). Persuasion theory and research (2nd ed.). SAGE Publications. Retrieved 2013, http://www.sagepub.com/books/Book11299?prodId=Book 11299
Oliver R. L. 1980. A Cognitive Model of the Antecedents and Consequences of Satisfaction Decisions . Journal of Marketing Research, 17(4), 460-469.
Osman, I. H., Anouz, A. L., Iran, Z., Al-Ayoubi, B., Lee, H., Balcı, A., Medeni, T. D., & Weerakkody, V. (2014). COBRA framework to evaluate e-government services: A citizen-centric perspective. Government Information Quarterly, 31 (2), 243–256.
Society for Information Science and Technology, 53(2), 145–161.
Siskos, E., Askounis, D. & Psarras, J. 2014. Siskos, E., Askounis, D. & Psarras, J. Multicriteria decision support for global e-government evaluation, :pp. Omega, 46, 51-63.
Veljković, N., Bogdanović-Dinić S., Stoimenov, L. 2014. Benchmarking open government: An open data perspective. University of Niš, Faculty of Electronic Engineering, (pp. 278-290). Niš,Serbia.
Veljković, N., Bogdanović-Dinić, S., & Stoimenov, L. 2011. eGovernment openness index. 11th European Conference on eGovernment. Ljubljana: University of Ljubljana. Whitmore, A. 2012. A statistical analysis of the construction
of the United Nations E-Government Development Index. Graduate School of Library and Information Science, Simmons College, USA.