Identification and Characterization of
Clostridium difficile
Sequence Type 37 Genotype by Matrix-Assisted Laser
Desorption Ionization–Time of Flight Mass Spectrometry
Ruxin Li,
a*
Di Xiao,
bJing Yang,
aSuju Sun,
cSamuel Kaplan,
hZhirong Li,
aYanan Niu,
aCuixin Qiang,
aYu Zhai,
aXiaoming Wang,
aXingzhen Zhao,
aBaoxin Zhao,
aMartin Welker,
dDavid H. Pincus,
eDazhi Jin,
fMini Kamboj,
hGuanghui Zheng,
gGuojun Zhang,
gJianzhong Zhang,
bYi-Wei Tang,
h,iJianhong Zhao
aaDepartment of Clinical Microbiology, Second Hospital of Hebei Medical University, Hebei Provincial Center for Clinical Laboratories, Shijiazhuang, Hebei, China
bState Key Laboratory of Infectious Disease Prevention and Control, Collaborative Innovation Center for Diagnosis and Treatment of Infectious Diseases, National Institute for Communicable Disease Control and Prevention, Chinese Center for Disease Control and Prevention, Beijing, China
cPublic Health College of Hebei Medical University, Shijiazhuang, Hebei, China dbioMérieux SA, Marcy-l'Étoile, France
ebioMérieux, Inc., Hazelwood, Missouri, USA
fDepartment of Microbiology, Zhejiang Provincial Center for Disease Control and Prevention, Hangzhou, Zhejiang, China
gDepartment of Clinical Laboratory, Beijing Tiantan Hospital, Capital Medical University, Beijing, China hDepartment of Laboratory Medicine, Memorial Sloan Kettering Cancer Center, New York, New York, USA iDepartment of Pathology and Laboratory Medicine, Weill Medical College of Cornell University, New York,
New York, USA
ABSTRACT
Clostridium difficile
multilocus sequence type 37 (ST37), which mainly
corresponds to ribotype 017, has been a dominant genotype circulating in China. In
this study, we report the use of matrix-assisted laser desorption ionization–time of
flight mass spectrometry (MALDI-TOF MS) to analyze and characterize 204
C. difficile
clinical isolates, including 49 ST37 and 155 non-ST37 isolates collected in China and
other countries. The distributions of two major protein peaks (
m/z
3,242 and 3,286)
were significantly different between ST37 and non-ST37 prototype strains and
clini-cal isolates. This difference was reproducible when analysis was performed on
differ-ent colonies in differdiffer-ent runs. This finding was repeated and confirmed by both
bio-Mérieux Vitek MS and Bruker Microflex LT systems on isolates recovered from a
variety of geographic regions worldwide. The combination of the two peaks was
present in 47 of 49 ST37 isolates, resulting in a sensitivity of 95.9%. In contrast, the
peak combination was absent in 153 of 155 non-ST37 isolates, resulting in a
specific-ity of 98.7%. Our results suggest that MALDI-TOF MS is a rapid and reliable tool to
identify
C. difficile
genotype ST37. Work is in progress to characterize the two
mole-cules having peaks at
m/z
3,242 and 3,286, which appear to be specific to
C. difficile
genotype ST37.
KEYWORDS
Clostridium difficile
, genotype ST37, MALDI-TOF MS,
m/z
3,242,
m/z
3,286
C
lostridium difficile
is a Gram-positive, anaerobic, spore-forming bacillus that is a
major pathogenic bacterium in health care-associated diarrhea in developed
coun-tries (1, 2). Clinical symptoms associated with
C. difficile
infection (CDI) range from mild
diarrhea to life-threatening pseudomembranous colitis (PMC) (3). Two toxins, toxin A
(TcdA) and toxin B (TcdB), are primarily responsible for the pathogenicity of
C. difficile
(4, 5). In recent years, a toxin A-negative, toxin B-positive (A
⫺B
⫹)
C. difficile
variant,
Received19 December 2017Returned for
modification16 January 2018 Accepted15
February 2018
Accepted manuscript posted online21
February 2018
CitationLi R, Xiao D, Yang J, Sun S, Kaplan S, Li
Z, Niu Y, Qiang C, Zhai Y, Wang X, Zhao X, Zhao B, Welker M, Pincus DH, Jin D, Kamboj M, Zheng G, Zhang G, Zhang J, Tang Y-W, Zhao J. 2018. Identification and characterization of
Clostridium difficilesequence type 37 genotype
by matrix-assisted laser desorption ionization–
time of flight mass spectrometry. J Clin
Microbiol 56:e01990-17.https://doi.org/10
.1128/JCM.01990-17.
EditorRobin Patel, Mayo Clinic
Copyright© 2018 American Society for
Microbiology.All Rights Reserved.
Address correspondence to Yi-Wei Tang, [email protected], or Jianhong Zhao, [email protected].
*Present address: Ruxin Li, Department of
Laboratory Medicine, Hebei Provincial Hospital of Traditional Chinese Medicine, Shijiazhuang, Hebei, China.
crossm
on May 16, 2020 by guest
http://jcm.asm.org/
mainly belonging to sequence type 37 (ST37) by multilocus sequence type (MLST)
analysis and ribotype 017 by PCR-ribotyping, has been widely distributed in China and
other countries (6, 7). Previous work (8–10) has demonstrated that ST37
C. difficile
is the
dominant strain in adult patients with CDI, albeit with limited prevalence data for
colonization in healthy individuals. ST37 isolates have been associated with increased
resistance to multiple antibiotics, including fluoroquinolones, macrolides, and
lincomy-cin (11, 12). Severe clinical symptoms, as well as outbreaks in hospitals, have been
reported for these A
⫺B
⫹C. difficile
isolates, suggesting that this strain is a major public
health problem (13–15). Thus, identification for ST37 strains of
C. difficile
by a rapid and
accurate method is of great clinical significance for the prevention and control of CDI.
Various molecular typing methods, including PCR-ribotyping, multilocus sequence
type (MLST) analysis, and pulsed-field gel electrophoresis (PFGE) typing, have been
widely used for genotyping and characterization of
C. difficile
isolates. Unfortunately,
these methods are time-consuming, relatively costly, and complex, making them
difficult for routine clinical use (16). Matrix-assisted laser desorption ionization–time of
flight mass spectrometry (MALDI-TOF MS) has been widely applied in clinical
microbi-ology laboratories for identification of pathogenic bacteria (17–19). Rapid identification
of microbes at species level is achieved by comparing protein fingerprint spectra, which
are comprised of molecules ranging from
m/z
2,000 to 20,000, with the established
strain reference databases (20, 21). MALDI-TOF MS technology thus provides a rapid,
accurate tool for identification of microbial pathogens (22, 23). In addition, differences
between protein spectra determined by MALDI-TOF MS have been evaluated as a
method for bacterial typing by identifying type-specific protein peaks in mass spectra
that can be used as biomarkers to identify particular genotypes or subtypes (24, 25).
This technology has also been reported to be useful for the identification of unique
C.
difficile
genotypes, such as ribotype 001, 027, and 078/126 (26). The aim of this study
was to identify and characterize potential MALDI-TOF MS biomarkers for rapid
identi-fication and characterization of
C. difficile
ST37 strains.
(This study was presented in part at the 10
thWorld Congress of the World Society
for Pediatric Infectious Diseases, Shenzhen, China, 2 to 5 December 2017.)
MATERIALS AND METHODS
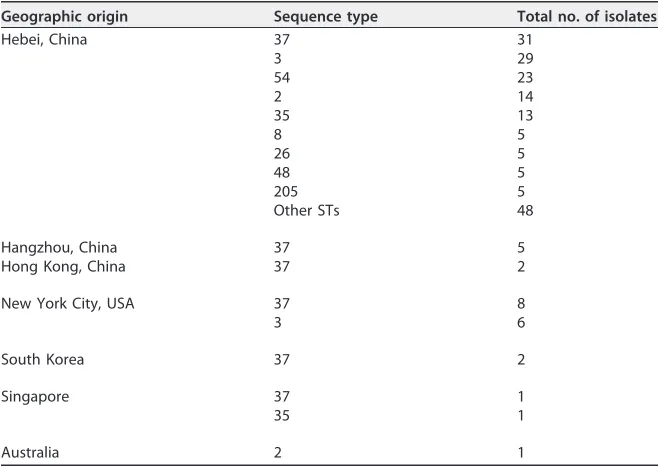
C. difficilestrains and clinical isolates.C. difficileprototype strains, including ATCC BAA-1870 (ST1), 9689 (ST3), 43598 (ST37), 43255 (ST46), BAA-1812 (ST53), BAA-1382 (ST54) and BAA-1804 (ST63), were obtained from the American Type Culture Collection (Manassas, VA). A total of 204C. difficileisolates were recovered from fecal specimens of patients with diarrhea or from healthy donors in China and other countries as previously described (8, 10, 27) (Table 1). All prototype strains and isolates were stored at ⫺70°C in brain heart infusion broth with 10% glycerol until subsequent analyses. For subsequent experiments, all strains and clinical isolates were retrieved on Columbia blood agar (CBA; Oxoid, Cambridge, UK) plates and incubated at 37°C for 48 h under anaerobic conditions. A single bacterial colony with typical morphology was subcultured again on CBA plates and incubated under the same conditions for 48 h.
DNA extraction, toxin gene analysis, and MLST analysis.DNA was extracted from a single isolated colony using a TIANamp bacteria DNA kit (Tiangen Biotech, Beijing, China) according to the manufac-turer’s instructions. DNA samples were stored at⫺20°C until use. Toxin genestcdA andtcdBwere tested as described by Lemee et al. (28). MLST analysis was performed as previously described (16). In brief, fragments from seven genes (adk,atpA,dxr,glyA,recA,sodA, andtpi) were amplified and sequenced at Sangon Biotech (Shanghai, China) and analyzed at the Beijing Genomics Institute (Beijing, China). The DNA sequences of the seven genes were submitted to the MLST database (https://pubmlst.org/cdifficile/) to obtain the ST genotype.
MALDI-TOF sample preparation. An ethanol/formic acid method was used for extraction of bacterial proteins, in which one-half to one 10-l inoculation loop of fresh bacterial culture was thoroughly suspended in 300l of molecular-grade water and 900l ethanol was added. The compo-nents were mixed well and centrifuged at 13,000⫻gfor 2 min. After centrifugation, the supernatant was removed, and the pellets were air dried. Then, 20l of formic acid (70% in water) was added to the pellets and mixed. Finally, 20l of acetonitrile was added and mixed thoroughly. After centrifugation at 13,000⫻gfor 2 min, the supernatant containing the bacterial protein extract was transferred to a clean tube.
MALDI-TOF MS data acquisition. The spectra were collected using two mass spectrometry systems, the bioMérieux Vitek MS and the Bruker Microflex LT. For analysis with the bioMérieux Vitek MS, 1l bacterial protein extract was transferred to a Vitek MS disposable slide (bioMérieux SA, Marcy-l’Étoile, France) and allowed to dry before overlaying with 1 l of a saturated solution of
on May 16, 2020 by guest
http://jcm.asm.org/
␣-cyano-4-hydroxycinnamic acid (␣-CHCA) in 28% acetonitrile (CHCA matrix; bioMérieux SA) and dried in ambient air. Four spots were prepared for each sample. The Vitek MS MALDI-TOF MS was equipped with an N2laser (⫽337 nm). Spectra were collected in linear SARAMIS RUO mode, in the range ofm/z2,000 tom/z20,000. The software used for data acquisition was LaunchPad (version 2.8; bioMérieux). Spectra were acquired in automatic mode by accumulating 100 profiles. Spectral data were automatically processed and exported as peak lists for analysis in SARAMIS.Escherichia colistrain ATCC 8739 was used for mass calibration instrument parameter optimization. For analysis with the Bruker Microflex LT, 1l bacterial protein extract was transferred to an MSP 96 ground steel sample target (Bruker Daltonik, Bremen, Germany) and allowed to dry at room temperature. Subsequently, the sample was overlaid with 1l of matrix (a saturated solution of␣-cyano-4-hydroxycinnamic acid in 50% acetonitrile and 2.5% trifluoroacetic acid) and dried in ambient air. Twelve spots were prepared for each sample. The Microflex LT MALDI-TOF MS system was equipped with a 337-nm N2laser. The molecular ions were measured in the linear positive-ion mode. The software used for the data acquisition was flexControl (version 3.0; Bruker Daltonik) software. The parameters used were as follows: mass range, 2,000 to 20,000 Da; ion source 1, 20 kV; ion source 2, 18.5 kV; lens, 8.45 kV; pulsed ion extraction, 320 ns; laser frequency, 20.0 Hz. A Bruker bacterial test standard (BTS255343; Bruker Daltonik) was used for mass calibration instru-ment parameter optimization. A peak was considered to be present when it was detected by the automated spectrum processing performed by the respective software programs.
Data analysis.Data were analyzed using Statistical Package for Social Sciences (SPSS; Chicago, IL) version 21.0. As all peak values were nonnormally distributed, the Mann-Whitney U test was used to analyze correlations between peak values and STs.Pvalues were calculated to assess the differences between spectra of ST37 and non-ST37 isolates, and aPvalue ofⱕ0.05 was considered statistically significant.
RESULTS
A total of 211
C. difficile
isolates/strains, including seven ATCC reference strains and
204 clinical isolates, were included in the study. Among the 204 clinical isolates, 178
(87.3%), 5 (2.5%), 2 (1.0%), 2 (1.0%), 2 (1.0%), 1 (0.5%), and 14 (6.9%) were collected from
Hebei, Hangzhou, Hong Kong, Singapore, South Korea, Australia, and New York City,
respectively (Table 1).
[image:3.585.41.370.82.315.2]We first compared
C. difficile
whole-cell mass spectra for ST37 and non-ST37
genotypes, using ATCC reference strains and several additional clinical isolates (Fig. 1).
The mass spectra were acquired in the mass range of
m/z
2,000 to 20,000.
Approxi-mately 80 peaks were detected per spectrum, with the highest peaks concentrated in
the range of
m/z
3,000 to 10,000. Based on the data analysis, two protein peaks (
m/z
3,242 and 3,286) were identified as correlated with genotype ST37. Peak
m/z
3,286 was
present in the spectra of ST37 isolates and absent in those of non-ST37 isolates; peak
m/z
3,242 of ST37 isolate spectra had significantly higher intensity values compared
TABLE 1Sources and sequence types of clinical isolates recruited in this studyGeographic origin Sequence type Total no. of isolates
Hebei, China 37 31
3 29
54 23
2 14
35 13
8 5
26 5
48 5
205 5
Other STs 48
Hangzhou, China 37 5
Hong Kong, China 37 2
New York City, USA 37 8
3 6
South Korea 37 2
Singapore 37 1
35 1
Australia 2 1
on May 16, 2020 by guest
http://jcm.asm.org/
with those of non-ST37 isolates (Fig. 2B). This observation was repeated and confirmed
using both bioMérieux Vitek MS and Bruker Microflex LT systems.
We then assessed the reproducibility of our observations for an additional three
ST37 and three non-ST37 isolates. Values of
m/z
3,370 (ST37-nonspecific) and 3,242 and
3,286 (ST37-specific) were included for intra- and interexperimental variability analysis.
Each of the six isolates was run either four or nine times in three experiments run on
different days by three experimental operators. High intraexperimental coefficient of
variation (CV) values were revealed for both ST37 (117 to 209%) and non-ST37 isolates
(Table 2), while relatively low interexperimental CV values were noticed for both ST37
(51% for
m/z
3,242, 44% for
m/z
3,286, and 64% for
m/z
3,370) and non-ST37 isolates
(58% for
m/z
3,242, 173% for
m/z
3,286, and 48% for
m/z
3,370). As presented in Table
2, in all three experiments, all three ST37 isolates possessed significantly higher
intensity values at
m/z
3,242 (
P
⬍
0.001) and at
m/z
3,286 (
P
⬍
0.001) than non-ST37
isolates. In contrast, there was no statistical difference between ST37 and non-ST37
isolates in
m/z
3,370 peak values (
P
⬎
0.05).
A total of 204
C. difficile
clinical isolates collected from different geographic regions
in China and other countries was analyzed for
tcdA
and
tcdB
patterns (Table 3). In
addition to ST37, these isolates included 35 ST3, 24 ST54, 15 ST2, 14 ST35, 5 ST8, 5 ST26,
5 ST48, and 5 ST205 genotypes, as well as 34 other rare ST genotypes. For the 49 ST37
isolates, the sole
tcdA
or
tcdB
pattern was A
⫺B
⫹. However, the 155 non-ST37 isolates
were comprised of 124 (80.0%) A
⫹B
⫹, 1 (0.6%) A
⫺B
⫹, and 30 (19.4%) A
⫺B
⫺. Notably,
the only A
⫺B
⫹variant found to be a non-ST37 isolate was an ST81 genotype, which was
recovered in Hebei, China (Table 3).
FIG 1Exemplary whole-cell mass spectra ofC. difficilestrains and isolates of ST37 (ATCC 43598, CD013, CD015, CD017, CD026, and CD126; red lines) and non-ST37 (ATCC BAA-1382, ATCC BAA-1804, ATCC BAA-1870, ATCC BAA-1812, CD105 (ST3), and CD151 (ST2); blue lines). The lower panel (b) shows an enlarged section of the full upper spectra (a).
on May 16, 2020 by guest
http://jcm.asm.org/
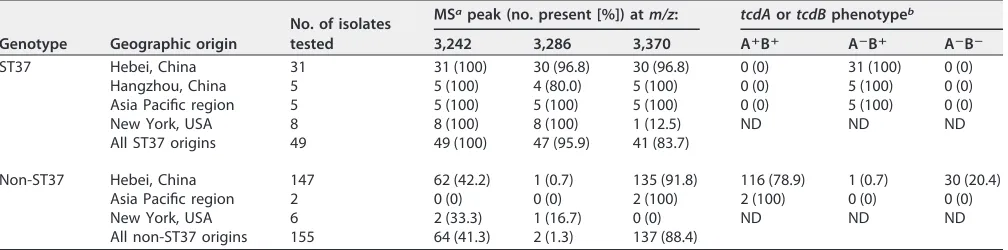
[image:4.585.66.342.67.398.2]The presence and absence of the
m/z
3,242 and 3,286 peaks were then analyzed in
the 204 clinical isolates using the
C. difficile
-universal
m/z
3,370 peak as the control
(Table 3). The
m/z
3,370 peak was detected in majority of isolates tested. Among the 49
ST37 isolates, all but two isolates possessed both
m/z
3,242 and 3,286 peaks. In contrast,
among the 155 non-ST37 isolates, the combination of peaks
m/z
3,242 and 3,286 was
only detected in two isolates, namely, one ST81 isolate from Hebei and one ST3 isolate
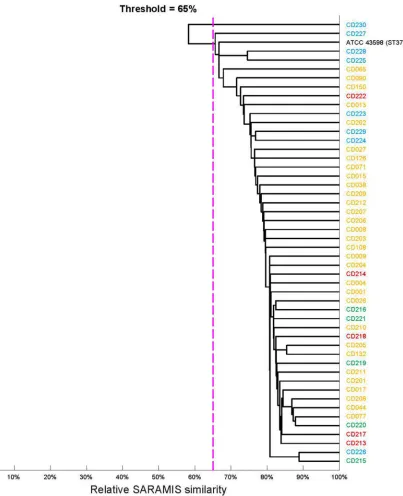
from New York. A cluster analysis based on full spectra of ST37 isolates revealed no
significant difference in spectra of strains from different geographic origins (Fig. 2). The
differing distributions of
m/z
3,242 and 3,286 peaks between ST37 and non-ST37 isolates
FIG 2Cluster analysis of spectra of 49 ST37 isolates of different geographic origins. The dendrogram was computed in SARAMIS with a single-linkage agglomerative algorithm-based relative spectrum similarity (percentage of matching peaks within a tolerance of 0.08%). The dotted purple line indicates 65% similarity, which is generally the threshold for intraspecies similarity. Yellow, Hebei; green, Hangzhou; blue, New York; black, ATCC 43598.
on May 16, 2020 by guest
http://jcm.asm.org/
[image:5.585.68.471.70.566.2]TABLE 2 Experimental variability of peak height values in spectra of ST37 and non-ST37 isolates a Expt m/z Mean peak ht value (integrated in thousands) ⴞ SD for following isolate of ST37 genotype: Mean ⴞ SD CV (%) Mean peak ht value (integrated in thousands) ⴞ SD for following isolate of non-ST37 genotype: Mean ⴞ SD CV (%)
ST37/ non-ST37 ratio Mann- Whitney U P CD001 CD038 CD090 CD003 CD045 CD086 1 3,242 1,219 ⫾ 1,035 5,881 ⫾ 5,483 1,516 ⫾ 1,722 2,871 ⫾ 3,899 136 25 ⫾ 49 15 ⫾ 26 8 ⫾ 14 16 ⫾ 32 200 179 51 ⬍ 0.001 3,286 6,325 ⫾ 6,151 19,169 ⫾ 16,845 5,854 ⫾ 6,131 10,449 ⫾ 12,249 117 452 ⫾ 861 0 0 151 ⫾ 525 348 69 17 ⬍ 0.001 3,370 14 ⫾ 36 142 ⫾ 203 280 ⫾ 293 145 ⫾ 227 157 5 ⫾ 97 0 ⫾ 99 41 ⫾ 64 31 ⫾ 56 181 5 296 0.193 2 3,242 941 ⫾ 1,177 1,370 ⫾ 3,142 832 ⫾ 800 1,048 ⫾ 1,928 184 11 ⫾ 10 5 ⫾ 77 ⫾ 14 8 ⫾ 11 138 131 16 ⬍ 0.001 3,286 4,076 ⫾ 5,084 5,082 ⫾ 10,544 3,548 ⫾ 3,215 4,236 ⫾ 6,765 160 0 0 0 0 NA NA ⬍ 0.001 ⬍ 0.001 3,370 54 ⫾ 86 10 ⫾ 19 20 ⫾ 31 31 ⫾ 56 181 9 ⫾ 12 4 ⫾ 72 9 ⫾ 28 13 ⫾ 20 154 2 287 0.305 3 3,242 659 ⫾ 693 9,448 ⫾ 1,076 204 ⫾ 144 3,437 ⫾ 7,173 209 39 ⫾ 50 26 ⫾ 20 18 ⫾ 28 28 ⫾ 33 118 123 1 ⬍ 0.001 3,286 1,266 ⫾ 2,111 17,937 ⫾ 15,370 459 ⫾ 288 6,554 ⫾ 11,682 178 0 0 0 0 NA NA ⬍ 0.001 ⬍ 0.001 3,370 197 ⫾ 105 63 ⫾ 127 17 ⫾ 23 93 ⫾ 118 127 24 ⫾ 29 6 ⫾ 71 7 ⫾ 25 16 ⫾ 22 138 6 50 0.182 aFor experimental conditions and the no. of replicates, see the text. NA, not applicable; SD, standard deviation; CV, coefficient of variation.
on May 16, 2020 by guest
http://jcm.asm.org/
was consistent irrespective of the geographic origin of the strains. Accordingly, the
com-bination of two peaks (
m/z
3,242 and 3,286) had a sensitivity of 95.9% and a specificity of
98.7% for identification and characterization of
C. difficile
genotype ST37 by MALDI-TOF MS.
DISCUSSION
In this study, we describe a new strategy, based on MALDI-TOF MS, for the rapid
identification of
C. difficile
genotype ST37. A set of particular peaks (
m/z
3,242 and
3,286) appeared to be somewhat specific to ST37
C. difficile
. Using these two peaks, the
ST37 genotype can be quickly identified and differentiated from non-ST37 genotypes.
In comparison to MLST technology, the method for identification of ST37
C. difficile
based on MALDI-TOF MS is rapid, accurate, and cost-effective.
The peak combination of
m/z
3,242 and 3,286 as a biomarker for ST37 strains has
high specificity and sensitivity. Two widely used MALDI-TOF MS systems in clinical
microbiology laboratories were included in this study; both produced satisfactory
results for identification of the
C. difficile
ST37 genotype. Among the 204 clinical isolates
studied, the two-peak combination was detected in one ST3 isolate, as well as in one
ST81 isolate. It is worth noting that both ST81 and ST37 belong to clade 4, so the two
genotypes may not be distinguishable because of their highly similar protein spectra.
According to MLST analysis, there is only one allele variation between ST37 and ST81.
Moreover, our previous data showed that the ribotype of the ST81 isolate was 017.
Among the 31 ST37 isolates tested by PCR-ribotyping, all but one (CD044) were
ribotype 017 (data not shown). It was reported in a general teaching hospital in
Shanghai that, like ST37, the ST81 genotype had a much higher resistance rate to
clindamycin and moxifloxacin (29). According to a recent report from China (30),
non-ST37 isolates belonging to clade 4 are also seen in a certain proportion in the
population of persons in China with
C. difficile
infection. Larger studies in China are
being planned in order to include more non-ST37 isolates belonging to clade 4.
MALDI-TOF MS-based typing techniques have been used for the typing of many
bacterial species, such as
Escherichia coli
(25, 31, 32),
Staphylococcus aureus
(33, 34),
Streptococcus agalactiae
(35),
Streptococcus pneumoniae
(36),
Salmonella enterica
(37),
and
Acinetobacter baumannii
(38). Reil et al. successfully identified the
C. difficile
strains
RT001, 027, and 078/126 using an extended MALDI-TOF MS system in 2011, while the
RT017 strain, due to the low number of isolates, could not be identified (26). In this
study,
C. difficile
genotype ST37 was successfully identified with a combination of two
peaks (
m/z
3,242 and 3,286). ST37 is one of the most common sequence types of
C.
difficile
found in China that has a significantly different resistance pattern than others.
The MALDI-TOF MS-based rapid identification method for
C. difficile
ST37 is likely to
have an important impact in clinical practice (6, 11, 12).
[image:7.585.42.546.83.208.2]In summary,
C. difficile
genotype ST37 possesses several unique genotypic and
phenotypic characteristics, including increased antibiotic resistance and A
⫺B
⫹pheno-type for the
tcdA
and
tcdB
genes; this strain currently circulates as a dominant strain in
TABLE 3Molecular characteristics of ST37 and non-ST37C. difficileisolatesGenotype Geographic origin
No. of isolates tested
MSapeak (no. present [%]) atm/z: tcdAortcdBphenotypeb
3,242 3,286 3,370 AⴙBⴙ AⴚBⴙ AⴚBⴚ
ST37 Hebei, China 31 31 (100) 30 (96.8) 30 (96.8) 0 (0) 31 (100) 0 (0)
Hangzhou, China 5 5 (100) 4 (80.0) 5 (100) 0 (0) 5 (100) 0 (0)
Asia Pacific region 5 5 (100) 5 (100) 5 (100) 0 (0) 5 (100) 0 (0)
New York, USA 8 8 (100) 8 (100) 1 (12.5) ND ND ND
All ST37 origins 49 49 (100) 47 (95.9) 41 (83.7)
Non-ST37 Hebei, China 147 62 (42.2) 1 (0.7) 135 (91.8) 116 (78.9) 1 (0.7) 30 (20.4)
Asia Pacific region 2 0 (0) 0 (0) 2 (100) 2 (100) 0 (0) 0 (0)
New York, USA 6 2 (33.3) 1 (16.7) 0 (0) ND ND ND
All non-ST37 origins 155 64 (41.3) 2 (1.3) 137 (88.4)
aMS, mass spectrometry.
bND, not done.
on May 16, 2020 by guest
http://jcm.asm.org/
mainland China (8–10). A pilot proteomic analysis indicated that the presences of
m/z
3,242 and 3,286 peaks cannot be explained by common postgenomic modifications,
such as methylation. The two peaks, especially the
m/z
3,242 peak, exist at a low level
at the current detection sensitivity in some non-ST37 isolates. Additional studies are
being done to characterize these two molecules with peaks at
m/z
3,242 and 3,286 that
appear to be specific for
C. difficile
genotype ST37.
ACKNOWLEDGMENTS
We thank medical technologists working in clinical laboratories in hospitals and
centers for disease control and prevention in Hebei and Zhejiang Provinces and New
York State for technical assistance.
This study was supported in part by a Natural Science Fund of Hebei Province grant
(2013206450), a research contract between the Memorial Sloan Kettering Cancer Center
and bioMérieux, Inc. (SK2012-0595), and an NIH/NCI P30 Cancer Center Support Grant
(CA008748).
D.H.P. and M.W. are employees of bioMérieux, Inc., and bioMérieux SA, respectively.
We declare that there are no conflicts of interest for the other authors.
REFERENCES
1. Gerding DN. 2010. Global epidemiology ofClostridium difficile infection
in 2010. Infect Control Hosp Epidemiol 31(Suppl 1):S32–S34.https://doi .org/10.1086/655998.
2. Valiente E, Cairns MD, Wren BW. 2014. TheClostridium difficilePCR ribotype 027 lineage: a pathogen on the move. Clin Microbiol Infect 20:396 – 404.https://doi.org/10.1111/1469-0691.12619.
3. Rupnik M, Wilcox MH, Gerding DN. 2009.Clostridium difficileinfection: new developments in epidemiology and pathogenesis. Nat Rev Micro-biol 7:526 –536.https://doi.org/10.1038/nrmicro2164.
4. Geric B, Rupnik M, Gerding DN, Grabnar M, Johnson S. 2004. Distribution ofClostridium difficilevariant toxinotypes and strains with binary toxin genes among clinical isolates in an American hospital. J Med Microbiol 53:887– 894.https://doi.org/10.1099/jmm.0.45610-0.
5. Kuehne SA, Cartman ST, Heap JT, Kelly ML, Cockayne A, Minton NP. 2010. The role of toxin A and toxin B inClostridium difficileinfection. Nature 467:711–713.https://doi.org/10.1038/nature09397.
6. Collins DA, Hawkey PM, Riley TV. 2013. Epidemiology ofClostridium difficileinfection in Asia. Antimicrob Resist Infect Control 2:21.https:// doi.org/10.1186/2047-2994-2-21.
7. Gao Q, Wu S, Huang H, Ni Y, Chen Y, Hu Y, Yu Y. 2016. Toxin profiles, PCR ribotypes and resistance patterns of Clostridium difficile: a multicentre study in China, 2012–2013. Int J Antimicrob Agents 48:736 –739.https:// doi.org/10.1016/j.ijantimicag.2016.09.009.
8. Tian TT, Zhao JH, Yang J, Qiang CX, Li ZR, Chen J, Xu KY, Ciu QQ, Li RX. 2016. Molecular characterization ofClostridium difficile isolates from human subjects and the environment. PLoS One 11:e0151964.https:// doi.org/10.1371/journal.pone.0151964.
9. Gu SL, Chen YB, Lv T, Zhang XW, Wei ZQ, Shen P, Li LJ. 2015. Risk factors, outcomes and epidemiology associated withClostridium difficile infec-tion in patients with haematological malignancies in a tertiary care hospital in China. J Med Microbiol 64:209 –216.https://doi.org/10.1099/ jmm.0.000028.
10. Jin D, Luo Y, Huang C, Cai J, Ye J, Zheng Y, Wang L, Zhao P, Liu A, Fang W, Wang X, Xia S, Jiang J, Tang YW. 2017. Molecular epidemiology of
Clostridium difficileinfection in hospitalized patients in eastern China. J Clin Microbiol 55:801– 810.https://doi.org/10.1128/JCM.01898-16. 11. Kim J, Kang JO, Pai H, Choi TY. 2012. Association between PCR ribotypes
and antimicrobial susceptibility amongClostridium difficileisolates from healthcare-associated infections in South Korea. Int J Antimicrob Agents 40:24 –29.https://doi.org/10.1016/j.ijantimicag.2012.03.015.
12. King AM, Mackin KE, Lyras D. 2015. Emergence of toxin A-negative, toxin B-positiveClostridium difficilestrains: epidemiological and clinical consider-ations. Future Microbiol 10:1– 4.https://doi.org/10.2217/fmb.14.115. 13. Cairns MD, Preston MD, Lawley TD, Clark TG, Stabler RA, Wren BW. 2015.
Genomic epidemiology of a protracted hospital outbreak caused by a toxin A-negativeClostridium difficilesublineage PCR ribotype 017 strain in London, England. J Clin Microbiol 53:3141–3147.https://doi.org/10 .1128/JCM.00648-15.
14. Shin BM, Kuak EY, Yoo SJ, Shin WC, Yoo HM. 2008. Emerging toxin A⫺B⫹ variant strain ofClostridium difficileresponsible for pseudomembranous colitis at a tertiary care hospital in Korea. Diagn Microbiol Infect Dis 60:333–337.https://doi.org/10.1016/j.diagmicrobio.2007.10.022. 15. Arvand M, Hauri AM, Zaiss NH, Witte W, Bettge-Weller G. 2009.
Clostrid-ium difficileribotypes 001, 017, and 027 are associated with lethalC. difficileinfection in Hesse, Germany. Euro Surveill 14(45):pii⫽19403. https://doi.org/10.2807/ese.14.45.19403-en.
16. Griffiths D, Fawley W, Kachrimanidou M, Bowden R, Crook DW, Fung R, Golubchik T, Harding RM, Jeffery KJ, Jolley KA, Kirton R, Peto TE, Rees G, Stoesser N, Vaughan A, Walker AS, Young BC, Wilcox M, Dingle KE. 2010. Multilocus sequence typing ofClostridium difficile. J Clin Microbiol 48: 770 –778.https://doi.org/10.1128/JCM.01796-09.
17. Dierig A, Frei R, Egli A. 2015. The fast route to microbe identification: matrix assisted laser desorption/ionization-time of flight mass spectrom-etry (MALDI-TOF MS). Pediatr Infect Dis J 34:97–99.https://doi.org/10 .1097/INF.0000000000000601.
18. van Veen SQ, Claas EC, Kuijper EJ. 2010. High-throughput identification of bacteria and yeast by matrix-assisted laser desorption ionization-time of flight mass spectrometry in conventional medical microbiology lab-oratories. J Clin Microbiol 48:900 –907.https://doi.org/10.1128/JCM .02071-09.
19. Nomura F. 2015. Proteome-based bacterial identification using matrix-assisted laser desorption ionization-time of flight mass spectrometry (MALDI-TOF MS): A revolutionary shift in clinical diagnostic microbiology. Biochim Biophys Acta 1854:528 –537.https://doi.org/10.1016/j.bbapap.2014 .10.022.
20. Sauget M, Valot B, Bertrand X, Hocquet D. 2017. Can MALDI-TOF mass spectrometry reasonably type bacteria? Trends Microbiol 25:447– 455. https://doi.org/10.1016/j.tim.2016.12.006.
21. van Belkum A, Welker M, Pincus D, Charrier JP, Girard V. 2017. Matrix-assisted laser desorption ionization time-of-flight mass spectrometry in clinical microbiology: what are the current issues? Ann Lab Med 37: 475– 483.https://doi.org/10.3343/alm.2017.37.6.475.
22. Steensels D, Verhaegen J, Lagrou K. 2011. Matrix-assisted laser desorp-tion ionizadesorp-tion–time of flight mass spectrometry for the identificadesorp-tion of bacteria and yeasts in a clinical microbiological laboratory: a review. Acta Clin Belg 66:267–273.
23. McMullen AR, Wallace MA, Pincus DH, Wilkey K, Burnham CA. 2016. Evaluation of the Vitek MS matrix-assisted laser desorption ionization–time of flight mass spectrometry system for identification of clinically relevant filamentous fungi. J Clin Microbiol 54:2068 –2073. https://doi.org/10 .1128/JCM.00825-16.
24. Cabrolier N, Sauget M, Bertrand X, Hocquet D. 2015. Matrix-assisted laser desorption ionization–time of flight mass spectrometry identifies Pseu-domonas aeruginosa high-risk clones. J Clin Microbiol 53:1395–1398. https://doi.org/10.1128/JCM.00210-15.
25. Clark CG, Kruczkiewicz P, Guan C, McCorrister SJ, Chong P, Wylie J, van
on May 16, 2020 by guest
http://jcm.asm.org/
Caeseele P, Tabor HA, Snarr P, Gilmour MW, Taboada EN, Westmacott GR. 2013. Evaluation of MALDI-TOF mass spectroscopy methods for determination ofEscherichia colipathotypes. J Microbiol Methods 94: 180 –191.https://doi.org/10.1016/j.mimet.2013.06.020.
26. Reil M, Erhard M, Kuijper EJ, Kist M, Zaiss H, Witte W, Gruber H, Borg-mann S. 2011. Recognition ofClostridium difficilePCR-ribotypes 001, 027 and 126/078 using an extended MALDI-TOF MS system. Eur J Clin Microbiol Infect Dis 30:1431–1436.https://doi.org/10.1007/s10096-011 -1238-6.
27. Huang B, Jin D, Zhang J, Sun JY, Wang X, Stiles J, Xu X, Kamboj M, Babady NE, Tang YW. 2014. Real-time cellular analysis coupled with a specimen enrichment accurately detects and quantifiesClostridium dif-ficiletoxins in stool. J Clin Microbiol 52:1105–1111.https://doi.org/10 .1128/JCM.02601-13.
28. Lemee L, Dhalluin A, Testelin S, Mattrat MA, Maillard K, Lemeland JF, Pons JL. 2004. Multiplex PCR targetingtpi(triose phosphate isomerase),
tcdA(toxin A), andtcdB(toxin B) genes for toxigenic culture of Clostrid-ium difficile. J Clin Microbiol 42:5710 –5714.https://doi.org/10.1128/JCM .42.12.5710-5714.2004.
29. Qin J, Dai Y, Ma X, Wang Y, Gao Q, Lu H, Li T, Meng H, Liu Q, Li M. 2017. Nosocomial transmission of Clostridium difficilegenotype ST81 in a general teaching hospital in China traced by whole genome sequencing. Sci Rep 7:9627.https://doi.org/10.1038/s41598-017-09878-8.
30. Cheng JW, Xiao M, Kudinha T, Kong F, Xu ZP, Sun LY, Zhang L, Fan X, Xie XL, Xu YC. 2016. Molecular epidemiology and antimicrobial sus-ceptibility ofClostridium difficileisolates from a university teaching hospital in China. Front Microbiol 7:1621. https://doi.org/10.3389/ fmicb.2016.01621.
31. Sauget M, Nicolas-Chanoine MH, Cabrolier N, Bertrand X, Hocquet D. 2014. Matrix-assisted laser desorption ionization–time of flight mass spec-trometry assignsEscherichia colito the phylogroups A, B1, B2 and D. Int J Med Microbiol 304:977–983.https://doi.org/10.1016/j.ijmm.2014.06.004. 32. Nakamura A, Komatsu M, Kondo A, Ohno Y, Kohno H, Nakamura F,
Matsuo S, Ohnuma K, Hatano N, Kawano S. 2015. Rapid detection of
B2-ST131 clonal group of extended-spectrum beta-lactamase-producing
Escherichia coliby matrix-assisted laser desorption ionization–time-of-flight mass spectrometry: discovery of a peculiar amino acid substitution in B2-ST131 clonal group. Diagn Microbiol Infect Dis 83:237–244.https:// doi.org/10.1016/j.diagmicrobio.2015.06.024.
33. Lu JJ, Tsai FJ, Ho CM, Liu YC, Chen CJ. 2012. Peptide biomarker discovery for identification of methicillin-resistant and vancomycin-intermediate
Staphylococcus aureusstrains by MALDI-TOF. Anal Chem 84:5685–5692. https://doi.org/10.1021/ac300855z.
34. Mather CA, Werth BJ, Sivagnanam S, SenGupta DJ, Butler-Wu SM. 2016. Rapid detection of vancomycin-intermediateStaphylococcus aureusby matrix-assisted laser desorption ionization–time of flight mass spec-trometry. J Clin Microbiol 54:883– 890.https://doi.org/10.1128/JCM .02428-15.
35. Lartigue MF, Kostrzewa M, Salloum M, Haguenoer E, Hery-Arnaud G, Domelier AS, Stumpf S, Quentin R. 2011. Rapid detection of “highly virulent” group BStreptococcusST-17 and emerging ST-1 clones by MALDI-TOF mass spectrometry. J Microbiol Methods 86:262–265. https://doi.org/10.1016/j.mimet.2011.05.017.
36. Williamson YM, Moura H, Woolfitt AR, Pirkle JL, Barr JR, Carvalho MG, Ades EP, Carlone GM, Sampson JS. 2008. Differentiation ofStreptococcus pneumoniaeconjunctivitis outbreak isolates by matrix-assisted laser de-sorption ionization–time of flight mass spectrometry. Appl Environ Mi-crobiol 74:5891–5897.https://doi.org/10.1128/AEM.00791-08. 37. Kuhns M, Zautner AE, Rabsch W, Zimmermann O, Weig M, Bader O,
Gross U. 2012. Rapid discrimination ofSalmonella entericaserovar Typhi from other serovars by MALDI-TOF mass spectrometry. PLoS One 7:e40004.https://doi.org/10.1371/journal.pone.0040004.
38. Mencacci A, Monari C, Leli C, Merlini L, De Carolis E, Vella A, Cacioni M, Buzi S, Nardelli E, Bistoni F, Sanguinetti M, Vecchiarelli A. 2013. Typing of nosocomial outbreaks of Acinetobacter baumanniiby use of matrix-assisted laser desorption ionization–time of flight mass spectrometry. J Clin Microbiol 51:603– 606.https://doi.org/10.1128/JCM.01811-12.