R E S E A R C H
Open Access
Repression of chimeric transcripts emanating
from endogenous retrotransposons by a
sequence-specific transcription factor
Ka Sin Mak, Jon Burdach, Laura J Norton, Richard CM Pearson, Merlin Crossley
*and Alister PW Funnell
Abstract
Background:Retroviral elements are pervasively transcribed and dynamically regulated during development. While multiple histone- and DNA-modifying enzymes have broadly been associated with their global silencing, little is known about how the many diverse retroviral families are each selectively recognized.
Results:Here we show that the zinc finger protein Krüppel-like Factor 3 (KLF3) specifically silences transcription from theORR1A0long terminal repeat in murine fetal and adult erythroid cells. In the absence of KLF3, we detect widespread transcription fromORR1A0elements driven by the master erythroid regulator KLF1. In several instances these aberrant transcripts are spliced to downstream genic exons. One such chimeric transcript produces a novel, dominant negative isoform of PU.1 that can induce erythroid differentiation.
Conclusions:We propose that KLF3 ensures the integrity of the murine erythroid transcriptome through the selective repression of a particular retroelement and is likely one of multiple sequence-specific factors that cooperate to achieve global silencing.
Keywords:Retrotransposons, Chimeric transcripts, KLF1, KLF3, KLFs, Gene regulation, Erythroid, Transcription factors
Background
Transposable elements (TEs) are mobile segments of DNA that have integrated and spread in eukaryotic genomes. They constitute a substantial portion of the mouse and human genomes (approximately 39% and 46%, respectively [1]), and have been a major driving force in evolution [2]. In mammals, the vast majority of TEs are retrotransposons: genetic elements that have in-tegrated into host DNA following reverse transcription of an RNA template. Broadly, retrotransposons fall into two categories: those that contain long terminal repeats (LTRs) and are termed endogenous retroviruses (ERVs); and those that lack LTRs, namely, long and short inter-spersed elements (LINES and SINES).
The expansion of TEs has played an important role in shaping eukaryotic genomes, in part by enabling gen-omic shuffling by non-allelic homologous recombination but also by their capacity to remodel gene regulatory
networks [3-7]. Retroviral LTRs, for instance, harbor nu-merous, functional regulatory elements required for the initiation and control of transcription and can thus pro-foundly alter the expression of proximal genes [8,9]. Furthermore, because the many distinct classes of retro-virus differ in the regulatory sequences contained within their LTRs, they have proven highly versatile in rewiring diverse transcriptional programs. Indeed, throughout mammalian evolution, the spread and proliferation of retroelements have redistributed binding sites for a number of transcriptional regulators including the pluri-potency factors OCT4 and NANOG [5], the insulator protein CTCF [4-6], the neural repressor NRSF/REST [10], the tumour suppressor p53 [11], and others [12].
Analogously, expansion of the MER20 and RLTR13D5
transposable elements, which promote endometrial and trophoblast expression, have been postulated to have en-abled the placental transcription of genes critical to the evolutionary development of pregnancy [13,14].
Not only do retrotransposons provide regulatory mod-ules that influence nearby genes, they can also directly provide promoters that dictate transcriptional initiation. * Correspondence:[email protected]
School of Biotechnology and Biomolecular Sciences, University of New South Wales, Kensington NSW 2052, Australia
A notable example of this is the murine Agouti viable yellow (Avy) allele, in which an upstream intra-cisternal A particle (IAP) retrotransposon functions as a constitu-tively active promoter that drives ectopic expression of Agouti, resulting in yellow fur, obesity, and increased susceptibility to tumorigenesis [15,16]. The prevalence of this phenomenon, whereby retrotransposons serve as al-ternative promoters, has recently been revealed follow-ing the advent of high-throughput RNA sequencfollow-ing and shown to occur primarily in embryonic cells but also to some extent in adult tissues [17]. During early embry-onic development in particular, up to 20% of the tran-scriptome has been shown to initiate from within retrotransposons [17,18]. These retroelements frequently function as alternative promoters and show a propensity for tissue-specific activity, more so in fact than non-retrotransposon promoters [17]. In many instances, these retrotransposons have been co-opted by the host by exonization and they are transcribed and spliced to downstream genic exons [17,19,20]. The resulting chimeric transcripts thus potentially encode isoform var-iants with spatio- or temporally-restricted expression
profiles [21]. Indeed, a recent study of the Drosophila
melanogaster transcriptome has revealed that several hundred LTR retrotransposons serve as promoters of annotated genes throughout development, exhibiting specific expression profiles depending on the different regulatory modules they carry [22].
However, while there are many reported instances of TEs being co-opted by the host for various biological functions, genomic integration of TEs can also be
dele-terious [23-25]. For instance, Hodgkin’s lymphoma has
been shown to arise from aberrant transcription of the colony-stimulating factor 1 receptor(CSF1R) gene driven
by an internal LTR element known asTHE1B[26].
Accordingly, higher eukaryotes have developed nume-rous defence mechanisms to silence TEs, typically in-volving DNA methylation and/or histone modification [27-29]. This silencing largely occurs early in embryonic development and is dependent on epigenetic modifiers including: DNA methyltransferases (DNMTs) [27,30]; histone modifying enzymes such as the demethylase LSD1/KDM1A, the deacetylase HDAC1, and the methyl-transferases SETDB1 and G9A [31-35]; and Polycomb Group proteins [36]. Ablation of these factors in embry-onic stem cells results in widespread de-repression of retrotransposon-derived transcripts.
However, while silencing of retroelements is broadly carried out by these epigenetic modifiers, little is known about the underlying mechanisms by which the diverse classes of retroelements are each specifically recognized [28]. Indeed the lack of sequence similarity between un-related retroviral families suggests the existence of mul-tiple recognition factors that participate in the silencing
of retroelements. An accumulating body of evidence has pointed towards the possible role of DNA binding, tan-dem zinc finger proteins in providing this specificity. Thomas and Schneider have proposed a model of
co-evolution between retroelements and C2H2 zinc finger
proteins based on striking correlations of their expan-sion throughout vertebrate genomes [37]. This model followed from the discovery that the Krüppel-associated box (KRAB)-zinc finger protein ZFP809 binds and re-presses a large number of retroelements in mouse em-bryonic stem cells [38]. ZFP809 achieves this through the recruitment of the corepressor TRIM28 (also known as KRAB-associated protein 1, KAP1). TRIM28 in turn silences ERVs through SETDB1 mediated trimethylation of H3K9 [31,39,40].
The Krüppel-like factors (KLFs) are a family of DNA binding, zinc finger transcription factors [41]. They lack a KRAB domain and are characterized by a set of three tandem C2H2zinc fingers at their C-termini that confer
specificity towards CACCC-like and GC-rich sequences in regulatory elements [42]. While the DNA binding domain is highly conserved within the family, the N-terminal regulatory domains vary considerably such that the different KLFs recruit an assortment of co-regulators to activate or repress genes [43].
The founding member of the family, KLF1, is an erythroid-specific transcriptional activator that drives the expression of genes required for red blood cell mat-uration [44]. One such gene is that encoding the related family member KLF3 [45]. KLF3 and KLF1 recognize similar sequences of DNA that adhere to the consensus
5′-NCN CNC CCN-3′ [42,46]. However, unlike KLF1,
KLF3 is a transcriptional repressor that recruits the co-repressor C-terminal binding protein (CTBP) [47]. CTBP forms part of a large repressor complex that includes the histone deacetylases HDAC1 and HDAC2, the histone methyltransferases EHMT1 and G9A/ EHMT2, and the lysine-specific demethylase LSD1/ KDM1A [48]. KLF1 and KLF3 exhibit opposing activities at a number of genes in erythroid cells and serve to fine-tune their expression during erythropoiesis [49,50]. Ac-cordingly, loss of either factor disrupts this balance.Klf1 null mice die of severe anemia in uterowhile mice lack-ing KLF3, though viable, exhibit erythroid defects in both fetal and adult tissues [49,51].
Here, we have further explored the interplay between KLF1 and KLF3 in regulating the erythroid transcrip-tome. We find that KLF1 activates, while KLF3 re-presses, transcription from a specific family of LTR
elements known asORR1A0. Ablation of KLF3 results in
widespread, de-repressed transcription from these LTRs
in erythroid cells. Because theORR1A0element contains
that for the spleen focus forming virus proviral integra-tion 1 (Sfpi1) gene, an ORR1A0-driven transcript is translated into a truncated variant of PU.1 which ex-hibits dominant negative activity and can functionally promote erythroid differentiation. These results suggest that KLF3 ensures normal murine erythropoiesis by pre-venting aberrant, chimeric transcription driven from ORR1A0LTRs by KLF1.
Results
Increased expression of downstreamPu.1exons in erythroid cells in the absence of KLF3
We recently identified a number of KLF3 target genes via microarray analysis of Klf3−/− TER119+ (erythroid) fetal liver cells at embryonic day E14.5 [49]. These genes
were predominantly de-repressed in Klf3 null tissue,
consistent with KLF3 being a repressor of transcription. One of the most highly de-repressed genes was that en-coding the key hematopoietic regulator PU.1/SFPI1, hereafter referred to as PU.1.
We first sought to validate the upregulation of Pu.1
expression in Klf3−/− cells by quantitative real-time RT-PCR. Initial experiments, using primers that span the
exon 2/3 junction of Pu.1, did not recapitulate the
microarray results (Figure 1A). Unexpectedly,Pu.1mRNA
was detected at similar levels in Klf3+/+, Klf3+/−, and Klf3−/−Ter119+E14.5 fetal liver cells. To resolve this dis-crepancy, we analyzed the individual probe intensities across thePu.1locus from the microarray data. The
mur-ine Pu.1 gene comprises five exons and of these, exons
2 to 5 are represented by probes on the arrays. Expression
of only exons 3 to 5 of Pu.1 was found to be higher in
Klf3−/−compared toKlf3+/+tissue; however, expression of exon 2 was unchanged (Figure 1B). Real-time RT-PCR using primers specific for the exon 3/4 and exon 4/5 boundaries ofPu.1(Figure 1C, D) confirmed that indeed, exons 3 to 5 exhibit upregulated expression inKlf3−/−cells while exon 2 does not (Figure 1A).
AnORR1A0LTR element serves as an alternative promoter in thePu.1locus in the absence of KLF3
The upregulated expression of exons towards the 3′end
ofPu.1raised the possibility that an alternative, internal promoter was driving transcription from the locus and that this promoter is repressed by KLF3. To investigate
this, we conducted 5′RACE on mRNA fromKlf3+/+and
Klf3−/− Ter119+ fetal liver cells using a reverse primer
[image:3.595.53.538.390.663.2]specific for exon 3 of Pu.1. While electrophoretic
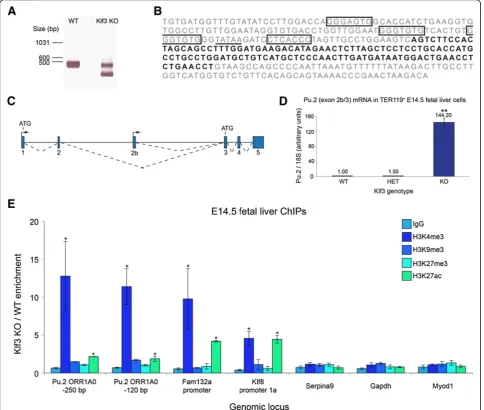
Figure 1Transcripts containing exons towards the 3′end ofPu.1are upregulated inKlf3−/−E14.5 TER119+fetal liver cells. (A, C, D)
Transcript levels inKlf3+/+(WT,n= 2),Klf3+/−(HET,n= 3), andKlf3−/−(KO,n= 3) cells were determined by quantitative real-time RT-PCR using forward and reverse primer combinations specific for exons 2 and 3(A), exons 3 and 4(C), or exons 4 and 5(D)ofPu.1. Values have been normalized to18SrRNA levels and in each instance theKlf3+/+sample has been set to 1.0. Error bars represent standard error of the mean. *,P< 0.02 compared
separation of RACE products revealed a common tran-script in both samples (an approximately 420 bp band), a smaller transcript (226 bp) was found in the Klf3−/− sample (Figure 2A). Sequencing of the two RACE prod-ucts revealed that the larger band corresponds to exons 1 to 3 of a typicalPu.1transcript (GenBank:NM_011355). The shorter transcript, however, was found to contain
exon 3 of Pu.1preceded by a novel sequence (shown in
bold in Figure 2B). This sequence maps to intron 2 of
Pu.1 and represents an alternative leader exon, hereby
[image:4.595.57.542.184.594.2]termed exon 2b, which is spliced to exon 3 and which has not been documented previously, to our knowledge (Figure 2C). Hereafter, we refer to this novel transcript asPu.2.
Figure 2A novel, internalPu.1promoter resides within anORR1A0LTR element and is repressed by KLF3. (A)RNA fromKlf3+/+(WT)
andKlf3−/−(KO) TER119+fetal liver cells was subjected to 5′RACE using a reverse primer specific for exon 3 ofPu.1and analyzed by agarose gel
electrophoresis. The smaller band in theKlf3KO lane was sequenced and found to contain a novel exon (exon 2b).(B)The sequence of the ORR1A0LTR, in whichPu.1exon 2b is shown in bold. Sequences which fit the KLF binding consensus 5′-NCN CNC CCN-3′are boxed, and the TATA box at−30 is underlined.(C)Schematic of the murinePu.1locus showing the position of exon 2b. Exons are represented by blue boxes, transcription start sites by arrowheads and splicing events by broken lines. Start points of translation (ATGs) for the two alternative transcripts are also shown.(D)Real-time RT-PCR quantification revealing that transcripts containing exon 2b spliced to exon 3 ofPu.1(that is,Pu.2transcripts) are upregulated inKlf3−/−TER119+E14.5 fetal liver cells compared toKlf3+/−(HET) andKlf3+/+. Values have been normalized to18SrRNA and
theKlf3+/+sample has been set to 1.0.n= 3 for each genotype. **,P<0.005 compared to bothKlf3+/+andKlf3+/−(Student’s two-tailedt-test).
(E)ChIPs were performed onKlf3+/+andKlf3−/−E14.5 fetal livers (n= 2 or 3 of each genotype per IP). Data are represented as the fold-change enrichment inKlf3−/−cells compared toKlf3+/+. TheFam132aandKlf8promoters have been included as positive controls whileSerpina9,Gapdh,
Searches using the RepeatMasker program showed that exon 2b lies within a 343 bp long terminal repeat
(LTR) element, named ORR1A0, belonging to the
MaLR(mammalian apparent LTR retrotransposon)
fam-ily (Figure 2B) [52]. TheORR1A0element in the murine
Pu.1 locus contains several hallmarks of a eukaryotic
core promoter including a TATA box at−30, an initiator
sequence (5′-TCAGTY-3′) at the TSS and a downstream
promoter element around +30 [53]. In addition, it tains several motifs fitting the KLF DNA-binding
con-sensus 5′-NCN CNC CCN-3′(Figure 2B).
In order to verify that this novel Pu.2 transcript is
de-repressed in erythroid cells lacking KLF3, we per-formed real-time RT-PCR onKlf3+/+,Klf3+/− andKlf3−/−
Ter119+ E14.5 fetal liver RNA using a forward primer
specific for exon 2b and a reverse primer targeting exon 3 of Pu.1. Indeed, significant up-regulation of the Pu.2 transcript (>140-fold) was observed inKlf3−/− compared to Klf3+/+ and Klf3+/− samples (Figure 2D). While this transcript was not amplified from wild-type tissue by
5′RACE (Figure 2A), we detected low amounts of it in
wild-type and Klf3+/− tissue by RT-PCR. In adultKlf3−/− mice, we observed marked upregulation of this chimeric transcript in erythroid organs (spleen and bone marrow) (Additional file 1: Figure S1A). In contrast, canonical
Pu.1mRNA was unaltered in these and other tissues
ex-amined (Additional file 1: Figure S1B).
KLF3 can repress transcription by recruiting CTBP, a co-repressor that silences genes through a number of different histone-modifying enzymes. We therefore
analyzed a series of histone marks around the Pu.2
ORR1A0 promoter in Klf3−/− compared to Klf3+/+ E14.5 fetal liver cells (Figure 2E). In particular, we observed a marked increase specifically of histone 3 lysine 4 tri-methylation (H3K4me3) in Klf3−/− cells at the ORR1A0 promoter (approximately 12-fold). We found that this mark was also increased at the pro-moters of previously validated KLF3 target genes
such as Klf8 [50] and Fam132a/adipolin [49,54]
(Figure 2E). H3K4me3 is a mark typically found at actively transcribed promoters [55]. Moreover, loss of this mark, rather than the acquisition of repressive modifications, has been reported during the develop-mental silencing of retroelements [18]. In addition,
the Pu.2 promoter displayed only a moderate level of
H3K9me3 in wild-type cells (Additional file 2: Figure S2). This was not appreciably altered in Klf3−/− cells, suggesting that H3K9 tri-methylation is not the primary mechanism through which KLF3 silences transcription at this locus. Together, these results
indicate that the ORR1A0 element is a functional,
alternative promoter for the Pu.1 gene in erythroid
cells and is highly de-repressed in the absence of KLF3.
KLF1 and KLF3 can bind to the CACCC-like boxes in theORR1A0LTR and activate and repress transcription, respectively
We next examined by electrophoretic mobility shift
assay (EMSA) whether one or more of the four 5′-NCN
CNC CCN-3′sites in theORR1A0promoter are
recog-nized by KLF3. Indeed, KLF3 was found to bind strongly to the two sites most distal to the TSS and weakly to the third CACCC-box (Figure 3A, B). We next assessed whether the related family member KLF1 also binds to these sites. KLF1 is highly expressed in erythroid cells and has a similar DNA-binding specificity to KLF3, such that the two proteins co-regulate overlapping genes in vivo[46,49]. We found that like KLF3, KLF1 binds to the two 5′most sites (Figure 3C). No detectable binding was observed for the CACCC boxes closest to the TSS (Figure 3D).
Having established that both KLF1 and KLF3 can bind
to motifs present in the ORR1A0 element, we next
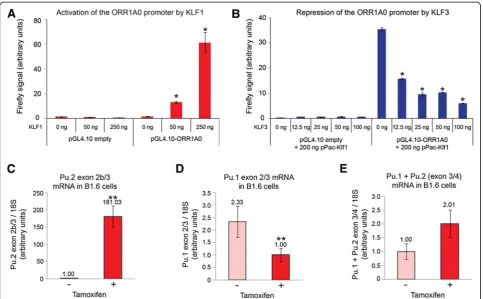
assessed whether they can functionally regulate this pro-moter in cellular assays. To do this, we cloned the ORR1A0 promoter upstream of a Firefly luciferase re-porter gene in the pGL4.10[luc2] vector. This was then co-transfected together with increasing amounts of KLF1 in SL-2 cells, a cell line that is often used to exam-ine KLF function due to minimal background CACCC-binding activity [45]. We found that KLF1 strongly
acti-vates expression from theORR1A0promoter but has
lit-tle effect on empty pGL4.10[luc2] vector (Figure 4A). By titrating increasing dosage of KLF3 we found that it
counters the activity of KLF1 at the ORR1A0 promoter
and represses expression (Figure 4B).
To investigate whether KLF1 indeed drives
transcrip-tion of these chimericPu.2transcripts from theORR1A0
element in vivo, we employed a KLF1-inducible
eryth-roid cell line known as B1.6 [56]. These cells were de-rived fromKlf1−/− fetal liver and have been rescued with a transgene encoding a tamoxifen-inducible KLF1-ER (estrogen receptor) fusion protein. Upon addition of tamoxifen, KLF1-ER is activated and drives expression of KLF1 target genes to induce hemoglobinization and erythroid differentiation. KLF3 protein has not been
de-tected in these cells, although Klf3 mRNA is induced
after KLF1-ER activation [50].
Using real-time RT-PCR we observed a low level of
Pu.2 mRNA in untreated B1.6 cells; however, tamoxifen
induction resulted in a dramatic increase of these transcripts (Figure 4C). Moreover, despite decreased
ex-pression of canonicalPu.1transcripts upon KLF1-ER
in-duction (represented by exon 2/exon 3, Figure 4D), the total level ofPu.1plusPu.2transcripts increased (repre-sented by the exon 3/exon 4 junction, Figure 4E), albeit not significantly. This suggests that the chimeric
Pu.2 mRNA pool in induced B1.6 cells. In addition, the
induction of Pu.2 expression was rapid following
tam-oxifen addition (within 2 hours) and occurred in the presence of the translation inhibitor cycloheximide (Additional file 3: Figure S3A, B). Taken together, these data suggest that KLF1 directly activates Pu.2
transcrip-tion from the endogenous ORR1A0 promoter in
eryth-roid cells in the absence of KLF3.
Widespread de-repression of chimeric transcripts from
ORR1A0elements in the absence of KLF3
A RepeatMasker survey revealed that there are
approxi-mately 2,130 ORR1A0 integrants in the mouse genome.
The consensus sequence of ORR1A0 found in Repbase
contains all of the core promoter sequences shown in
Figure 2B as well as the four 5′-NCN CNC CCN-3′
motifs. In addition, there is little divergence between
in-dividualORR1A0elements with elements generally
shar-ing greater than 97% sequence identity to the consensus [57]. We therefore hypothesized that KLF3 might play a broader role in silencing aberrant transcription from ORR1A0LTRs.
[image:6.595.59.539.87.476.2]To investigate this, we performed RNA-Seq on tripli-cate samples ofKlf3+/+ and Klf3−/− E14.5 TER119+ fetal liver cells. In total, 1,025 genes were found to be signifi-cantly deregulated (FDR <0.05) in the absence of KLF3 Figure 3KLF1 and KLF3 bind to CACCC boxes in theORR1A0LTR.Nuclear extracts were harvested from COS cells expressing KLF3(A, B)
(Additional file 4: Table S1). The majority of these (76.7%) were upregulated in Klf3−/− cells, concordant with the view from previous studies that KLF3 is pre-dominantly a transcriptional repressor [49]. Importantly, previously validated KLF3 targets also displayed
signifi-cant upregulation by RNA-Seq includingKlf8(108-fold),
Lgals3 (33-fold), Fam132a/adipolin (7.5-fold), Hba-x (2.3-fold), andHbb-y(1.8-fold) [49,50,54,58].
We next assessed whether the ORR1A0 LTR, and
re-lated ORR1A0-int, elements were enriched among the
list of KLF3 target genes. We found that of the 786 sig-nificantly upregulated genes, 166 of these (21.1%)
con-tained one or more ORR1A0 LTRs. In contrast, of the
239 downregulated genes, there was only one instance of
an overlap with anORR1A0element (0.004%). Similarly,
ORR1A0-int elements, which are typically flanked by ORR1A0 LTRs, were found in 96 upregulated genes (12.2%) and only in a single case of a downregulated gene. These results illustrate a clear enrichment of the ORR1A0 and ORR1A0-int retroelements specifically
within genes that are normally repressed by KLF3 in erythroid cells.
Because of sequence conservation between ORR1A0
elements and difficulties associated with unambiguously assigning them to specific genomic loci, we instead
looked for evidence of splicing between ORR1A0
tran-scripts and downstream genic exons. To do this, we con-fined our analysis to annotated genes which displayed differential isoform expression in Klf3−/− cells (greater than 10-fold upregulated compared toKlf3+/+). We iden-tified 70 such genes (Additional file 5: Table S2). Of
these, 34.3% contained transcribed ORR1A0 elements,
and almost half of these (41.7%) were spliced to genic exons and a further 16.7% showed splicing to un-annotated exons.
By real-time RT-PCR, we validated these results for a selection of candidate target genes. Using forward
primers specific for the ORR1A0 exon and reverse
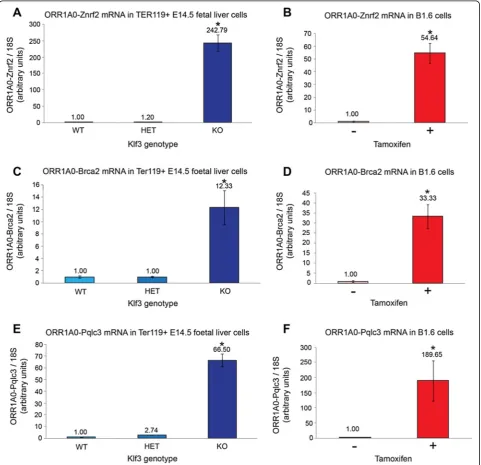
[image:7.595.57.541.88.387.2]primers specific for downstream genic exons, we ob-served striking upregulation for all three genes tested Figure 4KLF1 drives expression from thePu.2 ORR1A0promoter. (A, B)SL2 cells were co-transfected with pGL4.10Fireflyluciferase reporter (promoter-less or containing theORR1A0promoter) together with increasing amounts of pPac-Klf1(A)or a steady amount of pPac-Klf1 and increasing dosage of pPac-Klf3(B).Fireflylevels have been normalized toRenillaluciferase and in each instance the lowest value has been set to 1.0. Charts represent the mean of triplicate experiments and error bars show standard error of the mean. *,P<0.005 (Student’s two-tailedt-test) compared to pGL4.10-ORR1A0wells transfected with 0 ng pPac-Klf1(A)or 0 ng pPac-Klf3(B).(C-E)KLF1-ER activity was induced in B1.6 cells by addition of tamoxifen and total RNA was extracted after 48 h and analyzed by quantitative real-time RT-PCR. Transcripts containing exons 2b/3 are increased(C)while those containing exons 2/3 are decreased(D). The total pool ofPu.1plusPu.2mRNA is represented by exons 3/4
(Znrf2,Brca2, and Pqlc3) in E14.5 TER119+cells lacking KLF3 (Figure 5A, C, E), mirroring our previous result for Pu.2 transcripts (Figure 2D). In addition, expression of all of these chimeric mRNAs increased considerably upon tamoxifen induction of B1.6 cells (Figure 5B, D, F). In these cells, their upregulation was rapid (Additional file 3: Figure S3C, E) and occurred in the presence of cy-cloheximide (Additional file 3: Figure S3D, F), suggesting
that like Pu.2, their transcription is also directly driven by KLF1. Lastly, it should be noted that definitively map-ping repetitive reads to their correct genomic loci is dif-ficult and thus the RNA-Seq analysis is not anticipated
to give an exhaustive list of genes for which ORR1A0
[image:8.595.58.540.201.666.2]exons are spliced to downstream exons. Indeed, by tar-geted real-time RT-PCR we assessed a further five candi-date genes for which the RNA-Seq analysis had not
Figure 5KLF1 activates while KLF3 represses chimeric transcripts fromORR1A0LTRs in erythroid cells.RNA fromKlf3+/+(WT),Klf3+/−(HET), andKlf3−/−(KO) TER119+E14.5 fetal liver cells(A, C, E)and from untreated and tamoxifen-treated KLF1-ER inducible B1.6 cells(B, D, F)was analyzed
called splicing events (Cd59b, Tmx4, Bzw2, Cpe, and Tcfl5). In each case, we found that in Klf3−/− cells, the ORR1A0exon is spliced and the resulting chimeric
tran-scripts are markedly upregulated compared to Klf3+/+
andKlf3+/−cells (Additional file 6: Figure S4A-C).
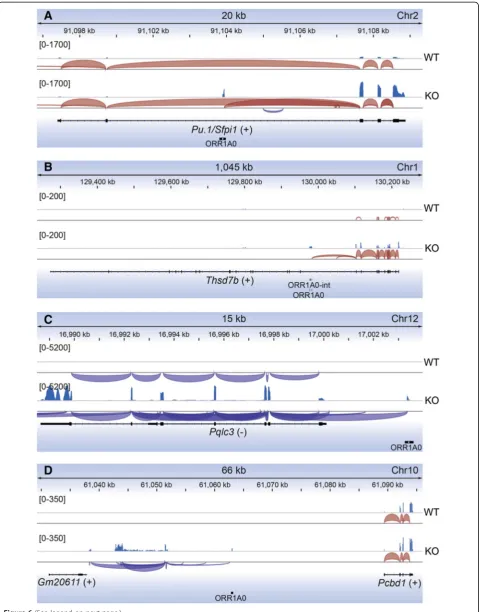
De-repressed transcription from ORR1A0 elements
was found to affect local gene expression in a number of ways, shown in Figure 6 and Additional file 7: Figure S5.
In many instances,ORR1A0LTRs reside within the body
of the gene and the new transcripts are spliced to down-stream genic exons. This is the case for Pu.1,Thsd7b, Znrf2, andBrca2(Figure 6A, B, Additional file 7: Figure
S5A, B). In addition, ORR1A0 LTRs upstream of genes
also act as novel transcriptional start sites for such chimeric transcripts, as is the case forPqlc3(Figure 6C). We also observed spliced transcripts emanating from ORR1A0 elements in un-annotated regions (Figure 6D) and also detected novel transcripts antisense to known genes (Additional file 7: Figure S5C). Lastly, in several cases we observed significantly de-repressed transcription
from and acrossORR1A0elements that did not appear to
influence the expression of the surrounding gene, as for Drosha (Additional file 7: Figure S5D). This typically oc-curred either where twoORR1A0LTRs exist as a cassette, flanking anORR1A0-intelement (Additional file 7: Figure S5D), or where they are in an antisense direction to a tran-scribed gene (Additional file 7: Figure S5C).
Several of these chimeric transcripts have previously been reported as ESTs that have typically been detected in embryonic cells and tissues from a range of developmental
stages including 4-cell (Brca2; GenBank:CN716605) and
8-cell stage embryos (Chr10: chr10:61042355–61063209
shown in Figure 6D; GenBank:CJ067427), E13 liver tissue
(chr9:9049867–9081010; GenBank:CJ043932), and E17
amnion (Znrf2; GenBank: BY073363 and CJ093793). This
provides further evidence thatORR1A0LTRs are capable
of functioning asbona fidepromotersin vivo.
The chimericPu.2transcript driven by theORR1A0 promoter is translatedin vivo
Thus far, the results presented here suggest that KLF3
silences aberrant transcription from ORR1A0 LTRs in
erythroid cells. These chimeric transcripts potentially encode protein variants that might functionally impact
normal murine erythropoiesis. Indeed,Klf3null mice ex-hibit a number of erythroid defects including increased immature red blood cells (reticulocytes) and nuclear in-clusions (Howell-Jolly bodies) in peripheral blood [49]. We thus sought to determine whether these chimeric transcripts are in fact translated in vivo using the Pu.1 gene as an example, given the role of this transcription factor as a master regulator of hematopoietic differenti-ation [59].
The chimericPu.2transcript contains a potential ATG
start codon within exon 3 (Figure 2C) and is predicted to encode a truncated isoform (PU.2) that lacks 88 amino acids at its N-terminus. Since the ETS DNA-binding domain lies at the C-terminus of PU.1, we antic-ipated that PU.2 would retain DNA-binding ability. We cloned and expressed PU.1 and PU.2 in COS cells and tested their ability to bind to a radiolabelled probe
con-taining the PU.1 DNA-binding consensus sequence (5′
-GAGGAA-3′) by EMSA. Indeed, PU.2 is able to bind to
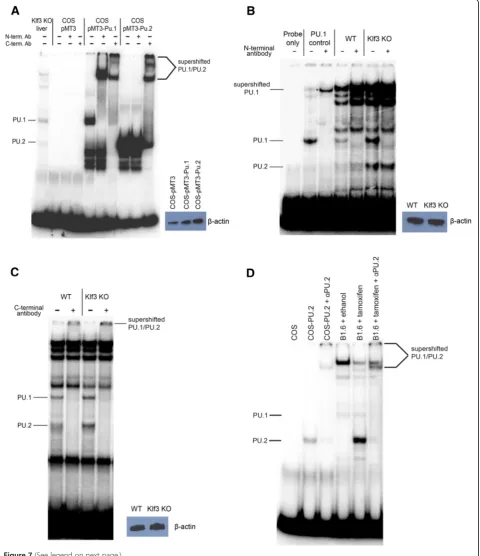
DNA and migrates more rapidly than PU.1 (Figure 7A). Moreover, while PU.1 is recognized and supershifted by antibodies raised against both the N- and C-terminus of PU.1, PU.2 is only supershifted by the antibody specific for the C-terminus (Figure 7A).
To determine whether PU.2 protein is expressedin vivo, we analyzed nuclear extracts from E14.5 Klf3−/− fetal livers. Extracts from these cells formed bands that co-migrated with both PU.1 and PU.2 (Figure 7A). The upper band is supershifted by both antisera while the lower band is only supershifted by the C-terminal antisera, confirming their identities as PU.1 and PU.2, respectively (Figure 7B, C). PU.2 protein was also detected in nuclear extracts fromKlf3+/+fetal liver cells (Figure 7B, C) albeit at a lower level than in Klf3−/− samples. Lastly, we also observed marked induction of PU.2 protein upon tamoxifen activa-tion of KLF1-ER in B1.6 cells (Figure 7D) consistent with the upregulation ofPu.2transcripts (Figure 4C). Taken to-gether, these results indicate that PU.2 is indeed translated in erythroid cellsin vivo.
PU.2 can act as a dominant negative protein in erythroid cells
[image:10.595.61.537.90.103.2]The PU.2 protein lacks the N-terminal activation do-main of PU.1, a region that interacts with the general (See figure on previous page.)
transcription factor TFIID [60]. We therefore postulated that PU.2 might not function as a transcriptional activa-tor and might antagonize the activity of PU.1 at its target genes. To investigate this, we first conducted reporter assays using the promoter of a previously characterized
PU.1 target gene, CLEC5A [61]. We found that while
PU.1 robustly activated expression, PU.2 repressed this promoter in a dose-dependent manner (Additional file 8: Figure S6A, B).
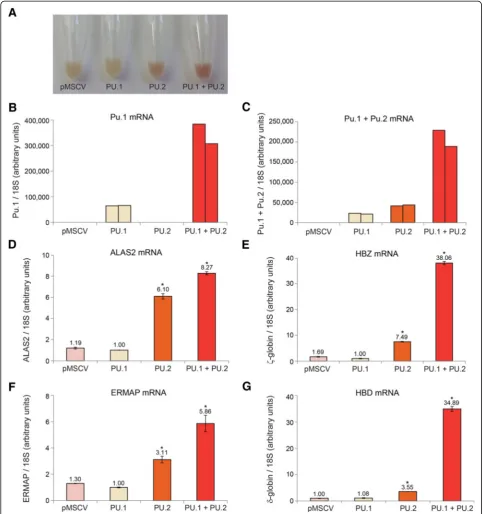
We next sought to examine the possible dominant negative activity of PU.2 in a hematopoietic system. To do this, we ectopically expressed PU.2, with or without PU.1, in human K562 cells and derived stable clones (Figure 8B, C). Forced expression of PU.1 has previously been shown to promote monocytic differentiation of these cells while inhibiting erythroid maturation [62]. Strikingly, we found that expression of PU.2, both by it-self and when co-expressed with PU.1, caused spontan-eous erythroid differentiation of these cells in the absence of any chemical-inducing agents (Figure 8A). Microarray analysis and real-time RT-PCR validation of these cell lines confirmed the upregulation of multiple
erythroid genes including the globins, ALAS2, and
erythroblast membrane-associated protein (ERMAP) (Additional file 9: Table S3, Figure 8D-G). These results suggest that the LTR-driven PU.2 protein that is upregu-lated in the absence of KLF3 can oppose the normal function of PU.1 and promote erythroid differentiation.
Discussion
It has recently been shown that TEs frequently act as promoters of genic transcription and are dynamically transcribed during ontogeny [17,18,20,22]. Typically, the majority of retroelement silencing occurs early in gesta-tion [28] and numerous studies have demonstrated the role of histone- and DNA-modifying enzymes in this process [27,30-34,36]. KRAB domain zinc finger pro-teins, which interact with the co-repressor TRIM28, have been proposed to play a role in the specific recog-nition and repression of distinct retroelement families [31,35,37,39,40]. This has indeed shown to be the case for ZFP809 in embryonic stem cells [38]. Other DNA-binding zinc finger proteins, including REX1/ZFP42,
have also been implicated, but their mechanism of action remains unclear and they appear to affect multiple, un-related retroviral families [63].
Here we show that the zinc finger protein KLF3, which lacks a KRAB domain, is required for the silencing
of transcription from ORR1A0 elements of the MaLR
family. In the absence of KLF3, there is a pronounced increase in chimeric transcripts generated from these LTRs. The phenomenon of deregulated chimeric tran-scription has previously been observed upon ablation of epigenetic modifiers such as SETDB1 and LSD1 in em-bryonic stem cells [27,34]. For example, in cells lacking SETDB1, 15% of de-repressed genes arise due to failed silencing of promoter-proximal ERVs and half of these genes exhibit chimeric transcripts [27]. However, in both of these cases the effects described were more global than we observe for KLF3 and covered diverse retroele-ment families.
Silencing of the ORR1A0 LTR by KLF3 appears to
occur largely independently of the TRIM28/SETDB1 pathway and DNA methylation. Analysis of over 23,000 TRIM28 binding sites in ES cells compiled from two studies [40,64] revealed that only eight lie within 100 bp
of an ORR1A0 element. This may partially reflect the
difficulties of detecting ChIP peaks that extend beyond the boundaries of repeat elements. However, a separate examination of regions of TRIM28-dependent H3K9 tri-methylation, which typically spread beyond repeat borders, revealed that only 62 of the 2,140ORR1A0 LTRs (that is, 2.9%) lie within 100 bp [40]. Similarly, analysis of the DNA methylation status of hematopoietic stem cells and erythroblasts revealed that only 1.0% (22) and 0.3% (7) of ORR1A0s, respectively, lie proximal to regions of DNA-methylation as determined by MBD-Seq [65].
From a number ofKlf3−/−tissues examined, the
upreg-ulation of ORR1A0 transcription appeared to be
re-stricted to erythroid cells. This is of particular interest given that most retroelement silencing has been demon-strated in embryonic stem and germ cells [27,30,31,33]. This suggests that KLF3 plays an active role in somatic repression of retroviral transcription, both in fetal and adult erythroid tissues. Consistent with its erythroid restricted profile, we found that the master erythroid (See figure on previous page.)
regulator KLF1 drives expression ofORR1A0-originating transcripts in the absence of KLF3.
The specific recognition of the ORR1A0 element by
KLF3 and KLF1 appears to involve two 5′
-CACNCCC-3′ boxes upstream of the TSS (Figures 2B and 3). The
similar DNA-binding specificities of KLF1 and KLF3 have previously been noted and indeed, approximately 50% of KLF3 target genes in erythroid cells are also
reg-ulated by KLF1 [49]. Interestingly, the ORR1A0-related
LTR ORR1A1 lacks one of the 5′-CACNCCC-3′ boxes and additionally lacks the TATA box. Despite being 97%
homologous with ORR1A0 and occurring at twice the
frequency in the mouse genome, we did not observe
enrichment of ORR1A1 in KLF3 repressed transcripts,
alluding to the functional importance of these two pro-moter motifs and the extraordinary specificity of KLF3
for theORR1A0LTR.
Moreover, although the ORR1 retroelement family is
abundantly represented throughout diverse rodent
spe-cies, the ORR1A0 LTR is specifically only found in the
mouse. It is interesting to note that the DNA-binding domain of KLF3 shows complete sequence conservation
between Mus musculus, Rattus norvegicus, and Homo
sapiens. This suggests that in the mouse, the DNA-binding specificity of KLF3 has not altered in response
to the emergence of theORR1A0retroelement. Rather, it
appears that KLF3-mediated repression of ORR1A0
oc-curred intrinsically from the initial appearance of the retroelement, and in this context, the spread of the ORR1A0LTR may have been tolerated without deleteri-ous impacts.
While KLF3 appears to efficiently silence ORR1A0
transcription in spleen and bone marrow cells, it is pos-sible that at particular stages of development or cellular maturation, KLF1 predominates and these chimeric transcripts are expressed at higher levels, as observed in the B1.6 erythroblast line. These chimeric transcripts po-tentially encode functional protein isoforms and indeed,
in the case of the Pu.1 locus, we have detected a
trun-cated isoform expressed in fetal liver. PU.2 counters the normal activity of PU.1 and instead promotes erythroid differentiation when ectopically expressed in myeloid leukemic K562 cells (Figure 8). This is consistent with the role of its transcriptional activator, KLF1, in driving terminal erythroid differentiation [44]. From this study, we cannot discount the possibility that the chimeric transcripts driven by KLF1 may be biologically func-tional in some circumstances. Indeed, host exaptation of TEs by exonization or through the remodelling of ex-pression programs is a phenomenon of which multiple instances have been described [5,13,14,19]. Incidentally,
although the consensus sequence of the ORR1A0 exon
contains a number of short open reading frames (see Figure 2B), each ATG is ultimately succeeded by an
in-frame stop codon. Thus ORR1A0 promoters are
pre-dicted to drive expression of either full-length endogen-ous proteins (where a canonical translation start site lies in a downstream, spliced exon), or N-terminal truncated protein isoforms, in cases where internal ATGs are suit-able start sites of translation, as for PU.2.
The importance of appropriate retrotransposon con-trol is apparent from numerous examples in which dys-regulation results in disease [25,26]. It is unclear as to
the extent to which the dysregulation ofORR1A0
tran-scription affects the physiology of the Klf3 null mice.
However, these animals do display an erythroid pheno-type, with impaired maturation, reticulocytosis, increased Howell-Jolly bodies and decreased lifespan of erythrocytes [49]. These defects have not been attributed to any single gene and it is more likely that they arise as a complicated result of multiple defects including the widespread expres-sion of aberrant, chimeric transcripts that we have pre-sented here.
Conclusions
In summary, these findings emphasize the non-redundant role that KLF3 plays in preventing widespread,
promiscu-ous transcription specifically from theORR1A0LTR. We
suggest that KLF3 is likely one of a patchwork of zinc fin-ger proteins including ZFP809 that together collaborate to silence the diverse collection of TEs that constitute such a large fraction of vertebrate genomes.
Materials and methods
Klf3−/−mice
Generation and maintenance of the Klf3−/− mouse line
has been described previously [66]. Ethical approval for animal use was obtained from the appropriate Animal Care and Ethics Committees (University of Sydney, ap-proval number L02/7-2009/3/5079; and University of New South Wales, approval number 09/128A). Genomic DNA was extracted from tail snips using DirectPCR Lysis Reagent (Viagen Biotech Inc, Los Angeles, CA,
USA) as per the manufacturer’s instructions and
geno-typing was performed as described previously [66].
Sorting of TER119+fetal liver cells
TER119+ cells were sorted from whole fetal livers (E13.5 or E14.5) using anti-TER119 Microbeads with MS or LS columns (Miltenyi Biotec Australia, North Ryde, NSW, Australia) as per the manufacturer’s protocol. After eluting, cells were centrifuged at 300 g for 10 min at 4°C and RNA was extracted from the cell pellet as described below.
RNA extraction and quantitative real-time RT-PCR
using the SuperScript® VILO™cDNA Synthesis Kit (Invi-trogen, Carlsbad, CA, USA) as instructed by the sup-plier. Quantitative real-time RT-PCR reactions were set up as described previously [45,49] but using Fas-tStart Universal SYBR Green Master (ROX) (Roche Diagnostics Australia Pty Ltd, Castle Hill, NSW,
Australia) or Power SYBR® Green PCR Master Mix
(Life Technologies, Gladesville, NSW, Australia). Re-actions were run using the Applied Biosystems 7500 Fast Real-Time PCR System (Life Technologies) and data were analyzed using 7500 Software v2.0.4 (Life Technologies). Relative quantification was calculated
using 18S rRNA levels and standard curves derived
from serial dilutions of amplicon as described previ-ously [45].
Real-time RT-PCR primers
Gene-specific primer pairs were designed using the Primer-BLAST tool [67] or PrimerExpress v3.0 (Applied Biosystems, Foster City, CA, USA) software to cross exon boundaries where possible. Primers were included in reactions at a concentration of 400 nM. The se-quences of forward and reverse primers for each gene
are: 18S, 5′-CACGGCCGGTACAGTGAAAC-3′ and
5′-AGAGGAGCGAGCGACCAA-3′; Pu.1 exons 2/3,
5′-CCTTCGTGGGCAGCGATGGA-3′ and 5′-GAGCT
GCTGTAGCTGCGGGG-3′; Pu.1 exons 3/4, 5′-GAG
CTGGAACAGATGCACGTCCT-3′ and 5′-GTGGGCT
GGGGACAAGGTTTGAT-3′; Pu.1 exons 4/5, 5′-TGG
AGAAGCTGATGGCTTGGAGC-3′ and 5′-CAGCA
GGAACTGGTACAGGCGAA-3′; Pu.2 exons 2b/3, 5′
-CCTGGATGCTGTCATGCTCCCAA-3′ and 5′-GTTG
TTGTGGACATGGTGTGCGG-3′; Znrf2, 5′-CCACTA
GCAGCCTTTGGATGAAGACA-3′and 5′-GGGTACA
AATTTTGAGCATACCGGGC-3′; Brca2, 5′-CTGCCA
TGCTCCCACCTTGATGA-3′ and 5′-ACCGTGGGGC
TTATACTCAGATTCCT-3′; Pqlc3, 5′-ACTCTCAGCT
CTGCCTGTGCCAT-3′and 5′-GGTGAGCAGTGGGT
TCCCATAGT-3′; Bzw2, 5′-GCCATGCCTGCCTGGAT
A-3′ and 5′
-ACTGGCTTCTGATGCTTATTCATAAA-3′; Cpe, 5′-GCTCCTCCTGTGCCATGCT-3′ and 5′-C
ATGCATGTTCCCAATGTATTTAAA-3′; Cd59b, 5′-G
CTCCCACCTTGATGATAATGG-3′and 5′-TGAGTCC
CCTCTGAGCTCTCA-3′; Tmx4, 5′-CCACCTTGATG
ATAATGGACTGAA-3′ and 5′-TGCTGGGAGAGTGG
TGACAA-3′; Tcfl5, 5′-GCCATGCCTGCCTGGAT-3′
and 5′-TGGATGTCGAATAAGAGTTACCAAAAG-3′;
HBZ, 5′-GAGGACCATCATTGTGTCCA-3′and 5′-AG
TGCGGGAAGTAGGTCTTG-3′;HBD, 5′-AACCTCAA
GGGCACTTTTTCT-3′ and 5′-GGAAACAGTCCAGG
ATCTCAA-3′; ALAS2, 5′-TAAGGCAACAAAGGCT
GGAG-3′ and 5′-GCCTTCACATCTTCCTGGAC-3′;
and ERMAP, 5′-GCTGTCTGTGCATGTGTCAG-3′ and
5′-CCACCTCACCTCCTTGGGTA-3′.
5′RACE (Rapid Amplification of cDNA Ends)
600 ng total RNA from TER119+ fetal liver cells
ob-tained from Klf3+/+ and Klf3−/− embryos (E13.5) was
used as a template for first strand cDNA synthesis
using the SMARTer™ RACE cDNA Amplification Kit
(Clontech, Mountain View, CA, USA). The RACE PCR was performed as directed by the supplier but using
0.05 unit/μL REDTaq DNA Polymerase (Sigma
Al-drich, St Louis, MO, USA). Thermal cycler settings were 24 cycles of 94°C/30 s, 64°C/30 s, and 72°C/ 1 min. Amplified products were resolved by electro-phoresis through a 1.2% agarose gel and were purified using the Wizard SV Gel and PCR Clean-up System (Promega Corporation, Madison, WI, USA) as per the
manufacturer’s manual. Nested RACE PCR was then
performed as described above with slight alterations to the thermal cycler parameters: 24 cycles of 94°C/ 30 s, 60°C/30 s, and 72°C/1 min. First round and nested RACE PCR primers are listed respectively:
re-verse primer targeting exon 4 of Pu.1, 5′-GTGGG
CTGGGGACAAGGTTTGAT-3′; reverse primer
tar-geting exon 3 of Pu.1, 5′- GCTGTAGCTGCGGGGG
CTGCACACT-3′. Amplicons were resolved and
puri-fied as described above and were sequenced by the Australian Genome Research Facility Ltd, Brisbane, QLD, Australia.
Chromatin immunoprecipitation (ChIP)
ChIP was performed with slight modifications based on Schmidt et al. [68]. Briefly, one cross-linked E14.5 liver was used per IP with antibodies as follows: IgG, 5 μg sc-2027 (Santa Cruz Biotechnology, Santa Cruz, CA, USA);
anti-H3K4me3, 5 μg C42D8 (Cell Signaling Technology,
Danvers, MA, USA), or 5μg ab12209 (abcam, Cambridge,
MA, USA); anti-H3K9me3, 5 μg ab8898 (abcam);
anti-H3K27me3, 3 μg C36B11 (Cell Signaling Technology) or
5 μg ab6002 (abcam); anti-H3K27ac, 0.5 μg #4353 (Cell
Signaling Technology) or 5μg ab4729 (abcam). Real-time PCR quantification of chromatin pull-down was per-formed as described above and amounts were normalized to the level of input material prior to immunoprecipita-tion. ChIP primer sequences have been described
previ-ously for Klf8promoter 1a and Fam132a [49,50]. Other
primers used are as follows:Pu.2 ORR1A0-250 bp, 5′-G
AAGTCCTTCTGGCTTCTGCAT-3′ and 5′-CTGACCT
TGTCTAACCCTTTTGTTTA-3′;Pu.2 ORR1A0-120 bp,
5′-GACAAGGTCAGGAGAGGTTT-3′ and 5′-CCACA
GTGACACACCCAT-3′; Myod1, 5′-TCCTATGCTTTG
CCTGGTCT-3′ and 5′-GGAAGGAGGGCAGAGAGAC
T-3′; Serpina9, 5′-TGTGCTGGACCTGGTTTGTA-3′
and 5′-CTGGCAGCTCTCACCTCTCT-3′, and; Gapdh,
5′-GACAGTCGGAAACTGGGAAG-3′and 5′-CATCAC
GTCCTCCATCATCC-3′. Base positions refer to where
Vectors and cloning of PU.1 and PU.2
The vectors pPac and pPac-Klf1 were provided by Menie Merika and Stuart Orkin (Harvard Medical School, Boston, MA, USA). The plasmid pPac-Klf3 and the mammalian expression vectors pMT3 and pMT3-Klf3 were gifts from Dr José Perdomo (St George Clinical School, Sydney, Australia). The mammalian expression vector pSG5-Klf1 was supplied by James Bieker (Mount Sinai School of Medicine, New York, NY, USA).FireflyandRenilla lucifer-ase vectors used were pGL4.10[luc2], and pGL4.23[luc2/
minP] and pGL4.74[hRluc/TK] as transfection controls
(Promega Corporation). The vector pEF-IRES-puro5
(pEF1α) was kindly provided by Dr Daniel Peet (University of Adelaide, Adelaide, Australia). TheRenillaluciferase re-porter construct pLightSwitch-Clec5a, containing
approxi-mately 1.1 kb of the human CLEC5A promoter, was
purchased from Switchgear Genomics (Menlo Park, CA,
USA). ThePu.2 ORR1A0promoter (−140 to +23) was
syn-thesized by GeneArt® (Life Technologies) and subcloned intoKpnI/XhoI pGL4.10[luc2] to create pGL4.10-ORR1A0.
Full lengthPu.1andPu.2were cloned from the cDNA
generated during the 5’′ RACE described above. PCRs
were set up using Phusion High-Fidelity DNA Polymer-ase (Finnzymes OY, Espoo, Finland) as directed by the supplier. Primers used in the first round of amplification include: 10x Universal Primer A Mix (UPM) supplied
from SMARTer™RACE cDNA Amplification Kit
(Clon-tech) as a forward primer, and a reverse primer specific
for exon 5 of Pu.1; 5′
-TCCGGGCCGGGCGACGGGT-TAATGCTAT-3′. Thermal cycler parameters were 98°C/
30 s, followed by 25 cycles of 98°C/10 s, 59°C/30 s, and 72°C/1 min, and a final cycle of 72°C/5 min. Amplified Pu.1andPu.2products were resolved by electrophoresis, purified as described above and subjected to nested PCR using foward primers covering the start points of
trans-lation for PU.1 (5′-ATTACTCGAGGCTCAGCTGGAT
GTTACAGGCGTGCAAA-3′) and PU.2 (5′-ATTACT
CGAGGCCACCATGGAGCTGGAACAGATGCAC-3′)
together with the common reverse primer 5′-TAATGA
ATTCAGCCTGGCGGTCTCTGCGGGCGATCAGT-3′
(which includes thePu.1stop codon in exon 5).
Param-eter settings were 98°C/30 s, followed by 25 cycles of 98°C/10 s, 69°C/30 s, and 72°C/1 min, and a final cycle of 72°C/5 min. The fragments were subsequently cloned
into XhoI/EcoRI pMT3 to form Pu.1 and
pMT3-Pu.2, respectively.Pu.1andPu.2were then subcloned into XhoI/EcoRI pEF1α to generate pEF1α-Pu.1 and pEF1α -Pu.2. Similarly,Pu.1andPu.2were cloned intoBglII/HpaI pMSCVpuro and pMSCVhyg (Clontech), respectively,
using the forward primers 5′-ATTAAGATCTGCTCA
GCTGGATGTTACAGGCGTGCAAA-3′ and 5′- ATTA
AGATCTGCCACCATGGAGCTGGAACAGATGCAC -3′
and the reverse primer 5′-TAATGTTAACAGCCTGGC
GGTCTCTGCGGGCGATCAGT-3′.
Cell culture
COS cells were cultured as described previously [45]. K562 and HL60 cells were maintained similarly but in RPMI 1640 culture medium (Gibco-BRL Life Technolo-gies, Grand Island, NY, USA). Culture conditions for B1.6 erythroblast cells have been described elsewhere [56]. B1.6 cells were induced with tamoxifen as de-scribed previously [45] and, with the exception of the time-course and cycloheximide experiments, were har-vested for RNA or nuclear extracts after 48 h. SL2
cells were cultured in Schneider’s Drosophila medium
(Gibco-BRL Life Technologies, Grand Island, NY, USA) supplemented with 10% heat-inactivated FCS and 1% penicillin/streptomycin/glutamine solution at 24°C.
Transfections and retroviral infections
COS cells were transfected with 5μg Pu.1,
pMT3-Pu.2 or pMT3 empty using FuGENE6 (Roche Diagnostics) as instructed by the supplier. Cells were harvested after 48 h for nuclear extracts. For retroviral infection of K562 cells, Phoenix A packaging cells were transfected with
12μg total vector DNA (12μg pMSCVpuro-Pu.1, 12μg
pMSCVhyg-Pu.2, 6μg pMSCVpuro plus 6μg pMSCVhyg,
or 6 μg pMSCVpuro-Pu.1 plus 6 μg pMSCVhyg-Pu.2)
using Lipofectamine 2000 (Life Technologies) according to the manufacturer’s instructions. Target K562 cells were seeded at 1 × 10⁵cells/mL in 6-well Plates 24 h prior to infection. Forty-eight hours following infection of pack-aging cells, virus-containing media (VCM) were collected and passed through a 0.45μm low protein binding filter. Non-tissue culture treated 6-well dishes were then coated with RetroNectin® (Clontech) as instructed by the manu-facturer. Half the volume of VCM was then added to the 6-well dishes for 30 min at room temperature. The target K562 cells were resuspended in the remaining VCM with the addition of protamine to a final concentration of
8 μg/mL. After 30 min, the VCM was aspirated from the
coated wells and was seeded with the K562 cells. The plates were subsequently centrifuged at 400 g for 1.5 h at
30°C and then incubated at 37°C with 5% CO2overnight.
After 12 h, VCM was collected from the packaging cells for a second round of infection as described above. Eight hours after the second spinoculation, the K562 cells were replenished with additional VCM and incubated for 48 h before replating in RPMI 1640 culture medium with 10% (v/v) heat-inactivated FCS (Gibco) and 1% (v/v) penicillin/ streptomycin/glutamine solution (Gibco). After another 48 h, cells were subjected to antibiotic selection and
main-tained in 1 μg/mL puromycin dihydrochloride (Sigma)
and 200 μg/mL hygromycin B (Life Technologies) as
appropriate.
Briefly, 106cells and 20μg plasmid were resuspended in
Dulbecco’s modified eagle medium (DMEM) low glucose
(LG) (Gibco-BRL Life Technologies) without serum and
in a total volume of 400 μL. Cells were electroporated
at 200 V, 950 μF and subsequently cultured and
main-tained in 2 μg/mL puromycin dihydrochloride to
gene-rate monoclonal lines.
Nuclear extracts and electrophoretic mobility shift assays (EMSAs)
Nuclear extracts were obtained and EMSAs were per-formed as described previously [46]. The radiolabelled probe containing the PU.1 consensus binding site comprises sense and antisense oligonucleotides for the
sequence 5′
-GCTCGAGGACTTCCTCTTTCCAGTGC-3′as described elsewhere [69].ORR1A0double stranded
CACCC probe sequences are as follows: CACCC#1, 5′
-ATGGTGCCACTCCCTGGTCC-3′; CACCC#2, 5′-CA
GTGACACACCCATTCCA-3′; CACCC#3, 5′-TTATAC
CCACACCCACAGTG-3′; CACCC#4, 5′-TAAGATCC
TCACCCTAGTTG-3′. The positive control KLF3
bin-ding site in the Fam132a promoter is ‘Probe C’ from
[54]. The antibodies used that were specific for the N-terminus and C-terminus of Pu.1 were 9G7 (Cell Sig-naling Technology) and T-21 (Santa Cruz Biotechnol-ogy), respectively. KLF1- and KLF3-specific antisera have been described previously [46].
Western blotting
Western blots were performed by standard methods. Briefly, nuclear extracts were separated by SDS-PAGE and were electrotransferred to PVDF membrane, which
was then blocked with 5% skim milk in 50 mM Tris–
HCl (pH 7.4), 150 mM NaCl, and 0.05% Tween 20. PU.2 protein was probed by overnight incubation of
mem-brane in 5% skim milk with 0.2 μg/mL PU.1 antibody
(T-21) (Santa Cruz Biotechnology) at 4°C. Detection was achieved using Immobilon Western Chemiluminescent HRP Substrate (Millipore Corporation, Billerica, MA, USA) and subsequently, membranes were stripped in
0.2 M NaOH for 10 min and were probed with β-actin
antibody (Sigma).
Reporter assays
SL2 cells were split into 6-well plates at a concentration
of 5 × 10⁵/mL and 24 h later were transfected with
pPac-Klf1 (0, 50, or 250 ng) and pPac-Klf3 (0, 12.5, 25, 50, or 100 ng) supplemented to equal loads with pPac
empty vector, together with 100 ng pGL4.74 [hRLuc/TK]
and 1 μg pGL4.10 [luc2] or pGL4.10-ORR1A0 using
FuGene6 (Roche Diagnostics) as instructed by the sup-plier. In competition assays, the pGL4.10-ORR1A0 vec-tor (and pGL4.10 [luc2]) were driven by co-transfection of 200 ng pPac-Klf1. After 48 h, cells were harvested and
lysates analyzed using the Dual-luciferase® Reporter Assay System (Promega Corporation) and a TD20/20 lumin-ometer (Turner Biosystems, Sunnyvale, CA, USA). HEK293 cells were similarly transfected but with 0, 10, 100, and 1,000 ng pEF1α-Pu.1 (supplemented with pEF1αto a total
of 1,000 ng vector) together with 1 μg pLightSwitch
(empty vector) or pLightSwitch-Clec5a. As a control, 100 ng pGL4.23 [luc2/minP] Fireflyluciferase vector was co-transfected. In competition assays, HEK293 cells were transfected and analyzed as above but with 1μg pEF1α -Pu.1 together with 0, 10, 100 and 1,000 ng pEF1α-Pu.2.
Microarrays
Microarray data from TER119+ E14.5 fetal liver cells
from Klf3+/+ and Klf3−/− embryos have previously been described [49]. Monoclonal K562 cell lines stably trans-fected with pEF1α or pEF1α-Pu.2 (n= 3 each) were har-vested for total RNA which was subsequently hybridized to Affymetrix Human Gene 1.0 ST arrays according
to the manufacturer’s instructions (Affymetrix, Santa
Clara, CA, USA). Hybridization and processing were performed by the Ramaciotti Centre for Gene Function Analysis (University of New South Wales, Sydney, Australia). Data were analyzed using Affymetrix® Expres-sion Console™software (Affymetrix). Microarray data are available in the Gene Expression Omnibus database [70] under accession number GSE50083.
High throughput RNA-sequencing (RNA-Seq)
RNA was extracted from TER119+-sorted liver cells
from threeKlf3+/+and threeKlf3−/−litter-matched E14.5 embryos (two litters total). Libraries were prepared using
1 μg total RNA using the TruSeq RNA Sample Prep Kit
v2 (Illumina, San Diego, CA, USA) according to the manufacturer’s instructions. The six libraries were multi-plexed into two lanes using sample specific adapters such that there were three samples per lane. 100 bp paired end reads were sequenced using TruSeq v3 SBS reagents on the Hiseq 2000 (Illumina, San Diego, CA, USA). Library preparation and sequencing were per-formed by the Ramaciotti Centre, University of New South Wales, New South Wales, Australia. Quality con-trol on the reads was performed using FastQC v0.10.1 available from [71].
200000 --no-discordant --no-mixed --b2-L 30 --b2-D 10000 --b2-R 100 -n 0 -M) [73]. The second approach used more relaxed cutoffs to better measure expression levels of non-repeat exons. This latter approach was employed to determine differential gene and isoform expression (Additional file 4: Tables S1 and Additional file 5: Table S2). Again, reads were aligned to the mm10 Mus musculusgenome using the default settings of tophat2 (v2.0.4), except for the following (discordant -M --no-coverage-search --microexon-search -n 3 --genome-read-mismatches 3 --read---genome-read-mismatches 3 --b2-sensitive -G) [73]. Transcripts were assembled using Cufflinks v2.0.2 and the mm10 annotations were included [74]. Transcripts across all replicates were merged using cuffmerge and differential expression analysis was performed pair-wise on the groups using cuffdiff. A q-value (FDR) threshold of <0.05 was used to determine significantly differentially expressed genes. RNA-Seq data have been deposited in the Gene Expression Omnibus under the accession num-ber GSE50554.
Bioinformatics
The sequence and genomic positions of ORR1A0 LTR
elements were determined using the RepeatMasker program [75] in conjunction with the University of California Santa Cruz (UCSC) Genome Browser [76]. Sequence information of retroelement families was obtained using Repbase Update [57,77]. The overlap between differentially expressed loci as measured by
RNA-Seq and ORR1A0 and ORR1A0-int elements was
established using the intersect command in Bedtools v2.17.0 [78]. Similarly, overlaps (using 100 bp windows)
were determined betweenORR1A0elements and: TRIM
28 ChIP peaks (from [40,64]); TRIM28-dependent H3K9me3 peaks (from [40]), and regions of DNA methylation in hematopoietic stem cells and erythro-blasts (from [65]). Gene Expression Omnibus accession numbers for the data sets analyzed are GSM1032198, GSM773067, GSM1032190, and GSE38354, respectively.
Additional files
Description of additional files
The following additional data are available with the on-line version of this paper. Additional file 1: Figure S1 shows that the chimeric Pu.1 transcript (Pu.2) is pre-dominantly upregulated in erythroid tissues in the ab-sence of KLF3. Additional file 2: Figure S2 shows levels of H3K9 tri-methylation at the Pu.2promoter inKlf3−/− and wild-type E14.5 fetal liver cells. Additional file 3:
Figure S3 shows that Pu.2 and other ORR1A0 chimeric
transcripts are rapidly activated by KLF1 and in the presence of cycloheximide, suggesting that they are dir-ect targets. Additional file 6: Figure S4 provides
valid-ation of genes to which the ORR1A0 exon is spliced in
Klf3−/−E14.5 TER119+ fetal liver cells. Additional file 7:
Figure S5 gives further examples of de-repressedORR1A0
transcripts in the absence of KLF3. Additional file 8: Figure S6 contains reporter assay data demonstrating the opposing transcriptional activities of PU.1 and PU.2. Additional file 4: Table S1 shows the list of genes that are significantly, differentially expressed in Klf3−/− TER119+ fetal liver cells by RNA-Seq. Additional file 5: Table S2 shows the list of genes that have significantly de-repressed isoforms. Additional file 9: Table S3 shows microarray re-sults from K562 cell stably expressing PU.2.
Additional file 1: Figure S1.The chimericPu.1transcript (Pu.2) is predominantly upregulated in erythroid tissues in the absence of KLF3. Total RNA was extracted from adult tissue from threeKlf3+/+(WT) and threeKlf3−/−(KO) mice and analyzed by quantitative real-time RT-PCR using primers specific for the exon 2b/3 junction(A)or exon 2/3 junction
(B)ofPu.1. Levels have been normalized to18SrRNA and the lowest detectable reading in each chart has been set to 1.0. Error bars represent standard error of the mean. *,P<0.05 (Student’s two-tailedt-test) compared to wild-type.
Additional file 2: Figure S2.The relative enrichment of H3K9me3 at thePu.2promoter inKlf3+/+andKlf3−/−E14.5 fetal liver cells. ChIP data have been expressed as percentage input for each locus (n =2 for each IP for Klf3+/+(WT) orKlf3−/−(Klf3 KO)). Error bars represent standard error of the mean. ThePu.2promoter shows a moderate level of H3K9 tri-methylation relative to positive (Serpina9) and negative(Gapdh) control loci.
Additional file 3: Figure S3.Pu.2andORR1A0chimeric transcripts are induced rapidly by KLF1-ER and in the presence of cycloheximide. RNA from KLF1-ER inducible B1.6 erythroblast cells was analyzed by qRT-PCR using primers specific forPu.2(A, B),ORR1A0-Znrf2(C, D), and ORR1A0-Brca2(E, F). In (A, C, and E), RNA was harvested at 0, 2, 4, 8, and 24 h following tamoxifen treatment (n= 2). In (B, D, and F), cells were treated with cycloheximide for 30 min prior to tamoxifen addition (or ethanol for untreated), with samples being taken 8 h thereafter (n= 4 for each condition). All values have been normalized to18SrRNA levels and t = 0 h time points (A, C, and E) and tamoxifen-untreated samples (B, D, and F) have been set to 1.0. Error bars represent standard error of the mean. *,P <0.05 (Student’s one-tailedt-test) compared to t = 0 h (A, C, and E) and tamoxifen-untreated (B, D, and F). N.S, not significant.
Additional file 4: Table S1.Genes that are significantly, differentially expressed inKlf3−/−TER119+fetal liver cells compared toKlf3+/+. RNA-Seq was performed on triplicate samples and differentially expressed genes were determined using a FDR cutoff of 0.05.
Additional file 5: Table S2.The list of annotated genes which have significantly de-repressed isoforms (>10-fold) inKlf3−/−TER119+fetal liver
cells compared toKlf3+/+. Eighty eight differentially expressed isoforms (FDR <0.05) were determined, covering 70 different genes.
Additional file 6: Figure S4.Confirmation of furtherORR1A0splicing events inKlf3−/−erythroid cells that were not detected by RNA-Seq analysis. RNA fromKlf3+/+(WT),Klf3+/−(HET), andKlf3−/−(KO) TER119+
E14.5 fetal liver cells were analyzed by real-time RT-PCR using forward primers specific forORR1A0and reverse primers recognizing downstream exons of theCd59b(A),Tmx4(B), andBzw2,Cpe, andTcfl5(C)genes. (A and B) Values have been normalized to18SrRNA levels and WT samples have been set to 1.0. Error bars represent standard error of the mean (n= 2 WT, 3 HET, and 3 KO). *,P <0.05 (Student’s two-tailedt-test) compared to bothKlf3+/+andKlf3+/−.(C)For these genes, the spliced transcripts were below the level of detection inKlf3+/+cells and thus
could not be quantified. RT-PCR products were electrophoresed on a 3% agarose gel and stained with ethidium bromide.
Additional file 7: Figure S5.Further examples of de-repressedORR1A0 transcripts in the absence of KLF3. As in Figure 6, tracks represent RNA-Seq reads and splicing events forKlf3+/+(WT) andKlf3−/−(KO) E14.5 TER119+fetal
downstream exons ofZnrf2(A) andBrca2(B), which in turn are expressed at a significantly higher level in KO cells.(C)Spliced transcripts initiating nearby to anORR1A0LTR are antisense to an annotated gene (Dhx57).
(D)De-repressed transcription of anORR1A0/ORR1A0-intcassette does not alter the expression of the surrounding gene (Drosha).
Additional file 8: Figure S6.PU.2 opposes the transcriptional activity of PU.1. HEK293 cells were transfected with pLightSwitchRenillaluciferase reporter vector (promoter-less or containing theCLEC5Apromoter). In
(A), increasing amounts of pEF1α-Pu.1 have been co-transfected, while in
(B), a steady amount of pEF1α-Pu.1 has been co-transfected together with increasing doses of pEF1α-Pu.2. In all experiments, pGL4.23[luc2/ minP]Fireflyluciferase vector was included as a transfection control and used for normalization. The means of triplicate experiments are shown and error bars represent standard error of the mean. *,P<0.05 (Student’s two-tailedt-test) compared to pLightSwitch-Clec5a wells transfected with 0 ng pEF1α-Pu.1 (A) or 0 ng pEF1α-Pu.2 (B).
Additional file 9: Table S3.Erythroid genes are upregulated upon forced expression of PU.2 in K562 cells. Microarrays were performed on monoclonal K562 cell lines stably transfected with pEF1α-Pu.2 or pEF1α. A selection of erythroid genes that are upregulated >2-fold in cells expressing PU.2 is shown.
Competing interests
The authors declare that they have no competing interests.
Authors’contributions
KSM, APWF, JB, and LJN performed experiments and analyzed data. Specifically, APWF, KSM, and LJN performed cell sorting experiments and qRT-PCR. KSM conducted 5′RACE, histone ChIPs, reporter assays, western blots, and microarrays. APWF and KSM carried out EMSA experiments and generated the stable K562 lines. APWF performed B1.6 cell work. APWF and JB designed, performed and analyzed the RNA-Seq and conducted bioinformatics comparisons. APWF, MC, and RCMP contributed to overall design of the study and directed research. APWF, KSM, JB, MC, and RCMP wrote the paper. All authors read and approved the final manuscript.
Acknowledgements
This work has been supported by funding from the Australian Research Council and the National Health and Medical Research Council. We would like to thank Natalie Twine for advice with bioinformatics.
Published: 30 April 2014
References
1. Mouse Genome Sequencing Consortium, Waterston RH, Lindblad-Toh K, Birney E, Rogers J, Abril JF, Agarwal P, Agarwala R, Ainscough R, Alexandersson M, An P, Antonarakis SE, Attwood J, Baertsch R, Bailey J, Barlow K, Beck S, Berry E, Birren B, Bloom T, Bork P, Botcherby M, Bray N, Brent MR, Brown DG, Brown SD, Bult C, Buton J, Butler J, Campbell RD,et al:Initial sequencing and compara-tive analysis of the mouse genome.Nature2002,420:520–562.
2. Kazazian HH Jr:Mobile elements: drivers of genome evolution.
Science2004,303:1626–1632.
3. Bourque G:Transposable elements in gene regulation and in the evolution of vertebrate genomes.Curr Opin Genet Dev2009,19:607–612. 4. Bourque G, Leong B, Vega VB, Chen X, Lee YL, Srinivasan KG, Chew JL,
Ruan Y, Wei CL, Ng HH, Liu ET:Evolution of the mammalian transcription factor binding repertoire via transposable elements.Genome Res2008,
18:1752–1762.
5. Kunarso G, Chia NY, Jeyakani J, Hwang C, Lu XY, Chan YS, Ng HH, Bourque G:Transposable elements have rewired the core regulatory network of human embryonic stem cells.Nat Genet2010,42:631–634.
6. Schmidt D, Schwalie PC, Wilson MD, Ballester B, Goncalves A, Kutter C, Brown GD, Marshall A, Flicek P, Odom DT:Waves of retrotransposon expansion remodel genome organization and CTCF binding in multiple mammalian lineages.Cell2012,148:335–348.
7. Baillie JK, Barnett MW, Upton KR, Gerhardt DJ, Richmond TA, De Sapio F, Brennan PM, Rizzu P, Smith S, Fell M, Talbot RT, Gustincich S, Freeman TC, Mattick JS, Hume DA, Heutink P, Carninci P, Jeddeloh JA, Faulkner GJ:
Somatic retrotransposition alters the genetic landscape of the human brain.Nature2011,479:534–537.
8. Ward MC, Wilson MD, Barbosa-Morais NL, Schmidt D, Stark R, Pan Q, Schwalie PC, Menon S, Lukk M, Watt S, Thybert D, Kutter C, Kirschner K, Flicek P, Blencowe BJ, Odon DT:Latent regulatory potential of human-specific repetitive elements.Mol Cell2013,49:262–272. 9. Thornburg BG, Gotea V, Makalowski W:Transposable elements as a significant
source of transcription regulating signals.Gene2006,365:104–110. 10. Johnson R, Gamblin RJ, Ooi L, Bruce AW, Donaldson IJ, Westhead DR, Wood
IC, Jackson RM, Buckley NJ:Identification of the REST regulon reveals extensive transposable element-mediated binding site duplication.
Nucleic Acids Res2006,34:3862–3877.
11. Wang T, Zeng J, Lowe CB, Sellers RG, Salama SR, Yang M, Burgess SM, Brachmann RK, Haussler D:Species-specific endogenous retroviruses shape the transcriptional network of the human tumor suppressor protein p53.Proc Natl Acad Sci USA2007,104:18613–18618.
12. Wang J, Zhuang J, Iyer S, Lin X, Whitfield TW, Greven MC, Pierce BG, Dong X, Kundaje A, Cheng Y, Rando OJ, Birney E, Myers RM, Noble WS, Snyder M, Weng Z:Sequence features and chromatin structure around the genomic regions bound by 119 human transcription factors.Genome Res 2012,22:1798–1812.
13. Lynch VJ, Leclerc RD, May G, Wagner GP:Transposon-mediated rewiring of gene regulatory networks contributed to the evolution of pregnancy in mammals.Nat Genet2011,43:1154–1159.
14. Chuong EB, Rumi MAK, Soares MJ, Baker JC:Endogenous retroviruses function as species-specific enhancer elements in the placenta.
Nat Genet2013,45:325–329.
15. Morgan HD, Sutherland HG, Martin DI, Whitelaw E:Epigenetic inheritance at the agouti locus in the mouse.Nat Genet1999,23:314–318. 16. Duhl DM, Vrieling H, Miller KA, Wolff GL, Barsh GS:Neomorphic agouti
mutations in obese yellow mice.Nat Genet1994,8:59–65.
17. Faulkner GJ, Kimura Y, Daub CO, Wani S, Plessy C, Irvine KM, Schroder K, Cloonan N, Steptoe AL, Lassmann T, Waki K, Horniq N, Arakawa T, Takahashi H, Kawai J, Forrest AR, Suzuki H, Hayashizaki Y, Hume DA, Orlando V, Grimmond SM, Carninci P:The regulated retrotransposon transcriptome of mammalian cells.Nat Genet2009,41:563–571.
18. Fadloun A, Le Gras S, Jost B, Ziegler-Birling C, Takahashi H, Gorab E, Carninci P, Torres-Padilla ME:Chromatin signatures and retrotransposon profiling in mouse embryos reveal regulation of LINE-1 by RNA.Nat Struct Mol Biol 2013,20:332–338.
19. Schmitz J, Brosius J:Exonization of transposed elements: a challenge and opportunity for evolution.Biochimie1928–1934,2011:93.
20. Macfarlan TS, Gifford WD, Driscoll S, Lettieri K, Rowe HM, Bonanomi D, Firth A, Singer O, Trono D, Pfaff SL:Embryonic stem cell potency fluctuates with endogenous retrovirus activity.Nature2012,487:57–63.
21. Cohen CJ, Lock WM, Mager DL:Endogenous retroviral LTRs as promoters for human genes: a critical assessment.Gene2009,448:105–114. 22. Batut P, Dobin A, Plessy C, Carninci P, Gingeras TR:High-fidelity promoter
profiling reveals widespread alternative promoter usage and transposon-driven developmental gene expression.Genome Res2013,23:169–180. 23. Shukla R, Upton KR, Munoz-Lopez M, Gerhardt DJ, Fisher ME, Nguyen T,
Brennan PM, Baillie JK, Collino A, Ghisletti S, Sinha S, Ianelli F, Radaelli E, Dos Santos A, Rapoud D, Guettier C, Samuel D, Natoli G, Carninci P, Ciccarelli FD, Garcia-Perez JL, Faivre J, Faulkner GJ:Endogenous retrotransposition activates oncogenic pathways in hepatocellular carcinoma.Cell2013,153:101–111. 24. Faulkner GJ:Retrotransposons: mobile and mutagenic from conception
to death.FEBS Lett2011,585:1589–1594.
25. Hancks DC, Kazazian HH Jr:Active human retrotransposons: variation and disease.Curr Opin Genet Dev2012,22:191–203.
26. Lamprecht B, Walter K, Kreher S, Kumar R, Hummel M, Lenze D, Kochert K, Bouhlel MA, Richter J, Soler E, Stadhouders R, Johrens K, Wurster KD, Callen DF, Harte MF, Giefing M, Barlow R, Stein H, Anagnostopoulos I, Janz M, Cockerill PN, Siebert R, Dorken B, Bonifer C, Mathas S:Derepression of an endogenous long terminal repeat activates the CSF1R proto-oncogene in human lymphoma.Nat Med2010,16:571–579.
27. Karimi MM, Goyal P, Maksakova IA, Bilenky M, Leung D, Tang JX, Shinkai Y, Mager DL, Jones S, Hirst M, Lorincz MC:DNA methylation and SETDB1/ H3K9me3 regulate predominantly distinct sets of genes, retroelements, and chimeric transcripts in mESCs.Cell Stem Cell2011,8:676–687. 28. Rowe HM, Trono D:Dynamic control of endogenous retroviruses during
development.Virology2011,411:273–287.