5
IX
September 2017
A GIS Based Study of Urbanization Impact on
Land Surface Temperature in Greater Noida, India
Madhuri Kumari1, Noyingbeni Kikon2, Ambrina Sardar Khan3, Prateek Srivastava3 1
Department of Civil Engineering, Amity School of Engineering & Technology, Email ID:[email protected] 2
Amity Institute of Geo-informatics and Remote Sensing, Amity University, Sector125, Noida, India 3
Amity Institute of Environmental Sciences, Amity University, Sector125, Noida, India
Abstract: Urbanization has a dynamic relationship with the environment which involves large scale changes in the land use pattern of an area. Human induced land use land cover (LULC) changes have become major driver of the global climatic change. In general urbanization affects the interactions between the surface temperature and atmosphere at spatial and temporal scales. The objective of this study is to analyze whether the changes in the land use land pattern of Greater Noida is contributing to the change of its land surface temperature (LST). Geographic Information System (GIS) was used to extract information from satellite images of three years namely, 2000, 2011, and 2013. The biophysical parameter Normalized Difference Vegetation Index (NDVI) was calculated from satellite images for examining the relationship between land surface temperature and vegetation. The results showed that there has been a 35.23% increase in the settlement and developed lands from 2000 to 2013 leading to a sharp decline of 91.14 % in the cultivation and others. Forest and urban vegetation was decreased by 4.06% from 2000 to 2010 but during 2013 the forest and urban vegetation was found to have increased by 7.45%. There has been a 1ºC to 2ºC rise in the surface temperature in Greater Noida since 2000 to 2013.
Keywords: Urbanization; LST; NDVI; LULC; GIS
I. INTRODUCTION
Urbanization is a strong and complex phenomenon involving large scale changes in the land use of an area. An upsurge in the human population in urban areas and cities have been reportedly found to have increased from 29% in 1950 to 49% in 2005 and by 2030 urbanization is expected to increase even further to 60% [United Nations, 2005]. One significance observed due to increased urbanization is a greater attention is generated towards urban meteorology as this governs the quality of an environment (Steeneveld et al., 2011). In order to help improve urban planning to avoid the occurrence of meteorological conditions that are hostile to the human populace, an improved understanding of urban environmental meteorology is required (Dieleman et al., 2002;Dimoudi and Nikolopoulou, 2003;Svensson and Eliasson, 2002; Vonk et al., 2007, Coutts et al., 2008; Mills, 2009;Reid et al., 2009). It was witnessed that as compared to the rural areas, the urban areas experience a considerably diverse meteorological condition (Oke, 1982; Godowitch et al., 1985). The surface temperature variation is one of the most important effects caused by the process of urbanization. The open lands are getting replaced by buildings, roads, parking lots and pavements and these urban areas have a greater thermal conductivity and capacity whichgenerally stores the heat absorbed during the day time and releasing heat slowly at night (Noyingbeni et al., 2016). This process usually leads to alteration of the climate that is warmer than the surrounding nearby rural areas and this is known as urban heat island (UHI) (Voogt & Oke, 2003). As the temperature increases, the pollution level in an urban area rises due to the increasing demand for air conditioning all these factors alters the precipitation patterns of an area. Former studies have discovered that the intensity of UHI increases with an increase in the size of the city, infrastructures and population (Oke 1973; Landsberg 1981; Atkinson 2003).
Vegetation Index (NDVI), Leaf Area Index (LAI), Surface Albedo, Surface Emissivity and Land Surface Temperature were prepared using ERDAS software spatial modelling. The results showed that maximum land surface temperature between urban and surrounding area is 12ºC with the industrial and impervious surfaces having the highest temperature with a temperature of 32ºC while the areas covered by vegetation and water bodies exhibited a minimum temperatures of 20ºC.From the results obtained, it is well understood that the land surface temperature holds a positive correlation with the dense built up areas and negative correlation in the areas occupied by vegetation cover (Faris and Sudhakar, 2010).
With the advancement of remote sensing technology, it became possible to observe the changes in temperature of an area using thermal remote sensing and this has provided new platforms for the observation of urban heat island study. Rao (1972) was the first person to illustrate that the thermal infrared data acquired by a satellite could be used for analyzing the temperature of an urban area. The intensity of UHI is also related to changing patterns of land use/land cover i.e., their composition of vegetation, water, and built-up. The purpose of this study carried out is for examining the changes in the land use/land cover pattern in which built up is expanding rapidly due to urbanization taking place on a large scale. NDVI was also used to extract the land use information of the vegetation cover over different time periods and then the surface temperature retrieved from the thermal band of Landsat data’s were used for analyzing the effect of UHI. The main aim of this paper are: (1) to perform Land use/ Land cover changes for the years 2000, 2010 and 2013; (2) to derive the land surface temperature from the thermal band of Landsat data’s for the years 2000, 2010 and 2013; (3) to examine the spatial patterns of vegetation cover over the three years and; (4) to study the relationship between temperature with LULC and NDVI and observe the changes that has taken place over time.
II. STUDY AREA
Greater Noida Industrial Development Authority is situated in the Gautam Buddha Nagar district of the northern Indian state of Uttar Pradesh. It is one of the National Capital Region of New Delhi, the capital of India and is adjacent to Noida. Greater Noida was once a part of Noida during the 1990s but today it is known as Greater Noida. It is located at 29.496152°N latitude and 77.536011°E longitude with a total area of 238.64 sq.km and population census of over 100,000. This Greater Noida is becoming one of the commercial hubs and one of the smartest cities of India and as a consequence attracting a large number of populations. The climate of Greater Noida is known as local steppe climate. The climate is generally hot and humid for most of the year and summer months are extremely hot followed by foggy and cold weather during the winter season. It receives and average annual rainfall of 93.2 cm (36.7 inches) (http://en.climate-data.org/location/50512/). The Greater Noida expressway is also one of the most important highways which join the Yamuna expressway and it also connects to a lot of important places.
Figure 1: Location map of Study area
III. METHODS
A. Image pre-processing
B. Image Classification
For analyzing the impact of urbanization on a regional scale, a land use land cover classification is necessary to see the change of an area from 2000 to 2013. In this study the Landsat ETM data of 2000, Landsat TM data of 2010 and Landsat 8 DATA of 2013 were used. Supervised Classification was used for carrying out the image classification process in which the method of Maximum Likelihood Classifier has been used. Maximum Likelihood Classifier is a technique in which the pixels are allottedbased on the class of highest probability. The categories include: (1) Settlement and Developed lands, (2) Forest and Urban Vegetation, (3) Cultivation and others (4) Water. Change detection of these classified images have been performed using the before and after images for the years 2000, 2010 and 2013 respectively.
C. Derivation of LST and NDVI from the Landsat imageries
1) Derivation of land surface temperature: Land surface temperature (LST) is defined as the hotness or coldness of an area, which plays an important role in the wide variety of scientific studies such as in the process of energy and water exchanges within the atmosphere (Liang and Zhang et al., 2013). For obtaining the LST, the thermal infrared (TIR) remote sensing delivers a unique method at the global and regional scales as maximum of the energy recorded by the sensor is this spectral region is emitted straight from the surface region (Jimenez et al.,2008). For the derivation of LST from a satellite data, the thermalband 6 of Landsat TM and Landsat ETM with a spectral range from 10.40 to 12.50 and thermal band 10 of Landsat 8 with spectral range from 10.60 to 11.19 have been used in this paper. Three steps were proposed by Yuan and Bauer (2005) for deriving LST in which the first steps includes the conversion of the digital number’s (DNs) of band 6 of Landsat TM and ETM and DNs of band 10 of Landsat 8 to top-of-atmospheric (TOA) radiance (Lλ).
i) (Eq.[1])has been used for the conversion of the DN’s of band 6 of Landsat TM and Landsat ETM to radiance values:
CVR1 = ( (( )) ∗( ) ) (1)
where, LMIN
λ= Spectral radiance scales to QCALMIN, LMAX
λ= Spectral radiance scales to QCALMAX
QCALMIN = the minimum quantized calibrated pixel value (typically 1) QCALMAX = the maximum quantized calibrated pixel value (typically 255) CVR1is the cell value as radiance
ii) (Eq.[2]) has been used for the conversion of the DN’s of band 10 of Landsat 8 to radiance values:
Lλ = MLQCal + AL
(2)
where,
ML = Band-specific multiplicative rescaling factor from the metadata (RADIANCE_MULT_BAND_x, where x is the band number) AL = Band-specific additive rescaling factor from the metadata (RADIANCE_ADD_BAND_x, where x is the band number) QCal = Quantized and calibrated standard product pixel values (DN)
L
λ = TOA spectral radiance (Watts/ (m 2
× srad × μm))
Then, using the Planck curve (Eq. [3]), the radiance value has been converted to surface temperature (Chander and Markham, 2003):
Tk = (3)
where,
Tk= the temperature in Kelvin (K) and K1 and K2 are as follows:
Table 1: Values of K1 and K2
Landsat TM Landsat ETM Landsat 8
K1 607.76 666.09 774.89
The final surface temperature is then calculated to Celsius (˚C) using the following equation:
Tc = Tk−273.15
− (4)
where,
Tc= the temperature in Celsius (˚C)
Tk= the temperature in Kelvin (K)
2) Derivation of Normalized Difference Vegetation Index (NDVI): Normalized difference vegetation index (NDVI) according to (Myneni et al., 2001; Chen and Brutsaert, 1998) may be used is used to measure and monitor plant growth, vegetation cover and biomass production. Values of NDVI ranges between -1 to +1 in which the values between 0.3 to 0.8 represents a dense vegetation canopy, soils between 0.1 to 0.2 reflects near infrared spectral and clear water is indicated by very low positive or even slightly negative values.NDVI were calculated as the ratio between the red and near infrared (NIR) portion of the spect rum from reflectance measurements images using the following formula:
NDVI = (5)
where,
NIR = Band 4 (For Landsat TM and ETM) and Band 5 (For Landsat 8) R = Band 3 (For Landsat TM and ETM) and Band 4 (For Landsat 8).
IV. RESULTS AND DISCUSSION
A. Change in the pattern of Land use/Land cover
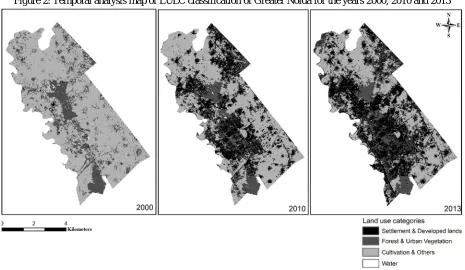
In Greater Noida, the growth in the urban land is identified by the unplanned urbanization which is taking place and is ineffectively regulated. A very fast growth in terms of population as well as urbanization has taken place which has caused degradation of the agricultural areas as these agricultural areas are converted to urban areas in whichthe barren landsare replaced by buildings, roads, pavements and other infrastructures causing an overall impact on the environment of an area. The dates of the fractions were classified into thematic maps. Figs. 2 show the classified maps.
The changes in the LULC of Greater Noida were further illustrated In Table 1. In Greater Noida area (238.64 sq.km), the settlement/developed lands has increased rapidly from 2000 to 2013, which grew from 2.39 % in 2000 to 30.27 % in 2010 and 37.62 in 2013. This shows how quickly urbanization is taking place in this region over the period of years. Simultaneously, the areas under urban vegetation were found to be increasing over the years from 2000 to 2013.
Most of the cultivated and other open lands were found to have the maximum impact of urbanization in which these lands are now filled up by the various built up and other infrastructures.
The increase was also evident between 2000 and 2013 when the cultivation and other open land category was decreased by 78.33 %( 186.94 sq.km area) in 2000 to 54.47 %( 130 sq.km area) in 2010 which further shrunk to 40.14 %( 95 sq.km) in 2013 of the total area 238.64 sq.km which was converted to other land use.
Vegetation/green cover was found to be 18.73 % in 2000 and a decline in the percentage of vegetation was observed in 2010 which shrunk to 14.67 % in 2010 and over the period of time along with the expansion in urbanization the vegetative area was also observed to have increased to 22.12 %. This is because with the increase in urbanization, the urban plantations are also found to be increasing and also the various government policies which are coming up like green Delhi organization, conservation of forest etc. are enforcing rules for plantation.Thus, most of the increase in the urban area resulted from the conversion of agricultural land, most of which included land rice cultivation. Urbanization has a negative impact in the environment mainly by the production of pollution and this changes the chemical as well as the physical property of the atmosphere.
The natural surfaces often consist of vegetation and moisture trapping soils so they use mainly a large proportion of the radiations absorbed and releases water vapor which contributes to cool the air during the process of evapotranspiration.
On the other hand,settlement/built up areas comprises of high percentages of water resistant construction materials and non-reflective substances.
Table 2: Table showing the change in the LULC of Greater Noida between 2000, 2010 and 2013 (Area in sq.km and Percentage) Change in the Land use/Land cover between 2000,2010 & 2013 for Greater Noida
Area (in Sq. km and Percentage) Changes observed
May 2000 May 2010 May 2013 2000-2010 2010-2013 2000-2013
Settlement and Developed lands 5.71 (2.39%) 72.24 (30.27%) 89.8 (37.62%) 66.53 (27.88%) 17.56 (7.3%) 84.09 (35.23%) Forest & Urban
Vegetation 44.71 (18.73%) 35.01 (14.67%) 52.8 (22.12%) -9.7 (-4.06%) 17.79 (7.45%) 8.09 (3.39%)
Water 1.28
(0.53%) 1.38 (0.57%) 0.2 (0.08%) 0.1 (0.04%) -1.18 (-0.49%) -1.08 (-0.45%) Cultivation & others 186.94 (78.33%) 130 (54.47%) 95.8 (40.14%) -56.94 (-23.86%) -34.2 (-14.33%) -91.14 (-38.19%)
Figure 2: Temporal analysis map of LULC classification of Greater Noida for the years 2000, 2010 and 2013
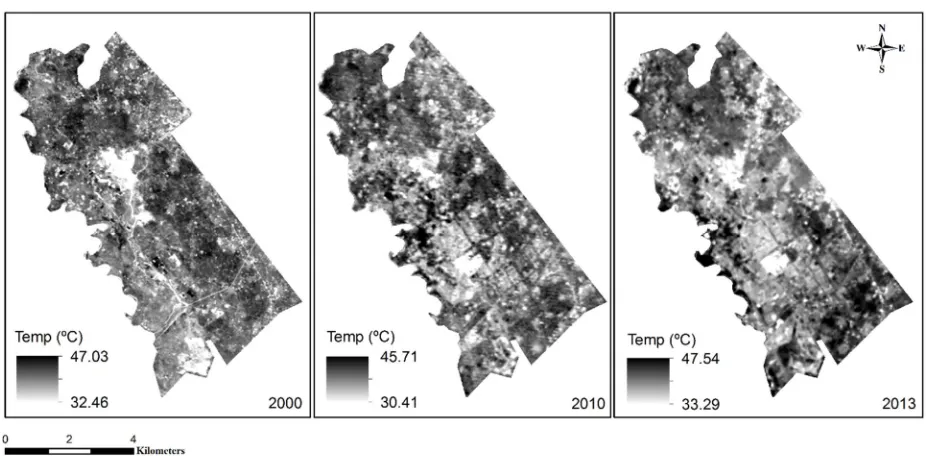
B. Impact of Land use/Land cover on LST
[image:6.612.74.539.257.527.2]in cultivation and other open lands due to the emissivity property which was less harmful as the radiations are reflected back immediately without being stored and secondly it is followed by built up but the temperature in these area is more harmful as the temperatures are trapped which later slowly release the heat. And then followed by vegetation and water bodies which have a very high emissivity property which traps the incoming radiations
Table 3: Table showing the temporal analysis of LST of Greater Noida for the years 2000, 2010 and 2013 Temporal analysis of LST for Greater Noida (°C)
Minimum Maximum Mean
1st May 2000 32.46 47.03 39.74
5th May 2010 30.41 45.71 38.06
29th May 2013 33.29 47.54 40.41
Figure 3: Temporal analysis map of LST of Greater Noida for the years 2000, 2010 and 2013
Figure 4: Bar graph showing mean LST of Greater Noida for the years 2000, 2010 and 2013
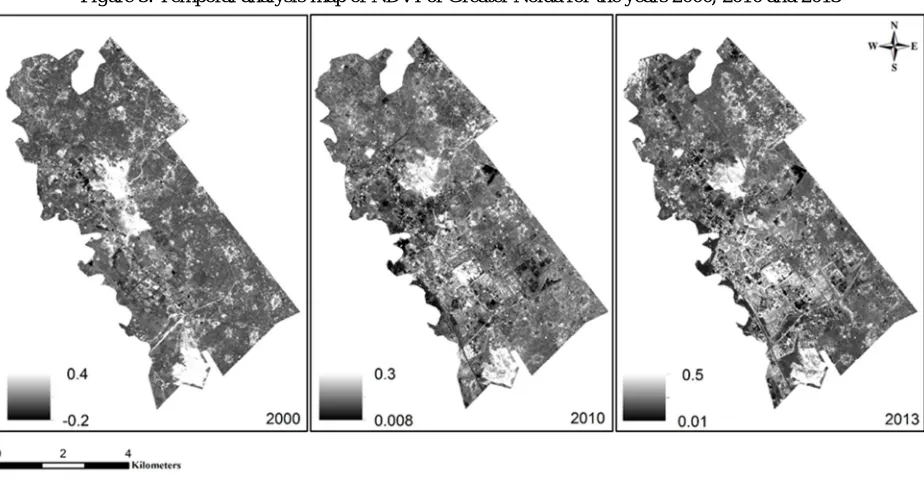
C. Impact of Land use/Land cover on NDVI
[image:7.612.174.442.492.637.2]Figure 5: Temporal analysis map of NDVI of Greater Noida for the years 2000, 2010 and 2013
V. CONCLUSION
This study has analyzed the changes in the Land use/Land cover of the city of Greater Noida °from the year 2000 to 2013. The results showed that the built up areas have increased rapidly which the cultivated and other open lands have shrunk. The change was evident between 2000 and 2010 when the cultivated and other land minimized by 23.86% and during 2013 it had further shrinked by 38.19% of the total area and was converted to other land use categories. The changes observed in the Land use/Land cover category were largely due to the population flocking into this part of the city and this resulted in the poor land use planning and inconsistency of the government policies. The changes in the Land use/Land cover were also accompanied by the change in the LST in which the overall trend of the mean temperature was found to have increased from 44ºC in 2000 to 45.5 ºC during 2013. Also the NDVI was analyzed and the trend showed that vegetation has increased from 2000 to 2013 which comprises mainly of urban plantation along the built up category. This study made it possible to examine the effects of human activities on environment.
REFERENCES
[1] Atkinson, B. W. Numerical modeling of urban heat island intensity. Bound.-Layer Meteor., 109: 285– 310, 2003.
[2] Brazel, A., N. Selover, R. Vose, and G. Heisler. The tale of two climates—Baltimore and Phoenix urban LTER sites. Climate Res., 15: 123–135. 2000. [3] Chander, G., Markham, B. Revised Landsat-5 TM Radiometric Calibration Procedures and Post calibration Dynamic Ranges. IEEE transactions on
Geoscience and remote sensing, vol. 41, no. 11, 2003.
[4] Chen, D., Huang, J., Jackson, J. Vegetation water content estimation for corn and soybeans using spectral indices derived from MODIS near- and short-wave infrared bands. Remote Sensing of Environment, 98:225 – 236, 2005.
[5] Coutts, A. M., J. Beringer, and N. J. Tapper. Investigating the climatic impact of urban planning strategies through the use of regional climate modelling: A case study for Melbourne, Australia. Int. J. Climatology., 28:1943–1957. doi:10.1002/joc.1680, 2008.
[6] Dieleman, F. M., M. J. Dijst, and G. Burghouwt. Urban form and travel behavior: Micro‐level household attributes and residential context. Urban Stud., 39: 507–527. doi: 10.1080/00420980220112801, 2002.
[7] Dimoudi, A., and M. Nikolopoulou (2003). Vegetation in the urban environment:Microclimate analysis and benefits. Energy Build, 35: 69–76.doi: 10.1016/S0378-7788(02)00081-6, 2002.
[8] Faris,A.A., Reddy,S. Estimation of Urban Heat Island Using Landsat ETM+ Imagery at Chennai City - A Case Study. International Journal of Earth Sciences and Engineering, 3(3):332-340, 2010.
[9] Godowitch, J. M., J. K. S. Ching, and J. F. Clarke. Evolution of the nocturnal inversion layer at an urban and nonurban site. J. Clim. Appl. Meteorol., 24: 791– 804. doi: 10.1175/1520-0450(1985)024<0791: EOTNIL2.0.CO; 2, 1985.
[10] J.A. Voogt, T.R. Oke. Thermal remote sensing of urban climates, Remote Sensing of Environment, 86:370–384, 2003.
[11] Jimenez-Munoz, J.C.; Sobrino, J.A. Split-window coefficients for land surface temperature retrieval from low-resolution thermal infrared sensors. IEEE Geosci. Remote Sens. Lett, 5:806–809, 2008.
[12] Kikon, N., P.Singh., S.K Singh., Anjana Vyas. Assessment of urban heat islands (UHI) of Noida City, India using multi-temporal satellite data, Sustainable Cities and Soc., 22:19-28. doi:10.1016/j.scs.2016.01.005, 2016.
[15] Myneni, R. B., Hoffman,S., Knyazikhin,Y., Privette,J.L., Glassy, J., Tian,Y., Wang, Y., Song, X., Zhang, Y., Smith, G.R., Lotsch, A., Friedl, M., Morisette, J.T., Votava, P.,Nemani,R.R; Running,S.W. Global products of vegetation leaf area and fraction absorbed PAR from year one of MODIS data. Remote Sensing of Environment, 83:214–231, 2002.
[16] Oke, T. R. City size and the urban heat island. Atmos. Environ, 7:769–779, 1973.
[17] Oke, T. R. The energetic basis of the urban heat island. Q. J. R. Meteorol. Soc., 108: 1–24, doi:10.1002/qj.49710845502, 1982. [18] Rao, P. K. Remote sensing of urban "heat islands" from an environmental satellite. Bull. Amer. Meteor. Soc., 53: 647-648, 1972.
[19] Reid, C. E., M. S. O’Neill, C. J. Gronlund, S. J. Brines, D. G. Brown, A. V. Diez‐Roux, and J. Schwartz. Mapping community determinants of heat vulnerability. Environ. Health Perspect, 117:1730–1736.doi:10.1289/ehp.0900683, 2009.
[20] Steeneveld, G. J., S. Koopmans, B. G. Heusinkveld, L. W. A. van Hove, and A. A. M. Holtslag . Quantifying urban heat island effects and human comfort for cities of variable size and urban morphology in the Netherlands. J. Geophys. Res., 116, D20129, doi:10.1029/2011JD015988, 2011.
[21] Svensson, M. K. Sky view factor analysis‐implications for urban air temperature differences. Meteorol. Appl., 11: 201–211. doi: 10.1017/S1350482704001288, 2004.
[22] Viterito, A.. Changing thermal topography of the Baltimore-Washington corridor: 1950–1979. Climatic Change, 14: 89–102, 1989.
[23] Vonk, G., S. Geertman, and P. Schot. A SWOT analysis of planning support systems. Environ. Plan. A, 39: 1699–1714. doi: 10.1068/a38262, 2007. [24] Yuan, F., Bauer, M.E., Heinert, N.J. and Holden, G. Multi-Level Land Cover Mapping of the Twin Cities (Minnesota) Metropolitan Area with Multi Seasonal
Landsat TM/ETM+ Data. Geocarto International, 20: 5-13. http://dx.doi.org/10.1080/10106040508542340, 2005.
[25] Zhang, L., Shou, Y.X., Dickerson, R., Chen. F. Impact of Upstream Urbanization on the Urban Heat Island Effects along the Washington–Baltimore Corridor. Journal of App. Meteorology and Climatology. 50: 2012–2029. doi: http://dx.doi.org/10.1175/JAMC-D-10-05008.1, 2011.