www.ijraset.com Volume 4 Issue II, February 2016 IC Value: 13.98 ISSN: 2321-9653
International Journal for Research in Applied Science & Engineering
Technology (IJRASET)
Power Factor Correction by Implementation of
Reactive Power Compensation Methods of 220 KV
Substation MPPTCL Narsinghpur
Ria Banerjee1, Prof. Ashish Kumar Couksey2
1
Department of Energy Technology, Takshshila Institute of Engineering and Technology, Jabalpur Madhya Pradesh, India 2
Department of Electrical and Electronics, Takshshila Institute of Engineering and Technology, Jabalpur Madhya Pradesh, India
Abstract - In an electric power system, which is AC (alternating current) by nature forms the most advantageous, the equipments and other industrial inductive loads draw reactive power and suffer with the problem of power factor improvement. This also greatly affects and deteriorates the voltage profile of the system. Low voltage profile may cause power losses in the system, low performance in the appliances and industrial machineries. Sometimes it may cause severe damage to the appliances and loss in productions.
Keywords - Capacitor bank, power factor improvement, transmission lines, VAR compensation, voltage profile improvement
I. INTRODUCTION
An electric power system is known to be comprised of electrical network components used to supply, transfer and use of electric power. An example of an electric power system is the network that supplies a region’s homes and industry with power- for sizeable regions, hence power system is known as grid and can be broadly divided into:
A. Generators that supply the power.
B. The transmission system that carries the power from the generating centers to the load centers &
C. The distribution system that feeds the power to nearby homes and industries
Smaller power systems are also found in industry, hospitals, commercial buildings and homes. The majority of these systems rely upon three – phase ac power .The standard for large- scale power transmission and distribution across the modern world.
II. METHODOLOGY
Most ac electric machines draw apparent power in terms of kilovolt amperes (KVA) which is in excess of the useful power, measured in kilowatts (KW), required by the machine. The ratio of these quantities (KW/KVA) is called the power factor cos ø and is dependent on the type of machine in use. A large proportion of the electric machinery used in industry has an inherently low pf, which means that the supply authorities have to generate much more current than is theoretically required. In addition, the transformers and cables have to carry this high current. When the overall pf of a generating station’s load is low, the system is inefficient and the cost of electricity correspondingly high. To overcome such conditions of low power factor supply authorities often impulse penalties.
220 KV substation MPPTCL Narsinghpur is one of transmission company’s substations and is located at Narsinghpur district. It is a major and vital transformation and switching substation of the company. It is established in the year 1995 having total installed capacity of 320MVA (2x160MVA auto-transformer) at 220/132 KV level. Along with this there are 83MVA capacity (1x63MVA and 1x20MVA two winding transformer) at 132/33 KV level as shown in single line diagram.
III. PRIOR APPROACH
Technology (IJRASET)
Figure 1. Single line diagram for 220 KV Narsinghpur
A. Issues related to power factor at site
For better efficiency and economic operation of a system, it is desirable that load should draw a small reactive power from the system and its power factor be improved. The cosine of the phase angle between KVA and KW represents the power factor of the load. The KVAR drawn by capacitor is “leading” i.e. In phase opposition of lagging KVAR of the load. Thus, the resultant
KVAR is now smaller and the new power factor (cos ǿ2) is increased. The improved value of power factor from cos ǿ1 to cos ǿ2 is
controlled by the KVAR rating of capacitor connected with the load.
For reducing the transmission / distribution losses and also for voltage improvements, the reactive power drawls from the system should be as minimum as possible. When the reactive power drawls is more, current increases and with increased current, the voltage drop increases thereby the voltage is reduced at the supply point, this condition is expressed stating that power factor is poor. The improved power factor of load has one or more of the following advantages:
1) Voltage profile improvement at remote end.
2) Reduced losses in 160MVAx2 220/132/33 KV transformers connected between 220 KV and 132 KV bus inside the
substation
3) Release of KVA capacity in the transformer for same KW, thus permitting additional loading. Line loss reduction.
IV. OUR APPROACH
The most economical and reliable method of compensation and improvement of power factor is installation of shunt capacitors. As far as energy data is recorded, the two sources at 132 KV bus namely 160MVA transformers imports 75 MVAR(approx) of reactive power and 320MVA apparent power from 220 KV grid to 132 KV bus for supplying the loads of whole Narsinghpur district ( log records attached).
A. Study of power inflow and outflow at 132 KV bus 1) Log sheet data before pf correction
Table I. Data before Power Factor Correction
S. No Name of feeder / transformer bay at
132 KV bus
MW input at 132 KV bus
MW output at 132 KV bus
MVAR input at 132 KV bus
MVAR output at 132 KV bus
1 160 MVA BHEL transformer 100 MW 0 36 MVAR 0
2 160 MVA CGL transformer 100 MW 0 34 MVAR 0
3 132 KV barman-1 feeder 0 40 MW 0 14 MVAR
4 132 KV barman-2 feeder 0 40 MW 0 14 MVAR
5 132 KV Narsinghpur-1 feeder 0 25 MW 0 8.75 MVAR
6 132 KV Narsinghpur-2 feeder 0 25 MW 0 8.75 MVAR
[image:3.612.46.564.568.729.2]www.ijraset.com Volume 4 Issue II, February 2016 IC Value: 13.98 ISSN: 2321-9653
International Journal for Research in Applied Science & Engineering
Technology (IJRASET)
Table II Bus Voltages and Power Factor before Addition of Capacitor Bank
Bus Standard Voltage Bus Voltage Before Pf
Correction
Bus Power Factor Before Pf Correction
132 KV bus 132.02 KV 0.82
33 KV bus 32.9 KV 0.81
Table 3 Log Sheet Data after Power Factor Correction
Sr. No.
Name of feeder /
transformer bay at 132 KV bus
MW input at 132 KV bus
MW output at 132 KV bus
MVAR input at 132 KV bus
MVAR output at 132 KV bus
1. 160 MVA BHEL
transformer 100 MW 0 2.5 MVAR 0
2. 160 MVA CGL
transformer 100 MW 0 1.5 MVAR 0
3 132 KV barman-1 feeder 0 40 MW 0 14 MVAR
4 132 KV barman-2 feeder 0 40 MW 0 14 MVAR
5 132 KV Narsinghpur-1
feeder 0 25 MW 0 8.75 MVAR
6 132 KV Narsinghpur-2
feeder 0 25 MW 0 8.75 MVAR
7 Narsinghpur area local s/s
load 0 70 MW 0 24.5 MVAR
8 33 MVAR x 2 capacitor
bank 0 0 66 MVAR 0
Total bus balance 200 MW
input 200 MW Output 70 MVAR Input 70 MVAR Output Note: reduction in MVAR drawn from 2x160MVA transformers has been recorded.
Table IV Bus Voltages and Power Factor after Addition of Capacitor Bank
Bus standard voltage Bus voltage after power factor
correction
Bus power factor after power factor correction
132 KV bus 137.5 KV 0.97
33 KV bus 34.5 KV 0.98
Table V Bus Voltages And Power Factor Before And After Addition Of Capacitor Bank Bus
standard voltage
Bus voltage before pf correction
Bus power factor before pf correction
Bus power factor after pf correction
132 KV bus 132.02 KV 0.82 0.97
Technology (IJRASET)
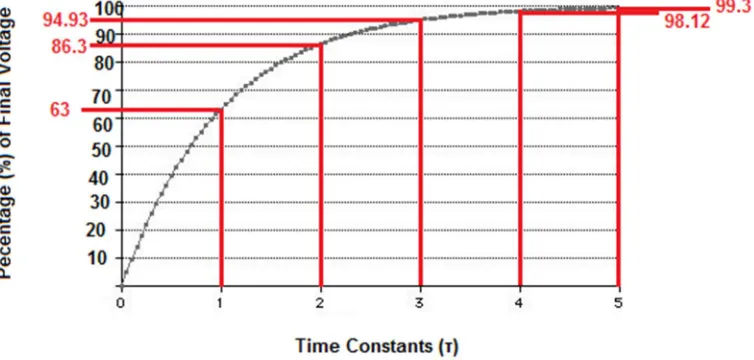
[image:5.612.132.497.303.443.2]Figure 2. Voltage Curve With Respect to Time
[image:5.612.125.493.370.615.2]Figure 3.Current Curves With Respect to Time
Figure 4. Capacitor Voltage With Respect to Time
V. CONCLUSION
www.ijraset.com Volume 4 Issue II, February 2016 IC Value: 13.98 ISSN: 2321-9653
International Journal for Research in Applied Science & Engineering
Technology (IJRASET)
aspects of power system.
To maintain the system reliability it is necessary to compensate the reactivepower and thereby the selection of reactor (capacitor or
inductor) bank is required. This work is solely devoted to develop a fast and simple algorithm for the computation of capacitor and inductor bank size for static var compensator. In traditional method several trials and errors are to be done each of which comprises several iterations which make this method complicated and time consuming, whereas the proposed method of computation needs a trivial computation which is less time consuming and simple. It is very tough to implement the time consuming and complicated traditional method for online capacitor or inductor bank computing purpose. On the other hand, being extremely fast, the proposed method of computation has high opportunities to be used for online capacitor or inductor bank computation purpose.
REFERENCES
[1] Importance Of Series And Shunt Compensation And Shunt Reactors – By K.P. Chaturvedi (Additional Chief Engineer)
[2] Capacitor Banks – Operation & Maintenance A.Ghosh Executive Engineer O/O CE(T&C)
[3] Shunt Reactive Power Compensation Of Long Transmission Lines Q. Wang SS Choi Nanyang Technological University Singapore
[4] Optimal Locations And Sizing Of Capacitors For Voltage Stability Enhancement In Distribution Systems Mohan. G* Aravindhababu. Reader In Electrical Engineering Professor Of Electrical Engineering, Annamalai University Annamalainagar – 608 002, Tamil Nadu, India.
[5] Economical Optimization Of Capacitor Placement For Large-Scale Practical Distorted Distribution Network Tamer M. Khalil Selim1), Member, Ieee; Alexander V. Gorpinich2), Member, Ieee
[6] Automatic Power Factor Correction Using Capacitive Bank Mr.Anant Kumar Tiwari, Mrs. Durga Sharma, Mr.Vijay Kumar Sharma Dr. C.V. Raman Institute Of Science And Technology Bilaspur. Assistant Professor Dr. C.V. Raman Institute Of Science And Technology, Bilaspur. Assistant Professor Lkct Indore (M.P.)