Contents lists available at
ScienceDirect
NeuroImage: Clinical
journal homepage:
www.elsevier.com/locate/ynicl
Associations between polygenic risk scores for four psychiatric illnesses and
brain structure using multivariate pattern recognition
Siri Ranlund
a, Maria Joao Rosa
b, Simone de Jong
c,d, James H. Cole
a,e, Marinos Kyriakopoulos
f,g,
Cynthia H.Y. Fu
h,i, Mitul A. Mehta
a, Danai Dima
a,j,⁎aDepartment of Neuroimaging, Institute of Psychiatry, Psychology and Neuroscience, King's College London, London, UK bDepartment of Computer Science, University College London, London, UK
cNIHR BRC for Mental Health, Institute of Psychiatry, Psychology and Neuroscience, King's College London and SLaM NHS Trust, London, UK dMRC Social, Genetic & Developmental Psychiatry Centre, Institute of Psychiatry, Psychology and Neuroscience, King's College London, London, UK eComputational, Cognitive & Clinical Neuroimaging Laboratory, Division of Brain Sciences, Department of Medicine, Imperial College London, London, UK fNational and Specialist Acorn Lodge Inpatient Children Unit, South London and Maudsley NHS Foundation Trust, London, UK
gDepartment of Child and Adolescent Psychiatry, Institute of Psychiatry, Psychology and Neuroscience, King's College London, London, UK hSchool of Psychology, University of East London, London, UK
iCentre for Affective Disorders, Institute of Psychiatry, Psychology and Neuroscience, King's College London, London, UK jDepartment of Psychology, School of Arts and Social Sciences, City, University of London, London, UK
A R T I C L E I N F O
Keywords: ADHD Autism Bipolar disorder Major depression Schizophrenia MRI
A B S T R A C T
Psychiatric illnesses are complex and polygenic. They are associated with widespread alterations in the brain, which are partly influenced by genetic factors. There have been some attempts to relate polygenic risk scores (PRS) – a measure of the overall genetic risk an individual carries for a disorder – to brain structure using univariate methods. However, PRS are likely associated with distributed and covarying effects across the brain. We therefore used multivariate machine learning in this proof-of-principle study to investigate associations between brain structure and PRS for four psychiatric disorders; attention deficit-hyperactivity disorder (ADHD), autism, bipolar disorder and schizophrenia. The sample included 213 individuals comprising patients with de-pression (69), bipolar disorder (33), and healthy controls (111). The five psychiatric PRSs were calculated based on summary data from the Psychiatric Genomics Consortium. T1-weighted magnetic resonance images were obtained and voxel-based morphometry was implemented in SPM12. Multivariate relevance vector regression was implemented in the Pattern Recognition for Neuroimaging Toolbox (PRoNTo). Across the whole sample, a multivariate pattern of grey matter significantly predicted the PRS for autism (r= 0.20, pFDR= 0.03;
MSE = 4.20 × 10⁻⁵, p
FDR= 0.02). For the schizophrenia PRS, the MSE was significant (MSE = 1.30 × 10⁻⁵,
pFDR= 0.02) although the correlation was not (r= 0.15, pFDR= 0.06). These results lend support to the
hy-pothesis that polygenic liability for autism and schizophrenia is associated with widespread changes in grey matter concentrations. These associations were seen in individuals not affected by these disorders, indicating that this is not driven by the expression of the disease, but by the genetic risk captured by the PRSs.
1. Introduction
Common psychiatric illnesses have complex etiologies and are
polygenic (
Lee et al., 2013
;
Wray et al., 2014
). Autism, bipolar disorder
and schizophrenia consistently show high heritability estimates, both
from twin studies (up to 90%) and molecular genetic studies
(
Geschwind and Flint, 2015
;
Sullivan et al., 2012
). Attention-deficit
hyperactivity disorder (ADHD) is however known to have relatively
fewer genetic influences with environmental risk factors playing a
greater role in disease liability, and heritability estimates for ADHD in
adults ranges from 40% to 70% (
Brikell et al., 2015
;
Burmeister et al.,
2008
;
Franke et al., 2011
).
Genetic variants associated with an increased risk of developing a
range of psychiatric illnesses have started to be identified (
Cross-Disorder Group of the Psychiatric Genomics Consortium, 2013
;
Marshall et al., 2016
;
Sklar et al., 2011
;
Stefansson et al., 2008
;
Stone
https://doi.org/10.1016/j.nicl.2018.10.008
Received 5 February 2018; Received in revised form 4 October 2018; Accepted 8 October 2018
⁎Corresponding author at: Department of Psychology, School of Arts and Social Sciences, City, University of London, 10 Northampton Square, London EC1V 0HB,
UK.
E-mail address:[email protected](D. Dima).
Available online 09 October 2018
2213-1582/ © 2018 The Authors. Published by Elsevier Inc. This is an open access article under the CC BY license (http://creativecommons.org/licenses/BY/4.0/).
et al., 2008
); most notably for schizophrenia where over 100 common
genetic variants have been significantly detected (
Ripke et al., 2014
).
Progress has also been made for bipolar disorder, where a handful of
common variants have been identified (
Chen et al., 2013
;
Sklar et al.,
2011
). However, for other disorders such as ADHD and autism, very
few common genetic risk variants have been reliably detected (
Warrier
et al., 2015
). Furthermore, it is still largely unknown how genetic risk
variants lead to the development of psychiatric symptoms; an important
goal of psychiatric genetic research is therefore to clarify the
mechan-isms of these variants (
Bogdan et al., 2017
;
Carter et al., 2017
;
Glahn
et al., 2014
;
Hall and Smoller, 2010
;
Harrison, 2015
).
The polygenic risk score (PRS) is an estimate of the combined effect
of a large number of common genetic variants (single nucleotide
polymorphisms, SNPs) associated with a trait, each with a very subtle
individual effect (
Chatterjee et al., 2016
;
Dima and Breen, 2015
;
Purcell
et al., 2009
;
Wray et al., 2014
). PRSs for psychiatric illnesses differ
between patients and controls, thus providing a useful tool to measure
genetic liability to psychiatric disorders (
Bramon et al., 2014
;
Derks
et al., 2012
;
Power et al., 2015
;
Purcell et al., 2009
;
Ranlund et al.,
2017
;
Vassos et al., 2017
), including non-affected individuals. Thus,
associations with PRS are predicted to be independent of current
dis-ease state and can be seen in healthy participants who may not have
developed a disorder.
We chose to investigate associations between PRSs for four major
psychiatric disorders and brain structure. A wide range of both cortical
and subcortical brain structural alterations have been observed in
pa-tients with psychiatric illnesses, including in ADHD (
Frodl and
Skokauskas, 2012
;
Hoogman et al., 2017
;
Nakao et al., 2011
;
Valera
et al., 2007
), autism (
Cauda et al., 2011
;
Deramus and Kana, 2015
;
Duerden et al., 2012
;
Nickl-Jockschat et al., 2012
), bipolar disorder
(
Arnone et al., 2009
;
Hibar et al., 2016
;
Selvaraj et al., 2012
;
Vita et al.,
2009
;
Wise et al., 2016
), and schizophrenia (
Bora et al., 2011
;
Palaniyappan et al., 2015
;
Radua et al., 2012
;
Steen et al., 2006
;
van
Erp et al., 2015
). Furthermore, brain structure is influenced by genetic
factors, with high heritability estimates for measures including grey
matter volumes (
Batouli et al., 2014
;
Glahn et al., 2007
;
Jansen et al.,
2015
;
Peper et al., 2007
), and studies have linked genetic risk for
psychiatric disorders to variations in brain structure (
Doyle et al., 2015
;
Lee et al., 2016
;
McIntosh et al., 2006
;
Turner et al., 2012
;
Van Haren
et al., 2012
).
Amongst the psychiatric illnesses, the schizophrenia PRS has been
most widely investigated to date; and although some studies have found
associations with brain structure (
Neilson et al., 2016
;
Terwisscha van
Scheltinga et al., 2013
), others have found no significant associations
(
Papiol et al., 2014
;
Van der Auwera et al., 2015
;
Voineskos et al.,
2016
). Whalley and colleagues (2013) also investigated the PRS for
bipolar disorder but found no significant associations with fractional
anisotropy in white matter tracts. Lastly,
Reus et al. (2017)
found no
associations between PRS for schizophrenia, bipolar disorder or
de-pression in a range of brain structural measures including total grey
matter, white matter and subcortical volumes.
These studies all used a univariate approach, where brain voxels or
regions-of-interest are tested individually against the PRS. However, we
know that the PRS is an estimate of the overall genetic risk an
in-dividual carries for a disorder. It is plausible to consider this risk acting
throughout development and thus the influence on brain structure may
best be captured by considering co-varied and distributed effects across
the whole brain, rather than large, localized effects. Hence, a
multi-variate machine learning method – that considers the pattern of
inter-relationships between measurements (e.g. grey matter volumes across
the brain) – might be a more powerful method to detect subtle and
spatially distributed patterns of alterations. The aim is not to localize
effects in the brain or to identify specific regions that are predictive.
PRSs were used recently in a multivariate machine learning setting to
differentiate schizophrenia and/or bipolar disorder patients from
healthy controls by combining the PRS with brain and cognitive
vari-ables (
Doan et al., 2017
). However, adding the PRS did not improve the
classifying performance of the algorithm, implying that the PRS's
pre-dictive value is captured by brain variables (
Doan et al., 2017
).
In this study, we investigated the associations between brain
structure and polygenic risk scores for four psychiatric disorders;
ADHD, autism, bipolar disorder, and schizophrenia. We first present a
univariate regression, followed by a multivariate analysis investigating
whether the pattern of grey matter densities across the brain can predict
an individual's PRS. We hypothesised that a multivariate approach
would be more sensitive to detect associations between brain structure
and PRSs compared to a univariate method, and that predictions would
be stronger for highly heritable disorders with larger genetic influences
like autism, schizophrenia and bipolar disorder, compared to ADHD
that is known to be less heritable.
2. Methods and materials
2.1. Participants
[image:2.595.38.290.339.552.2] [image:2.595.39.558.571.725.2]The sample included 213 participants from two studies; 69 patients
with major depressive disorder and 70 healthy controls from the
BRCDECC study (
Cole et al., 2012, 2013
;
Costafreda et al., 2013
), and
33 patients with bipolar disorder and 41 healthy controls from the
VIBES study (
Dima et al., 2016a
,
b
;
Frangou et al., 2017
). All
partici-pants were unrelated and of white European ancestry.
Table 1
includes
a summary of demographic and clinical information for the
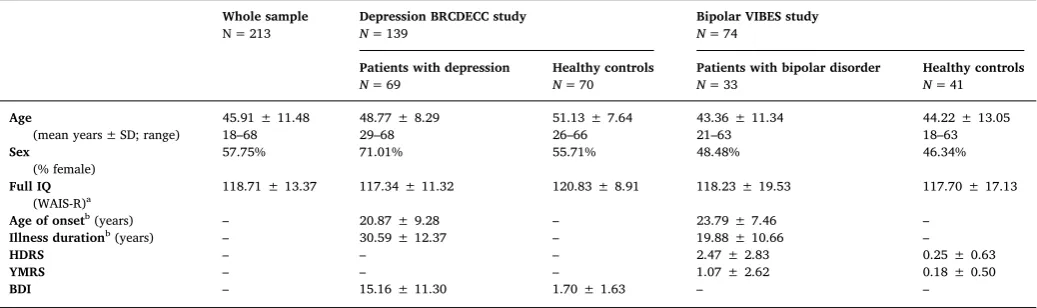
Table 1
Participants' characteristics.
Whole sample
N = 213 Depression BRCDECC studyN= 139 Bipolar VIBES studyN= 74
Patients with depression
N= 69 Healthy controlsN= 70 Patients with bipolar disorderN= 33 Healthy controlsN= 41
Age
(mean years ± SD; range) 45.91 ± 11.4818–68 48.77 ± 8.2929–68 51.13 ± 7.6426–66 43.36 ± 11.3421–63 44.22 ± 13.0518–63 Sex
(% female) 57.75% 71.01% 55.71% 48.48% 46.34%
Full IQ
(WAIS-R)a 118.71 ± 13.37 117.34 ± 11.32 120.83 ± 8.91 118.23 ± 19.53 117.70 ± 17.13
Age of onsetb(years) – 20.87 ± 9.28 – 23.79 ± 7.46 –
Illness durationb(years) – 30.59 ± 12.37 – 19.88 ± 10.66 –
HDRS – – – 2.47 ± 2.83 0.25 ± 0.63
YMRS – – – 1.07 ± 2.62 0.18 ± 0.50
BDI – 15.16 ± 11.30 1.70 ± 1.63 – –
participants.
Participants from the BRCDECC study included patients with
de-pression who had experienced two or more depressive episodes of at
least moderate severity and met DSM-IV diagnostic criteria for
re-current major depressive disorder (
APA, 1994
), assessed using the
Schedules for Clinical Assessment in Neuropsychiatry (
Wing et al.,
1990
). The healthy controls were interviewed to ensure they had never
experienced a depressive episode. Exclusion criteria included a
diag-nosis of a neurological disorder, head injury leading to loss of
con-sciousness, or conditions known to affect brain structure or function
(including alcohol or substance misuse), ascertained during clinical
interview. Potential participants were also excluded if they or a
first-degree relative had ever fulfilled criteria for mania, hypomania,
schi-zophrenia or mood-incongruent psychosis. Current depressive
symp-toms were measured using the Beck Depression Inventory (BDI) (
Beck
et al., 1961
).
Participants from the VIBES study included euthymic patients with
bipolar disorder and healthy individuals. The diagnostic status of all
participants was assessed using the Structured Clinical Interview for
DSM-IV for Axis I diagnoses (
First et al., 2002a
;
First et al., 2002b
).
Patients fulfilled criteria for bipolar disorder type I according to the
Diagnostic and Statistical Manual of Mental Disorders, 4th edition,
re-vised (DSM-IV) (
APA, 1994
). Healthy controls were selected based on
the absence of family history and personal lifetime history of
psychia-tric disorders. To ensure that patients were in remission, their
psy-chopathology was assessed weekly over a period of 1 month prior to
testing and at each assessment they scored below 7 in the Hamilton
Depression Rating Scale (HDRS) (
Hamilton, 1960
) and the Young
Mania Rating Scale (YMRS) (
Young et al., 1978
). Patients were also
required to have remained on the same type and dose of medication for
a minimum of 6 months. All participants were free of any medical
co-morbidity and had no lifetime history of substance dependence or
substance abuse in the six months leading to their brain scan.
The BRCDECC study was approved by the Bexley and Greenwich
Research Ethics Committee, and the VIBES study was approved by the
Ethics Committee of the Institute of Psychiatry and the South London
and Maudsley National Health Service Trust. Written informed consent
was obtained from all participants.
2.2. DNA extraction and genotyping
DNA was obtained from all participants using buccal swabs and/or
blood. Participants from the VIBES study were genotyped on the Psych
Chip (Illumina Infinium PsychArray-24) and participants from the
BRCDECC study were genotyped using the Illumina
HumanHap610-Quad BeadChip. SNP positions were lifted over from hg18 to hg19 build
using the UCSC LiftOver tool. The data were imputed using the
Michigan Imputation Server (
Das et al., 2016
) (
https://
imputationserver.sph.umich.edu/index.html
) with 1000 Genomes as
reference set utilizing SHAPEIT and Minimac software. Data quality
was controlled in PLINK v1.07 (
Purcell et al., 2007
). In short, SNPs
were excluded when missingness > 1%, minor allele frequency
(MAF) < 1%, or Hardy-Weinberg equilibrium (HWE)
p
< .00001, and
participants were excluded when missingness > 1%. Sex and
related-ness checks were carried out, in addition to principal component
ana-lyses, to confirm self-reported ethnicities (
Patterson et al., 2006
).
2.3. Polygenic risk scores
Genome-wide polygenic risk scores (PRSs) for ADHD, Autism
Spectrum Disorder, Bipolar Disorder, and Schizophrenia were
gener-ated with PRSice software (
http://prsice.info
/) (
Euesden et al., 2014
),
using the most recent Psychiatric Genomics Consortium genome-wide
association analyses within the cross disorder study (
Cross-Disorder
Group of the Psychiatric Genomics Consortium, 2013
) and
schizo-phrenia GWAS (
Ripke et al., 2014
), available from the PGC website
(
www.med.unc.edu/pgc/results-and-downloads
). The SNPs used were
P
-value-informed clumping in PLINK with a cut-off of r
2= 0.25 within
a 200-kb window, and excluding the MHC region of the genome
be-cause of its complex linkage disequilibrium structure. For each
parti-cipant, PRSs were generated using SNPs with a
p
-value threshold
of < 0.1 in the panel of SNPs from the Psychiatric Genomics
Con-sortium (see Table S1 in the supplement for discovery sample sizes from
the Psychiatric Genomics Consortium, and the number of SNPs included
for each PRS). None of the individuals in our study were included in the
GWAS data used to identify the SNPs. Since we calculated 5 psychiatric
PRS scores, we decided to use the P-threshold of < 0.1 as it has been
shown that progressive P-thresholds at liberal thresholds explain more
variance in the clinical phenotype (
Ruderfer et al., 2014
).
2.4. MRI data acquisition
For participants from the BRCDECC study, T1-weighted structural
images were acquired using a 1.5-Tesla General Electric Signa MR
Imaging system (General Electric, Milwaukee, WI, USA), in the sagittal
plane (magnetization-prepared rapid gradient-echo sequence;
repeti-tion time (TR) = 8.592 ms, echo time (TE) = 3.8 ms, inversion time
(TI) = 1000 ms,
slice
thickness = 1.2 mm,
voxel
dimen-sions = 0.939 × 0.937 × 1.2 mm, matrix size 192 × 192, field of
view = 240, flip angle = 8°) (
Cole et al., 2013
).
For participants from the VIBES study, T1-weighted structural
images were acquired using a 1.5-Tesla GE Neuro-optimised Signa MR
system (General Electric, Milwaukee, WI, USA), in the axial plane
(in-version recovery prepared, spoiled gradient-echo sequence;
TR = 18 ms, TE = 5.1 ms, TI = 450 ms, slice thickness = 1.5 mm, voxel
dimensions = 0.9375 × 0.9375 × 1.5 mm, matrix size 256 × 192, field
of view = 240, flip angle = 20°, number of excitations = 1) (
Dima
et al., 2016a
;
Frangou et al., 2017
).
2.5. MRI data processing
All MRI images were pre-processed using a standard voxel-based
morphometry (VBM) pipeline (
Ashburner and Friston, 2000
),
im-plemented in Statistical Parametric Mapping (SPM12) (
www.fil.ion.ucl.
ac.uk/spm/software/spm12/
), running on Matlab 2016 (Math Works,
USA).
The origins of all images were manually set to the anterior
com-missure. The images were then segmented into grey matter, white
matter, and cerebrospinal fluid using unified segmentation. The
Diffeomorphic Anatomical Registration using Exponential Lie algebra
(DARTEL) algorithm (
Ashburner, 2007
) was applied to the segmented
brain tissues to generate a study-specific template, and images were
normalised to the template using non-linear warping.
Normalization to standard space, including smoothing using an
8 mm full-width-half-maximum Gaussian kernel, was done in two ways;
including a “modulation” step or not. Modulation scales the grey matter
probability values after spatial normalization to ensure that the total
amount of grey matter in each voxel is conserved after warping
(
Mechelli et al., 2005
). This is recommended for univariate voxel-wise
analysis of grey matter volumes. However, for a multivariate analysis,
when the
relationship
between grey matter intensities across voxels is
modelled, it might be better to preserve concentrations of grey matter
(i.e. not to modulate images) because modulation could alter the
inter-relationship between voxel values. Hence, we use modulated images for
the univariate analysis, and non-modulated images for the multivariate
analysis. Total intracranial volume (including grey matter, white matter
and cerebrospinal fluid) was calculated for all individuals for inclusion
in the analyses as covariates.
modulated, normalised grey matter images. Covariates (included as
nuisance regressors) were age, sex, and intracranial volume. An explicit
grey matter mask was applied. Two-sample
t
-tests were conducted (for
the two studies separately). The significance threshold was set using
family-wise error (FWE) correction (
p
< .05), and we report clusters
larger than k = 20.
2.6. Univariate regression analysis
We first investigated the relationship between grey matter volume
and polygenic risk scores (for ADHD, autism, bipolar disorder, and
schizophrenia) in our sample of 213 individuals, using a standard,
univariate voxel-based morphometry (VBM) analysis in SPM12
(
Ashburner and Friston, 2000
).
The input features for the univariate multiple regression were the
smoothed, modulated, normalised grey matter images. Covariates
(in-cluded as nuisance regressors) were age, sex, intracranial volume,
status (patient, control), and study (BRCDECC, VIBES). An explicit grey
matter mask was applied. We looked for regions with either a linear
increase or decrease in grey matter volume associated with higher PRS
(i.e. both positive and negative associations). We report clusters
re-maining significant after family-wise error (FWE) correction (
p
< .05,
with a cluster forming threshold of
p
< .001), and regions surviving
FWE correction at the voxel level (p < .05).
2.7. Multivariate regression analysis
We then tested whether a multivariate pattern of grey matter
pre-dicts polygenic risk scores for the five psychiatric disorders (ADHD,
autism, bipolar disorder, and schizophrenia) in the whole sample
in-cluding 213 individuals. This was done using multivariate Relevance
Vector Regression (RVR) (
Tipping, 2001
) implemented in the Pattern
Recognition for Neuroimaging Toolbox (PRoNTo;
Schrouff et al., 2013
)
(
www.mlnl.cs.ucl.ac.uk/pronto
) running on Matlab 2016.
RVR is a probabilistic kernel-based pattern recognition method
using Bayesian inference to obtain sparse regression models, and allows
the extraction of patterns within a high-dimensional feature space (such
as voxel-based intensities representing local grey matter concentration).
This method has been described previously (
Araque Caballero et al.,
2016
;
Gong et al., 2014
;
Moradi et al., 2017
;
Tognin et al., 2014
).
The input features for the multivariate pattern analyses were the
smoothed, normalised grey matter images. Covariates – including age,
sex, group status (patient, control), study (BRCDECC, VIBES), and
in-tracranial volume – were regressed out from the training data, and the
same transformation was applied to the test data within the
cross-va-lidation framework. The RVR was trained using a leave-one-subject-out
cross-validation. This is a frequently used validation method, involving
leaving one participant out for test and train the model on N-1
parti-cipants, and doing so N times so that each participant is left out once.
We also repeated our analyses leaving 10% of the sample out (i.e. a
ten-fold cross-validation). Because our sample size was not divisible by ten,
9 folds contained 21 individuals and 1-fold contained 24 individuals.
These additional results are presented in the supplement (Table S6).
We report the Pearson correlation coefficient and the Mean Squared
Error (MSE; normalised to the range of the predicted variable) between
the actual and predicted PRS. These reflect how well a multivariate
pattern of grey matter predicts an individual's PRS; a correlation of 1
would indicate that the predicted PRS is identical to the actual PRS, and
an MSE of 0 would mean that there is no error in this prediction. Note
that in a multivariate analysis results do not imply whether there is a
positive or negative association between grey matter and PRS, instead it
is the pattern of grey matter across the brain – which could include both
increases and decreases – that predicts the PRS.
The significance of both the correlation coefficient and the MSE
were estimated using a permutation test whereby the target data were
randomised and the model re-run 1000 times (with the lowest
p
-value
attainable being 1/1000 = 0.001). We also present regions (from the
Automatic Anatomical Labelling (AAL) atlas), and their weights, that
contribute the most to estimations of PRSs. Importantly, however, in a
multivariate analysis all voxels contribute to the predictions and we
present the regional contributions for visualization purposes only. As
described in
Schrouff et al. (2013; pg. 232)
, “this is because it is the
combination of all weights that defines the model, and the weights at
each voxel are dependent of one another and no direct lozalization or
voxel-wise statistical test assuming independence can be performed on
them”.
Since we are conducting four multivariate analyses (for the five
different polygenic risk scores), we correct
p
-values for multiple testing
using false discovery rates (FDR) implemented in Matlab using the
Benjamini and Hochberg (1995)
procedure. We decided to use the FDR
correction by Benjamini and Hochberg since the four PRS scores are not
independent.
As secondary analyses, to investigate whether associations are
driven by subgroups of participants, we repeated the multivariate
re-gression models including only patients (
N
= 102), only patients with
major depression (
N
= 69) or bipolar disorder (
N
= 33), as well as
in-cluding only healthy controls (
N
= 111).
3. Results
Participants' characteristics are presented in
Table 1
.
3.1. Polygenic risk scores
Patients with depression, bipolar disorder and healthy controls did
not differ in mean ADHD, autism, or schizophrenia PRS. However, the
three groups differed in the bipolar disorder PRS (F(2,210) = 12.05,
p
= 1.11 × 10
−5), with patients with bipolar disorder having the
highest risk, followed by patients with major depression, and lastly
controls. See
Table 2
. Raw scores across the three groups are presented
in the supplement (Table S2, Fig. S1).
Pairwise correlations showed that the schizophrenia PRS was
sig-nificantly associated with scores for ADHD (
r
= 0.20, p
FDR= 0.01) and
bipolar disorder (
r
= 0.60, p
FDR= 2.2 × 10
−15), and the ADHD and
bipolar risk scores were also correlated (
r
= 0.23, p
FDR= 0.0007). The
other pairwise correlations were not significant. See the supplement for
full results (Table S3, Fig. S2).
3.2. Univariate analysis results
We explored differences in grey matter volume between patients
and controls using VBM analysis separately in the depression BRCDECC
and the bipolar VIBES study. No significant results were found.
We investigated the association between grey matter volumes and
PRSs using univariate multiple regression, in the whole sample of 213
individuals. No results remained significant after family-wise error
(FWE) correction for ADHD, autism, or bipolar disorder, PRS.
For the schizophrenia PRS, no cluster remained significant after
FWE cluster correction, however one region (including 24 voxels, peak
MNI coordinates: x = 46, y = −78, z = 28 mm, right inferior occipital
gyrus) remained significant at the voxel-level, with a FWE-corrected
peak-level
p
-value of 0.005 (z-value = 4.99); increased PRS was
asso-ciated with increased grey matter volumes.
Un-thresholded t-maps for associations with the four PRSs are
shown in the supplement (Fig. S3).
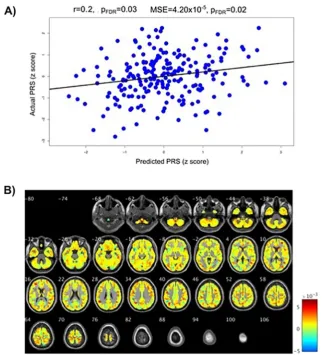
3.3. Multivariate regression results
significantly predicted the PRS for autism (
r
= 0.20, p
FDR= 0.03,
MSE = 4.20 × 10
−5, p
FDR
= 0.02). Associations with the schizophrenia
PRS were significant when looking at the mean squared error
(MSE = 1.30 × 10
−5, p
FDR
= 0.02), and the correlation (
r
= 0.15,
p
unc= 0.032); however the correlation did not survive FDR correction
(p
FDR= 0.06). The PRSs for ADHD and bipolar disorder were not
sig-nificantly associated with grey matter across the whole sample. These
results are presented in
Table 3
and
Figs. 1
A and
2
A.
Importantly, the results were stable across folds as illustrated by the
proximity of the expected ranking to the actual rankings for the regions
with the five highest weights (see Table S4 and Fig. S4 in the
supple-ment). The expected ranking indicates how consistent the ranking is
across cross-validation folds; if the expected ranking is close to the
actual ranking of a region (by weight) then the result is considered
stable across the folds. For the autism PRS the left inferior parietal gyrus
contributed 1.60% to the regression and the expected ranking was 1.00.
For the left angular gyrus these values were 1.43% and 2.12, the left
occipital lobe 1.38% and 3.15, the left cuneus 1.32%, 4.18 and left
precentral gyrus 1.30%, 5.10. For the schizophrenia PRS the right
an-gular gyrus contributed 1.53% to the regression and the expected
ranking was 1.11. For the right superior occipital lobe these values were
1.48% and 2.40, the cerebellar vermis 1.05% and 3.09, left middle
occipital lobe 1.34%, 4.37 and left superior occipital lobe 1.33%, 4.83.
While these weights are in keeping with the proportion of brain volume
for each region, they are low, indicating that the pattern of associations
is widespread across the brain; this is seen in
Figs. 1
B and
2
B where the
weight maps of contribution of voxels across the whole brain to
pre-diction of PRSs are shown.
As secondary analyses, to investigate whether associations are
driven by subgroups of participants, we repeated the multivariate
re-gression models including only patients (
N
= 102), only patients with
major depression (
N
= 69) or bipolar disorder (
N
= 33), as well as
in-cluding only healthy controls (
N
= 111). None of these analyses were
significant and these results are presented in the supplement (Table S5).
We also repeated the analysis using a randomly selected subsample of
100 individuals (comprising both patients and controls), in order to
investigate whether this lack of prediction above was likely due to the
reduced sample size. This analysis was also non-significant (Table S7).
We also re-ran our analyses using a 10-fold cross-validation. This
resulted in findings very similar to the original analyses, and are
pre-sented in Table S6 in the supplement.
4. Discussion
We aimed to investigate associations between polygenic risk scores
(PRSs) for four psychiatric disorders (ADHD, autism, bipolar disorder
and schizophrenia) and brain volumes. Results showed that the PRS for
autism and schizophrenia were associated with a multivariate pattern
of grey matter concentrations in this sample of healthy controls and
psychiatric patients. PRSs for ADHD and bipolar disorder, however,
could not be predicted by brain structure in this study. These findings
lend support to the hypothesis that the polygenic liability for autism
and potentially schizophrenia is associated with changes in grey matter
concentrations across the brain.
Both autism and schizophrenia are complex neurodevelopmental
disorders that are highly polygenic. Our findings show that the PRSs for
these two disorders are not correlated, indicating that although both
reflect commonly occurring genetic risk factors, these loci are not
shared between these disorders. This is consistent with previous studies
finding low genetic correlations between these two disorders in terms of
common genetic variation (
Cross-Disorder Group of the Psychiatric
Genomics Consortium, 2013
;
Lee et al., 2013
). For autism, although
many rare variants such as de novo mutations and copy number
var-iants have been identified (
Buxbaum, 2009
;
Ronemus et al., 2014
;
Sanders et al., 2015
), no single nucleotide polymorphism (SNP) has yet
been significantly detected (
Warrier et al., 2015
). That we find a
sig-nificant association with brain structure is in line with arguments that
the PRS captures causal variation not yet significantly identified in
genome-wide association studies (
Wray et al., 2014
).
[image:5.595.38.558.89.182.2]For schizophrenia, over 100 common SNPs have been detected
Table 2Polygenic risk scores (PRS) for the four disorders.Shown are tests for overall group differences (F tests), and the differences from controls in standardised z scores (to controls' means and standard deviations, SD) for patients with depression and patients with bipolar disorder ( ± SD).
Polygenic Risk Score (PRS) F test, p-value Patients with Major Depression
(vs. HC) Patients with Bipolar Disorder(vs. HC) p-values for two-sample t-tests ⁎
ADHD PRS F(2,210) = 0.18,p= .83 0.09 ± 0.92 0.09 ± 1.13 NS
Autism PRS F(2,210) = 1.68,p= .19 0.04 ± 1.05 0.36 ± 0.88 NS
Bipolar Disorder PRS F(2,210) = 12.05, p = 1.1 × 10⁻⁵ 0.40 ± 0.46 0.77 ± 0.95 HC vs MDD patientsp= .002 HC vs BPD patients p= 8.6 × 10⁻⁶
MDD vs BPD patientsp= .043 Schizophrenia PRS F(2,210) = 0.77,p= .47 0.12 ± 0.42 0.06 ± 0.59 NS
*Comparison between groups (two-sample t-tests, uncorrected for multiple testing), for polygenic risk scores with significant overall group differences (i.e. Bipolar Disorder PRS).
NS = Not significant
[image:5.595.49.549.282.359.2]ADHD = Attention Deficit Hyperactivity Disorder; BPD = Bipolar Disorder; HC = Healthy Controls; MDD = Major Depressive disorder. Note: The control group includes controls from both samples (N= 111)
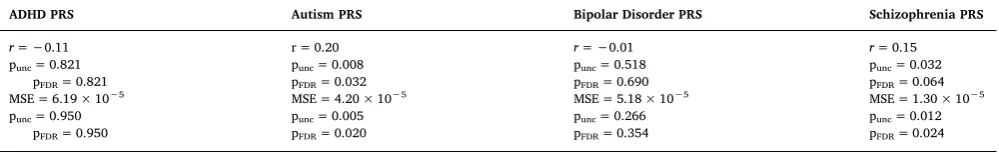
Table 3
Multivariate pattern recognition results.Correlations (r) between the actual and predicted polygenic risk scores (PRS) – from grey matter volumes – and (normalised) mean squared errors (MSE) in the whole sample (N = 213).
ADHD PRS Autism PRS Bipolar Disorder PRS Schizophrenia PRS
r= −0.11 r = 0.20 r= −0.01 r= 0.15
punc= 0.821 pFDR= 0.821
punc= 0.008 pFDR= 0.032
punc= 0.518 pFDR= 0.690
punc= 0.032 pFDR= 0.064
MSE = 6.19 × 10⁻⁵ MSE = 4.20 × 10⁻⁵ MSE = 5.18 × 10⁻⁵ MSE = 1.30 × 10⁻⁵
punc= 0.950 pFDR= 0.950
punc= 0.005 pFDR= 0.020
punc= 0.266 pFDR= 0.354
punc= 0.012 pFDR= 0.024
(
Ripke et al., 2014
). The discovery sample used to calculate the PRS for
schizophrenia is substantially larger than for any of the other disorders
investigated here, making the schizophrenia PRS relatively powerful
(
Purcell et al., 2009
;
Ripke et al., 2014
). We know that larger discovery
sample sizes will lead to more true positive variants being included in
the risk score, and hence the score being a more sensitive marker of
genetic risk (
Dudbridge, 2013
;
Wray et al., 2014
). Once discovery
samples sizes increase for the other disorders and more significant loci
are identified, we might expect to see more significant associations in
the kind of analyses conducted in this study, if there is a true link
be-tween psychiatric genetic risk and brain structure.
Given the lack of SNPs associated with autism and the smaller
dis-covery sample size compared to schizophrenia for the PRS calculation,
it is interesting that we find associations between brain structure and
the autism PRS. If replicated, this might be due to the early
develop-ment of autism and its association with severe lifelong
neurodevelop-mental symptoms (
Baxter et al., 2015
). Hence, associations between
genetic risk for autism and brain structure might be relatively large
compared to disorders that emerge later in life. Furthermore,
Lee et al.
(2013)
found that the proportion of variance explained by SNPs located
in genes that are expressed in the central nervous system is relatively
high for autism compared to other psychiatric disorders investigated
here. It could thus be suggested that genes associated with autism
in-fluence brain structure to a relatively large degree and is more
wide-spread than first suspected.
We see these associations between PRS for autism and
schizo-phrenia and grey matter in a sample not including patients affected by
these disorders, indicating that this is not driven by the expression of
the disease, but by the genetic risk captured by the PRSs. Furthermore,
there was no evidence in our sample that the associations between PRS
and grey matter patterns were moderated by diagnostic status (MDD or
bipolar), and this indicates that disease status or use of medication is
not driving the associations. However, we acknowledge that MDD and
bipolar disorder patients were a subset of the overall sample.
We found no evidence for associations between brain grey matter
and genetic risk for bipolar disorder, or ADHD. When it comes to
ADHD, since this disorder has been found to be less heritable with
larger environmental influences (
Brikell et al., 2015; 2015
;
Franke
et al., 2011
;), the lack of associations here are perhaps unsurprising.
However, given the large genetic overlap between bipolar disorder and
schizophrenia, seen both in the correlation between these scores in this
study and in the literature (
Craddock et al., 2005
;
Cross-Disorder Group
of the Psychiatric Genomics Consortium, 2013
;
Lee et al., 2013
;
Lichtenstein et al., 2009
), it is somewhat surprising that we observed a
trend level association for schizophrenia but not for bipolar disorder.
This might be due to the significantly larger discovery sample size used
to calculate the risk score for schizophrenia. Furthermore, compared to
autism, bipolar disorder develops later in life, which could explain
these lack of findings; maybe genetic risk associated with these
dis-orders do not have as strong an influence on structural
neurodevelop-ment as that for autism.
[image:6.595.136.460.53.409.2]In a multivariate analysis, all voxels contribute to predictions and it
is not possible to single out whether any region is predictive in
isola-tion. In our study, maybe the most important conclusion from the
Fig. 1. Results for the autism polygenic risk score (PRS). A)Correlations between actual autism PRS and the PRS predicted from the grey matter volume maps. pFDR= False Discover Rate correctedp-values.B)Weight maps of contribution of voxels across the whole brain for the predicted autism PRS shown in A (in the wholeweight maps is that the pattern of grey matter predicting PRS is
widespread across the whole brain; large regions identified (voxel size
~5000) and very small weights attributed even to the top regions with
weights of no > 1.6%. This widespread multivariate pattern justifies
the use of multivariate machine learning models, since it will likely be
more difficult to identify significantly associated regions using a
uni-variate method (
Cohen et al., 2017
;
Woo et al., 2017
). This is evident in
our findings, especially for the autism PRS where we find a multivariate
association but no significant univariate results. Nevertheless, an
im-portant goal of future work is to use multivariate methods that might be
able to provide more insight into what brain regions are most important
for predictions, such as sparse network-based methods or elastic net
classifiers. Another feature of the multivariate analysis is that the
output is a weight map which does not speak to whether these areas
have increased or decreased grey matter volumes in relation to PRS
scores. The univariate analysis for the PRS for schizophrenia revealed
only one significant positive correlation between schizophrenia PRS
and the right inferior occipital gyrus, contributing to the argument of
using multivariate machine learning methods.
We consider this to be a proof-of-principle study, and while our
sample size is relatively large for imaging research, it is small when
compared to genetic studies. Furthermore, although we use
cross-vali-dation (including the leave-out-out method in the main paper, as well
as a ten-fold cross-validation in the Supplement), these findings need
replication in large independent samples to be confirmed, ideally in a
large sample of healthy individuals not constrained by disease status. A
limitation of the PRS is that because it is an estimate of the combined
genetic risk carried by an individual, it does not tell us what specific
variants are most important for the association observed. Therefore,
future research should investigate whether a subset of common genetic
variants (e.g. on a functional pathway) are more strongly influencing
grey matter structure. These findings identify brain correlates of PRS,
but do not inform on the functional role of these systems in conferring
risk, which is an important question as more data becomes available,
including developmental and longitudinal data. Further limitations of
this study include the use of MRI data from two different scanners,
which might have influenced results (although this was included as a
covariate in all analyses), and that we did not have both neuroimaging
and genetic data available from patients with autism, ADHD, or
schi-zophrenia. Lastly, the method applied in this paper does not allow to
test for PRS by diagnosis interaction.
[image:7.595.136.462.52.412.2]In summary, this was the first study using a multivariate approach –
both for genetic and imaging data – to investigate associations between
brain grey matter and polygenic risk scores for four psychiatric
ill-nesses. We show that both the autism and the schizophrenia risk scores
are significantly predicted by grey matter structure. These results
sup-port the hypothesis that cumulative genetic risk for autism and
schi-zophrenia is associated with changes in grey matter concentrations
across the brain. Autism develops early in life and is associated with
severe neurodevelopmental symptoms, including brain structural
changes. This is likely contributing to our current findings, suggesting
genetic risk for autism might be associated with relatively large changes
in brain structure even in individuals not expressing the illness. That
the pattern of associations was widespread across the brain, as
Fig. 2. Results for the schizophrenia polygenic risk score (PRS). A)Correlations between actual schizophrenia PRS and the PRS predicted from grey matter volume maps. pFDR= False Discover Rate corrected p-values.B)Weight maps of contribution of voxels across the whole brain for the predicted schizophrenia PRSexpected, supports the use of a multivariate approach to detect these
patterns of changes in grey matter.
Acknowledgments
We would like to thank Dr. Sophia Frangou for giving us access to
the VIBES data. Drs Ranlund, de Jong, Mehta and Dima were partially
funded by the National Institute for Health Research (NIHR) Biomedical
Research Centre for Mental Health at South London and Maudsley NHS
Foundation Trust and King's College London. Additional support to Dr.
Dima was provided by the Psychiatry Research Trust grant (Grant
Reference: 92 Branthwaite) and the Brain Behavior Foundation
(Leichtung Family Investigator, Grant ID: 22471).
Declarations of interest
None.
Financial disclosures
All authors declare that they have no conflicts of interest.
Appendix A. Supplementary data
Supplementary data to this article can be found online at
https://
doi.org/10.1016/j.nicl.2018.10.008
.
References
APA, 1994. Diagnostic and Statistical Manual of Mental Disorders. American Psychiatric Association, Washington.
Araque Caballero, M.Á., Klöppel, S., Dichgans, M., Ewers, M., 2016. Spatial patterns of longitudinal gray matter change as predictors of concurrent cognitive decline in amyloid positive healthy subjects. J. Alzheimer's Dis. 55, 343–358.https://doi.org/ 10.3233/JAD-160327.
Arnone, D., Cavanagh, J., Gerber, D., Lawrie, S.M., Ebmeier, K.P., McIntosh, A.M., 2009. Magnetic resonance imaging studies in bipolar disorder and schizophrenia: meta-analysis. Br. J. Psychiatry 195, 194–201.https://doi.org/10.1192/bjp.bp.108. 059717.
Ashburner, J., 2007. A fast diffeomorphic image registration algorithm. Neuroimage 38, 95–113.https://doi.org/10.1016/j.neuroimage.2007.07.007.
Ashburner, J., Friston, K.J., 2000. Voxel-based morphometry - the methods. Neuroimage 11, 805–821.https://doi.org/10.1006/nimg.2000.0582.
Batouli, S.A.H., Trollor, J.N., Wen, W., Sachdev, P.S., 2014. The heritability of volumes of brain structures and its relationship to age: A review of twin and family studies. Ageing Res. Rev.https://doi.org/10.1016/j.arr.2013.10.003.
Baxter, A.J., Brugha, T.S., Erskine, H.E., Scheurer, R.W., Vos, T., Scott, J.G., 2015. The epidemiology and global burden of autism spectrum disorders. Psychol. Med. 45, 601–613.https://doi.org/10.1017/S003329171400172X.
Beck, A.T., Ward, C.H., Mendelson, M., Mock, J., Erbaugh, J., 1961. An inventory for measuring depression. Arch. Gen. Psychiatry 4, 561–571.https://doi.org/10.1001/ archpsyc.1961.01710120031004.
Benjamini, Y., Hochberg, Y., 1995. Controlling the false discovery rate: A practical and powerful approach to multiple testing. J. R. Stat. Soc. 57, 289–300.
Bogdan, R., Salmeron, B.J., Carey, C.E., Agrawal, A., Calhoun, V.D., Garavan, H., Hariri, A.R., Heinz, A., Hill, M.N., Holmes, A., Kalin, N.H., Goldman, D., 2017. Imaging Genetics and Genomics in Psychiatry: A Critical Review of Progress and Potential. Biol. Psychiatry.https://doi.org/10.1016/j.biopsych.2016.12.030.
Bora, E., Fornito, A., Radua, J., Walterfang, M., Seal, M., Wood, S.J., Yücel, M., Velakoulis, D., Pantelis, C., 2011. Neuroanatomical abnormalities in schizophrenia: A multimodal voxelwise meta-analysis and meta-regression analysis. Schizophrenia Research.https://doi.org/10.1016/j.schres.2010.12.020.
Bramon, E., Psychosis Endophenotypes International Consortium, Wellcome Trust Case-Control Consortium 2, Pirinen, M., Strange, A., Lin, K., Freeman, C., Bellenguez, C., Su, Z., Band, G., Pearson, R., Vukcevic, D., Langford, C., Deloukas, P., Hunt, S., Gray, E., Dronov, S., Potter, S.C., Tashakkori-Ghanbaria, A., Edkins, S., Bumpstead, S.J., Arranz, M.J., Bakker, S., Bender, S., Bruggeman, R., Cahn, W., Chandler, D., Collier, D.A., Crespo-Facorro, B., Dazzan, P., de Haan, L., Di Forti, M., Dragović, M., Giegling, I., Hall, J., Iyegbe, C., Jablensky, A., Kahn, R.S., Kalaydjieva, L., Kravariti, E., Lawrie, S., Linszen, D.H., Mata, I., McDonald, C., McIntosh, A., Myin-Germeys, I., Ophoff, R.A., Pariante, C.M., Paunio, T., Picchioni, M., Consortium, P.G., Ripke, S., Rujescu, D., Sauer, H., Shaikh, M., Sussmann, J., Suvisaari, J., Tosato, S., Toulopoulou, T., Van Os, J., Walshe, M., Weisbrod, M., Whalley, H., Wiersma, D., Blackwell, J.M., Brown, M.A., Casas, J.P., Corvin, A., Duncanson, A., Jankowski, J.A.Z., Markus, H.S., Mathew, C.G., Palmer, C.N.A., Plomin, R., Rautanen, A., Sawcer, S.J., Trembath, R.C., Wood, N.W., Barroso, I., Peltonen, L., Lewis, C.M., Murray, R.M., Donnelly, P., Powell, J., Spencer, C.C.A., 2014. A genome-wide association analysis of a broad
psychosis phenotype identifies three loci for further investigation. Biol. Psychiatry 75, 386–397.https://doi.org/10.1016/j.biopsych.2013.03.033.
Brikell, I., Kuja-Halkola, R., Larsson, H., 2015. Heritability of attention-deficit hyper-activity disorder in adults. Am. J. Med. Genet. Part B Neuropsychiatr. Genet. 168, 406–413.https://doi.org/10.1002/ajmg.b.32335.
Burmeister, M., McInnis, M.G., Zollner, S., Zöllner, S., 2008. Psychiatric genetics: progress amid controversy. Nat. Rev. Genet. 9, 527–540.https://doi.org/10.1038/nrg2381.
Buxbaum, J.D., 2009. Multiple rare variants in the etiology of autism spectrum disorders. Dialogues Clin. Neurosci. 11, 35–43.
Carter, C.S., Bearden, C.E., Bullmore, E.T., Geschwind, D.H., Glahn, D.C., Gur, R.E., Meyer-Lindenberg, A., Weinberger, D.R., 2017. Enhancing the Informativeness and Replicability of Imaging Genomics Studies. Biol. Psychiatry 82, 157–164.https://doi. org/10.1016/j.biopsych.2016.08.019.
Cauda, F., Geda, E., Sacco, K., D'Agata, F., Duca, S., Geminiani, G., Keller, R., 2011. Grey matter abnormality in autism spectrum disorder: an activation likelihood estimation meta-analysis study. J. Neurol. Neurosurg. Psychiatry 82, 1304–1313.https://doi. org/10.1136/jnnp.2010.239111.
Chatterjee, N., Shi, J., García-Closas, M., 2016. Developing and evaluating polygenic risk prediction models for stratified disease prevention. Nat. Rev. Genet. 14210, 14205–14210.https://doi.org/10.1038/nrg.2016.27.
Chen, D.T., Jiang, X., Akula, N., Shugart, Y.Y., Wendland, J.R., Steele, C.J.M., Kassem, L., Park, J.-H., Chatterjee, N., Jamain, S., Cheng, A., Leboyer, M., Muglia, P., Schulze, T.G., Cichon, S., Nöthen, M.M., Rietschel, M., McMahon, F.J., 2013. Genome-wide association study meta-analysis of European and Asian-ancestry samples identifies three novel loci associated with bipolar disorder. Mol. Psychiatry 18, 195–205.
https://doi.org/10.1038/mp.2011.157.
Cohen, J.D., Daw, N., Engelhardt, B., Hasson, U., Li, K., Niv, Y., Norman, K.A., Pillow, J., Ramadge, P.J., Turk-Browne, N.B., Willke, T.L., 2017. Computational approaches to fMRI analysis. Nat. Neurosci. 20, 304–313.https://doi.org/10.1038/nn.4499. Cole, J., Chaddock, C.A., Farmer, A.E., Aitchison, K.J., Simmons, A., McGuffin, P., Fu,
C.H.Y., 2012. White matter abnormalities and illness severity in major depressive disorder. Br. J. Psychiatry 201, 33–39.https://doi.org/10.1192/bjp.bp.111.100594. Cole, J.H., Boyle, C.P., Simmons, A., Cohen-Woods, S., Rivera, M., McGuffin, P.,
Thompson, P.M., Fu, C.H.Y., 2013. Body mass index, but not FTO genotype or major depressive disorder, influences brain structure. Neuroscience 252, 109–117.https:// doi.org/10.1016/j.neuroscience.2013.07.015.
Costafreda, S.G., McCann, P., Saker, P., Cole, J.H., Cohen-Woods, S., Farmer, A.E., Aitchison, K.J., McGuffin, P., Fu, C.H.Y., 2013. Modulation of amygdala response and connectivity in depression by serotonin transporter polymorphism and diagnosis. J. Affect. Disord. 150, 96–103.https://doi.org/10.1016/j.jad.2013.02.028. Craddock, N., O'Donovan, M.C., Owen, M.J., 2005. The genetics of schizophrenia and
bipolar disorder: dissecting psychosis. J. Med. Genet. 42, 193–204.https://doi.org/ 10.1136/jmg.2005.030718.
Cross-Disorder Group of the Psychiatric Genomics Consortium, 2013. Identification of risk loci with shared effects on five major psychiatric disorders: a genome-wide analysis. Lancet 381, 1371–1379.https://doi.org/10.1016/S0140-6736(12)62129-1. Das, S., Forer, L., Schönherr, S., Sidore, C., Locke, A.E., Kwong, A., Vrieze, S.I., Chew,
E.Y., Levy, S., McGue, M., Schlessinger, D., Stambolian, D., Loh, P.-R., Iacono, W.G., Swaroop, A., Scott, L.J., Cucca, F., Kronenberg, F., Boehnke, M., Abecasis, G.R., Fuchsberger, C., 2016. Next-generation genotype imputation service and methods. Nat. Genet. 48, 1284–1287.https://doi.org/10.1038/ng.3656.
Deramus, T.P., Kana, R.K., 2015. Anatomical likelihood estimation meta-analysis of grey and white matter anomalies in autism spectrum disorders. NeuroImage Clin. 7, 525–536.https://doi.org/10.1016/j.nicl.2014.11.004.
Derks, E.M., Vorstman, J.A.S., Ripke, S., Kahn, R.S., Ophoff, R.A., 2012. Investigation of the Genetic Association between Quantitative Measures of Psychosis and Schizophrenia: A Polygenic Risk Score Analysis. PLoS One 7, e37852.https://doi. org/10.1371/journal.pone.0037852.
Dima, D., Breen, G., 2015. Polygenic risk scores in imaging genetics: Usefulness and applications. J. Psychopharmacol. 29, 867–871.https://doi.org/10.1177/ 0269881115584470.
Dima, D., de Jong, S., Breen, G., Frangou, S., 2016a. The polygenic risk for bipolar dis-order influences brain regional function relating to visual and default state processing of emotional information. NeuroImage Clin. 12, 838–844.https://doi.org/10.1016/j. nicl.2016.10.022.
Dima, D., Roberts, R.E., Frangou, S., 2016b. Connectomic markers of disease expression, genetic risk and resilience in bipolar disorder. Transl. Psychiatry 6, e706.https://doi. org/10.1038/tp.2015.193.
Doan, N.T., Kaufmann, T., Bettella, F., Jørgensen, K.N., Brandt, C.L., Moberget, T., Alnæs, D., Douaud, G., Duff, E., Djurovic, S., Melle, I., Ueland, T., Agartz, I., Andreassen, O.A., Westlye, L.T., 2017. Distinct multivariate brain morphological patterns and their added predictive value with cognitive and polygenic risk scores in mental dis-orders. NeuroImage Clin. 15, 719–731.https://doi.org/10.1016/j.nicl.2017.06.014. Doyle, O.M., Bois, C., Thomson, P., Romaniuk, L., Whitcher, B., Williams, S.C.R.,
Turkheimer, F.E., Stefansson, H., McIntosh, A.M., Mehta, M.A., Lawrie, S.M., 2015. The cortical thickness phenotype of individuals with DISC1 translocation resembles schizophrenia. J. Clin. Invest. 125, 3714–3722.https://doi.org/10.1172/JCI82636. Dudbridge, F., 2013. Power and Predictive Accuracy of Polygenic Risk Scores. PLoS
Genet. 9, e1003348.https://doi.org/10.1371/journal.pgen.1003348.
Duerden, E.G., Mak-Fan, K.M., Taylor, M.J., Roberts, S.W., 2012. Regional differences in grey and white matter in children and adults with autism spectrum disorders: An activation likelihood estimate (ALE) meta-analysis. Autism Res. 5, 49–66.https:// doi.org/10.1002/aur.235.
Euesden, J., Lewis, C.M., O'Reilly, P.F., 2014. PRSice: Polygenic Risk Score software. Bioinformatics 31, 1466–1468.https://doi.org/10.1093/bioinformatics/btu848.
DSM- IV-TR Axis I Disorders, Research Version, Non-Patient Edition, (SCID-I/NP). New York Biometrics Res.
First, M.B., Spitzer, R.L., Gibbon, M., Williams, J.B.W., 2002b. Structured Clinical Interview for DSM-IV-TR Axis I Disorders, Research Version, Patient Edition. (SCID-I/ P). Biometrics Research, New York State Psychiatric Institute, New York. Frangou, S., Dima, D., Jogia, J., 2017. Towards person-centered neuroimaging markers
for resilience and vulnerability in Bipolar Disorder. Neuroimage 145, 230–237.
https://doi.org/10.1016/j.neuroimage.2016.08.066.
Franke, B., Faraone, S.V., Asherson, P., Buitelaar, J., Bau, C.H.D., Ramos-Quiroga, J.A., Mick, E., Grevet, E.H., Johansson, S., Haavik, J., Lesch, K.-P.P., Cormand, B., Reif, A., IMpACT, on behalf of the I.M. persistent A.C, 2011. The genetics of attention deficit/ hyperactivity disorder in adults, a review. Mol. Psychiatry 17, 960–987.https://doi. org/10.1038/mp.2011.138.
Frodl, T., Skokauskas, N., 2012. Meta-analysis of structural MRI studies in children and adults with attention deficit hyperactivity disorder indicates treatment effects. Acta Psychiatr. Scand. 125, 114–126.https://doi.org/10.1111/j.1600-0447.2011. 01786.x.
Geschwind, D.H., Flint, J., 2015. Genetics and genomics of psychiatric disease. Science (80-.) 349, 1489–1494.https://doi.org/10.1126/science.aaa8954.
Glahn, D.C., Thompson, P.M., Blangero, J., 2007. Neuroimaging endophenotypes: stra-tegies for finding genes influencing brain structure and function. Hum. Brain Mapp. 28, 488–501.https://doi.org/10.1002/hbm.20401.
Glahn, D.C., Knowles, E.E.M., McKay, D.R., Sprooten, E., Raventós, H., Blangero, J., Gottesman, I.I., Almasy, L., 2014. Arguments for the sake of endophenotypes: ex-amining common misconceptions about the use of endophenotypes in psychiatric genetics. Am. J. Med. Genet. B. Neuropsychiatr. Genet. 165B, 122–130.https://doi. org/10.1002/ajmg.b.32221.
Gong, Q., Li, L., Du, M., Pettersson-Yeo, W., Crossley, N., Yang, X., Li, J., Huang, X., Mechelli, A., 2014. Quantitative prediction of individual psychopathology in trauma survivors using resting-state FMRI. Neuropsychopharmacology 39, 681–687.https:// doi.org/10.1038/npp.2013.251.
Hall, M.H., Smoller, J.W., 2010. A new role for endophenotypes in the GWAS era: functional characterization of risk variants. Harvard Rev. Psychiatry 18, 67–74. Hamilton, M., 1960. A Rating Scale for Depression. J. Neurol. Neurosurg. Psychiat 23,
56–62.https://doi.org/10.1136/jnnp.23.1.56.
Harrison, P.J., 2015. Recent genetic findings in schizophrenia and their therapeutic re-levance. J. Psychopharmacol. 29, 85–96.https://doi.org/10.1177/
0269881114553647.
Hibar, D.P., Westlye, L.T., Erp, T.G.M., Rasmussen, J., Leonardo, C.D., Faskowitz, J., Haukvik, U.K., Hartberg, C.B., Doan, N.T., Agartz, I., Dale, A.M., Gruber, O., Krämer, B., Trost, S., Liberg, B., Abé, C., Ekman, C.J., Ingvar, M., Landén, M., Fears, S.C., Freimer, N.B., Bearden, C.E., Sprooten, E., Glahn, D.C., Pearlson, G.D., Emsell, L., Kenney, J., Scanlon, C., McDonald, C., Cannon, D.M., Almeida, J., Versace, A., Caseras, X., Lawrence, N.S., Phillips, M.L., Dima, D., Delvecchio, G., Frangou, S., Satterthwaite, T.D., Wolf, D., Houenou, J., Henry, C., Malt, U.F., Bøen, E., Elvsåshagen, T., Young, A.H., Lloyd, A.J., Goodwin, G.M., Mackay, C.E., Bourne, C., Bilderbeck, A., Abramovic, L., Boks, M.P., Haren, N.E.M., Ophoff, R.A., Kahn, R.S., Bauer, M., Pfennig, A., Alda, M., Hajek, T., Mwangi, B., Soares, J.C., Nickson, T., Dimitrova, R., Sussmann, J.E., Hagenaars, S., Whalley, H.C., McIntosh, A.M., Thompson, P.M., Andreassen, O.A., 2016. Subcortical volumetric abnormalities in bipolar disorder. Mol. Psychiatry 21, 1710–1716.https://doi.org/10.1038/mp.2015. 227.
Hoogman, M., Bralten, J., Hibar, D.P., Mennes, M., Zwiers, M.P., Schweren, L.S.J., van Hulzen, K.J.E., Medland, S.E., Shumskaya, E., Jahanshad, N., Zeeuw, P., de Szekely, E., Sudre, G., Wolfers, T., Onnink, A.M.H., Dammers, J.T., Mostert, J.C., Vives-Gilabert, Y., Kohls, G., Oberwelland, E., Seitz, J., Schulte-Rüther, M., Ambrosino, S., Doyle, A.E., Høvik, M.F., Dramsdahl, M., Tamm, L., van Erp, T.G.M., Dale, A., Schork, A., Conzelmann, A., Zierhut, K., Baur, R., McCarthy, H., Yoncheva, Y.N., Cubillo, A., Chantiluke, K., Mehta, M.A., Paloyelis, Y., Hohmann, S., Baumeister, S., Bramati, I., Mattos, P., Tovar-Moll, F., Douglas, P., Banaschewski, T., Brandeis, D., Kuntsi, J., Asherson, P., Rubia, K., Kelly, C., Martino, A., Di Milham, M.P., Castellanos, F.X., Frodl, T., Zentis, M., Lesch, K.-P., Reif, A., Pauli, P., Jernigan, T.L., Haavik, J., Plessen, K.J., Lundervold, A.J., Hugdahl, K., Seidman, L.J., Biederman, J., Rommelse, N., Heslenfeld, D.J., Hartman, C.A., Hoekstra, P.J., Oosterlaan, J., Polier, G., von Konrad, K., Vilarroya, O., Ramos-Quiroga, J.A., Soliva, J.C., Durston, S., Buitelaar, J.K., Faraone, S.V., Shaw, P., Thompson, P.M., Franke, B., 2017. Subcortical brain volume differences in participants with attention deficit hyperactivity disorder in children and adults: a cross-sectional mega-analysis. The Lancet Psychiatry 4, 310–319.https://doi.org/10.1016/S2215-0366(17)30049-4.
Jansen, A.G., Mous, S.E., White, T., Posthuma, D., Polderman, T.J.C., 2015. What Twin Studies Tell Us About the Heritability of Brain Development, Morphology, and Function: A Review. Neuropsychol. Rev. https://doi.org/10.1007/s11065-015-9278-9.
Lee, S.H., Ripke, S., Neale, B.M., Faraone, S.V., Purcell, S.M., Perlis, R.H., Mowry, B.J., Thapar, A., Goddard, M.E., Witte, J.S., Absher, D., Agartz, I., Akil, H., Amin, F., Andreassen, O.A., Anjorin, A., Anney, R., Anttila, V., Arking, D.E., Asherson, P., Azevedo, M.H., Backlund, L., Badner, J.A., Bailey, A.J., Banaschewski, T., Barchas, J.D., Barnes, M.R., Barrett, T.B., Bass, N., Battaglia, A., Bauer, M., Bayés, M., Bellivier, F., Bergen, S.E., Berrettini, W., Betancur, C., Bettecken, T., Biederman, J., Binder, E.B., Black, D.W., Blackwood, D.H.R., Bloss, C.S., Boehnke, M., Boomsma, D.I., Breen, G., Breuer, R., Bruggeman, R., Cormican, P., Buccola, N.G., Buitelaar, J.K., Bunney, W.E., Buxbaum, J.D., Byerley, W.F., Byrne, E.M., Caesar, S., Cahn, W., Cantor, R.M., Casas, M., Chakravarti, A., Chambert, K., Choudhury, K., Cichon, S., Cloninger, C.R., Collier, D.A., Cook, E.H., Coon, H., Cormand, B., Corvin, A., Coryell, W.H., Craig, D.W., Craig, I.W., Crosbie, J., Cuccaro, M.L., Curtis, D., Czamara, D., Datta, S., Dawson, G., Day, R., De Geus, E.J., Degenhardt, F., Djurovic, S., Donohoe, G.J.,
Muir, W.J., Müller-Myhsok, B., Murtha, M., Myers, R.M., Myin-Germeys, I., Neale, M.C., Nelson, S.F., Nievergelt, C.M., Nikolov, I., Nimgaonkar, V., Nolen, W.A., Nöthen, M.M., Nurnberger, J.I., Nwulia, E.A., Nyholt, D.R., O'Dushlaine, C., Oades, R.D., Olincy, A., Oliveira, G., Olsen, L., Ophoff, R.A., Osby, U., Owen, M.J., Palotie, A., Parr, J.R., Paterson, A.D., Pato, C.N., Pato, M.T., Penninx, B.W., Pergadia, M.L., Pericak-Vance, M.A., Pickard, B.S., Pimm, J., Piven, J., Posthuma, D., Potash, J.B., Poustka, F., Propping, P., Puri, V., Quested, D.J., Quinn, E.M., Ramos-Quiroga, J.A., Rasmussen, H.B., Raychaudhuri, S., Rehnström, K., Reif, A., Ribasés, M., Rice, J.P., Rietschel, M., Roeder, K., Roeyers, H., Rossin, L., Rothenberger, A., Rouleau, G., Ruderfer, D., Rujescu, D., Sanders, A.R., Sanders, S.J., Santangelo, S.L., Sergeant, J.A., Schachar, R., Schalling, M., Schatzberg, A.F., Scheftner, W.A., Schellenberg, G.D., Scherer, S.W., Schork, N.J., Schulze, T.G., Schumacher, J., Schwarz, M., Scolnick, E., Scott, L.J., Shi, J., Shilling, P.D., Shyn, S.I., Silverman, J.M., Slager, S.L., Smalley, S.L., Smit, J.H., Smith, E.N., Sonuga-Barke, E.J.S., St Clair, D., State, M., Steffens, M., Steinhausen, H.C., Strauss, J.S., Strohmaier, J., Stroup, T.S., Sutcliffe, J.S., Szatmari, P., Szelinger, S., Thirumalai, S., Thompson, R.C., Todorov, A.A., Tozzi, F., Treutlein, J., Uhr, M., van den Oord, E.J.C.G., Van Grootheest, G., Van Os, J., Vicente, A.M., Vieland, V.J., Vincent, J.B., Visscher, P.M., Walsh, C.A., Wassink, T.H., Watson, S.J., Weissman, M.M., Werge, T., Wienker, T.F., Wijsman, E.M., Willemsen, G., Williams, N., Willsey, A.J., Witt, S.H., Xu, W., Young, A.H., Yu, T.W., Zammit, S., Zandi, P.P., Zhang, P., Zitman, F.G., Zöllner, S., (IIBDGC), I.I.B.D.G.C, Devlin, B., Kelsoe, J.R., Sklar, P., Daly, M.J., O'Donovan, M.C., Craddock, N., Sullivan, P.F., Smoller, J.W., Kendler, K.S., Wray, N.R., 2013. Genetic relationship between five psychiatric disorders estimated from genome-wide SNPs. Nat. Genet. 45, 984–994.
https://doi.org/10.1038/ng.2711.
Lee, P.H., Baker, J.T., Holmes, A.J., Jahanshad, N., Ge, T., Jung, J.-Y., Cruz, Y., Manoach, D.S., Hibar, D.P., Faskowitz, J., McMahon, K.L., de Zubicaray, G.I., Martin, N.H., Wright, M.J., Öngür, D., Buckner, R., Roffman, J., Thompson, P.M., Smoller, J.W., 2016. Partitioning heritability analysis reveals a shared genetic basis of brain anatomy and schizophrenia. Mol. Psychiatry 1–10.https://doi.org/10.1038/mp. 2016.164.
Lichtenstein, P., Yip, B.H., Björk, C., Pawitan, Y., Cannon, T.D., Sullivan, P.F., Hultman, C.M., 2009. Common genetic determinants of schizophrenia and bipolar disorder in Swedish families: a population-based study. Lancet 373, 234–239.https://doi.org/ 10.1016/S0140-6736(09)60072-6.
Marshall, C.R., Howrigan, D.P., Merico, D., Thiruvahindrapuram, B., Wu, W., Greer, D.S., Antaki, D., Shetty, A., Holmans, P.A., Pinto, D., Gujral, M., Brandler, W.M., Malhotra, D., Wang, Z., Fajarado, K.V.F., Maile, M.S., Ripke, S., Agartz, I., Albus, M., Alexander, M., Amin, F., Atkins, J., Bacanu, S.A., Belliveau, R.A., Bergen, S.E., Bertalan, M., Bevilacqua, E., Bigdeli, T.B., Black, D.W., Bruggeman, R., Buccola, N.G., Buckner, R.L., Bulik-Sullivan, B., Byerley, W., Cahn, W., Cai, G., Cairns, M.J., Campion, D., Cantor, R.M., Carr, V.J., Carrera, N., Catts, S.V., Chambert, K.D., Cheng, W., Cloninger, C.R., Cohen, D., Cormican, P., Craddock, N., Crespo-Facorro, B., Crowley, J.J., Curtis, D., Davidson, M., Davis, K.L., Degenhardt, F., Del Favero, J., DeLisi, L.E., Dikeos, D., Dinan, T., Djurovic, S., Donohoe, G., Drapeau, E., Duan, J., Dudbridge, F., Eichhammer, P., Eriksson, J., Escott-Price, V., Essioux, L., Fanous, A.H., Farh, K.-H., Farrell, M.S., Frank, J., Franke, L., Freedman, R., Freimer, N.B., Friedman, J.I., Forstner, A.J., Fromer, M., Genovese, G., Georgieva, L., Gershon, E.S., Giegling, I., Giusti-Rodríguez, P., Godard, S., Goldstein, J.I., Gratten, J., de Haan, L., Hamshere, M.L., Hansen, M., Hansen, T., Haroutunian, V., Hartmann, A.M., Henskens, F.A., Herms, S., Hirschhorn, J.N., Hoffmann, P., Hofman, A., Huang, H., Ikeda, M., Joa, I., Kähler, A.K., Kahn, R.S., Kalaydjieva, L., Karjalainen, J., Kavanagh, D., Keller, M.C., Kelly, B.J., Kennedy, J.L., Kim, Y., Knowles, J.A., Konte, B., Laurent, C., Lee, P., Lee, S.H., Legge, S.E., Lerer, B., Levy, D.L., Liang, K.-Y., Lieberman, J., Lönnqvist, J., Loughland, C.M., Magnusson, P.K.E., Maher, B.S., Maier, W., Mallet, J., Mattheisen, M., Mattingsdal, M., McCarley, R.W., McDonald, C., McIntosh, A.M., Meier, S., Meijer, C.J., Melle, I., Mesholam-Gately, R.I., Metspalu, A., Michie, P.T., Milani, L., Milanova, V., Mokrab, Y., Morris, D.W., Müller-Myhsok, B., Murphy, K.C., Murray, R.M., Myin-Germeys, I., Nenadic, I., Nertney, D.A., Nestadt, G., Nicodemus, K.K., Nisenbaum, L., Nordin, A., O'Callaghan, E., O'Dushlaine, C., Oh, S.-Y., Olincy, A., Olsen, L., O'Neill, F.A., Van Os, J., Pantelis, C., Papadimitriou, G.N., Parkhomenko, E., Pato, M.T., Paunio, T., Perkins, D.O., Pers, T.H., Pietiläinen, O., Pimm, J., Pocklington, A.J., Powell, J., Price, A., Pulver, A.E., Purcell, S.M., Quested, D., Rasmussen, H.B., Reichenberg, A., Reimers, M.A., Richards, A.L., Roffman, J.L., Roussos, P., Ruderfer, D.M., Salomaa, V., Sanders, A.R., Savitz, A., Schall, U., Schulze, T.G., Schwab, S.G., Scolnick, E.M., Scott, R.J., Seidman, L.J., Shi, J., Silverman, J.M., Smoller, J.W., Söderman, E., Spencer, C.C.A., Stahl, E.A., Strengman, E., Strohmaier, J., Stroup, T.S., Suvisaari, J., Svrakic, D.M., Szatkiewicz, J.P., Thirumalai, S., Tooney, P.A., Veijola, J., Visscher, P.M., Waddington, J., Walsh, D., Webb, B.T., Weiser, M., Wildenauer, D.B., Williams, N.M., Williams, S., Witt, S.H., Wolen, A.R., Wormley, B.K., Wray, N.R., Wu, J.Q., Zai, C.C., Adolfsson, R., Andreassen, O.A., Blackwood, D.H.R., Bramon, E., Buxbaum, J.D., Cichon, S., Collier, D.A., Corvin, A., Daly, M.J., Darvasi, A., Domenici, E., Esko, T., Gejman, P.V., Gill, M., Gurling, H., Hultman, C.M., Iwata, N., Jablensky, A.V., Jönsson, E.G., Kendler, K.S., Kirov, G., Knight, J., Levinson, D.F., Li, Q.S., McCarroll, S.A., McQuillin, A., Moran, J.L., Mowry, B.J., Nöthen, M.M., Ophoff, R.A., Owen, M.J., Palotie, A., Pato, C.N., Petryshen, T.L., Posthuma, D., Rietschel, M., Riley, B.P., Rujescu, D., Sklar, P., St Clair, D., Walters, J.T.R., Werge, T., Sullivan, P.F., O'Donovan, M.C., Scherer, S.W., Neale, B.M., Sebat, J., 2016. Contribution of copy number variants to schizophrenia from a genome-wide study of 41,321 subjects. Nat. Genet. 49, 1–12.https://doi.org/10.1038/ng.3725. McIntosh, A.M., Job, D.E., Moorhead, W.J., Harrison, L.K., Whalley, H.C., Johnstone,
E.C., Lawrie, S.M., 2006. Genetic liability to schizophrenia or bipolar disorder and its relationship to brain structure. Am. J. Med. Genet. Part B Neuropsychiatr. Genet. 141B, 76–83.https://doi.org/10.1002/ajmg.b.30254.
Mechelli, A., Price, C.J., Friston, K.J., Ashburner, J., 2005. Voxel-Based Morphometry of the Human Brain: Methods and Applications. Bentham Sci. Publ. Ltd 1, 105–113.
Moradi, E., Hallikainen, I., Hänninen, T., Tohka, J., Alzheimer's Disease Neuroimaging Initiative, 2017. Rey's Auditory Verbal Learning Test scores can be predicted from whole brain MRI in Alzheimer's disease. NeuroImage. Clin. 13, 415–427.https://doi. org/10.1016/j.nicl.2016.12.011.
Nakao, T., Radua, J., Rubia, K., Mataix-Cols, D., 2011. Gray matter volume abnormalities in ADHD: Voxel-based meta-analysis exploring the effects of age and stimulant medication. Am. J. Psychiatry.https://doi.org/10.1176/appi.ajp.2011.11020281. Neilson, E., Bois, C., Gibson, J., Duff, B., Watson, A., Roberts, N., Brandon, N.J., Dunlop,
J., Hall, J., McIntosh, A.M., Whalley, H.C., Lawrie, S.M., 2016. Effects of environ-mental risks and polygenic loading for schizophrenia on cortical thickness. Schizophr. Res.https://doi.org/10.1016/j.schres.2016.12.011.
Nickl-Jockschat, T., Habel, U., Maria Michel, T., Manning, J., Laird, A.R., Fox, P.T., Schneider, F., Eickhoff, S.B., 2012. Brain structure anomalies in autism spectrum disorder-a meta-analysis of VBM studies using anatomic likelihood estimation. Hum. Brain Mapp. 33, 1470–1489.https://doi.org/10.1002/hbm.21299.
Palaniyappan, L., Maayan, N., Bergman, H., Davenport, C., Adams, C.E., Soares-Weiser, K., 2015. Voxel-based morphometry for separation of schizophrenia from other types of psychosis in first episode psychosis. Cochrane database Syst. Rev.https://doi.org/ 10.1002/14651858.CD011021.pub2.
Papiol, S., Mitjans, M., Assogna, F., Piras, F., Hammer, C., Caltagirone, C., Arias, B., Ehrenreich, H., Spalletta, G., 2014. Polygenic determinants of white matter volume derived from GWAS lack reproducibility in a replicate sample. Transl. Psychiatry 4, e362.https://doi.org/10.1038/tp.2013.126.
Patterson, N., Price, A.L., Reich, D., 2006. Population Structure and Eigenanalysis. PLoS Genet 2.https://doi.org/10.1371/journal.pgen.0020190.
Peper, J.S., Brouwer, R.M., Boomsma, D.I., Kahn, R.S., Hulshoff Pol, H.E., 2007. Genetic influences on human brain structure: A review of brain imaging studies in twins. Hum. Brain Mapp.https://doi.org/10.1002/hbm.20398.
Power, R.A., Tansey, K.E., Buttensch??n, H.N., Cohen-Woods, S., Bigdeli, T., Hall, L.S., Kutalik, Z., Lee, S.H., Ripke, S., Steinberg, S., Teumer, A., Viktorin, A., Wray, N.R., Arolt, V., Baune, B.T., Boomsma, D.I., B??rglum, A.D., Byrne, E.M., Castelao, E., Craddock, N., Craig, I.W., Dannlowski, U., Deary, I.J., Degenhardt, F., Forstner, A.J., Gordon, S.D., Grabe, H.J., Grove, J., Hamilton, S.P., Hayward, C., Heath, A.C., Hocking, L.J., Homuth, G., Hottenga, J.J., Kloiber, S., Krogh, J., Land??n, M., Lang, M., Levinson, D.F., Lichtenstein, P., Lucae, S., MacIntyre, D.J., Madden, P., Magnusson, P.K.E., Martin, N.G., McIntosh, A.M., Middeldorp, C.M., Milaneschi, Y., Montgomery, G.W., Mors, O., M??ller-Myhsok, B., Nyholt, D.R., Oskarsson, H., Owen, M.J., Padmanabhan, S., Penninx, B.W.J.H., Pergadia, M.L., Porteous, D.J., Potash, J.B., Preisig, M., Rivera, M., Shi, J., Shyn, S.I., Sigurdsson, E., Smit, J.H., Smith, B.H., Stefansson, H., Stefansson, K., Strohmaier, J., Sullivan, P.F., Thomson, P., Thorgeirsson, T.E., Van der Auwera, S., Weissman, M.M., Breen, G., Lewis, C.M., 2015. Genome-wide Association for Major Depression Through Age at Onset Stratification: Major Depressive Disorder Working Group of the Psychiatric Genomics Consortium. Biol. Psychiatry 81, 325–335.https://doi.org/10.1016/j.biopsych.2016. 05.010.
Purcell, S., Neale, B., Todd-Brown, K., Thomas, L., Ferreira, M.A.R., Bender, D., Maller, J., Sklar, P., de Bakker, P.I.W., Daly, M.J., Sham, P.C., 2007. PLINK: A Tool Set for Whole-Genome Association and Population-Based Linkage Analyses. Am. J. Hum. Genet. 81, 559–575.https://doi.org/10.1086/519795.
Purcell, S.M., Wray, N.R., Stone, J.L., Visscher, P.M., O'Donovan, M.C., Sullivan, P.F., Sklar, P., 2009. Common polygenic variation contributes to risk of schizophrenia and bipolar disorder. Nature 460, 748–752.https://doi.org/10.1038/nature08185. Radua, J., Borgwardt, S., Crescini, A., Mataix-Cols, D., Meyer-Lindenberg, A., McGuire,
P.K.K., Fusar-Poli, P., 2012. Multimodal meta-analysis of structural and functional brain changes in first episode psychosis and the effects of antipsy