Dennis Sungtae Kim
In Partial Fulfillment of the Requirements for the
degree of
Doctor of Philosophy
CALIFORNIA INSTITUTE OF TECHNOLOGY
Pasadena, California
2018
c 2018
Dennis Sungtae Kim ORCID: 0000-0002-5707-2609
inelastic neutron scattering measurements at the Spallation Neutron Source
on ARCS, a wide-angular chopper spectrometer, to measure phonon
disper-sions and density of states over a wide range of temperatures. Large phonon
anharmonicities manifested by phonon energy shifts and broadenings were
ob-served in both measured phonon dispersions and phonon density of states. The
sources of deviations from the simple harmonic model with temperature were
elucidated using experimentally assessed lattice dynamics coupled withab initio
methods. Pure anharmonicity dominates the changes in lattice dynamics with
temperature and therefore drive the entropy and thermophysical properties of
thermal expansion and thermal conductivity. Crystal structure, anharmonicity,
and nuclear quantum effects all play important roles in the thermal expansion of
silicon, and a simple mechanical explanation is inappropriate. The quantum
ef-fect of nuclear vibrations is also expected to be important for thermal expansion
of many materials. My experimental techniques capture the linewidth
broad-enings from phonon anharmonicity needed to calculate thermal conductivity.
The methods developed for data reduction on single crystal inelastic neutron
scattering data and predicting macroscopic quantities should also be useful for
understanding microscopic mechanisms behind thermophysical properties for
PUBLISHED CONTENT AND CONTRIBUTIONS
1D. S. Kim, H. L. Smith, J. L. Niedziela, C. W. Li, D. L. Abernathy, and B.
Fultz, “Phonon anharmonicity in silicon from 100 to 1500 K”,Phys. Rev. B
91, 014307 (2015) 10.1103/PhysRevB.91.014307,
D.S.K participated in the conception of the project, prepared sample and conducted the experiment, reduced and analyzed the data, calculated the computational analysis, and conducted the writing of the manuscript.
2T. Lan, C. W. Li, O. Hellman, D. S. Kim, J. A. Mu˜noz, H. Smith, D. L.
Abernathy, and B. Fultz, “ Phonon quarticity induced by changes in phonon-tracked hybridization during lattice expansion and its stabilization of rutile TiO2 ”, Phys. Rev. B 92, 054304 (2015) 10.1103/PhysRevB.92.054304, D.S.K participated and performed inelastic neutron scattering experiments on TiO2 samples, as well as reduced and analyze low incident energy data.
3H. L. Smith, C. W. Li, A. Hoff, G. R. Garrett, D. S. Kim, F. C. Yang, M. S.
Lucas, T. Swan-Wood, J. Y. Y. Lin, M. B. Stone, D. L. Abernathy, M. D. Demetriou, and B. Fultz, “Separating the configurational and vibrational entropy contributions in metallic glasses”, Nature Physics 28, 373 (2017)
10.1038/nphys4142,
D.S.K participated in sample preparation, data analysis, and commented on the manuscript.
4D. S. Kim, O. Hellman, J. Herriman, H. L. Smith, J. Y. Y. Lin, N. Shulumba,
List of Illustrations . . . vi
List of Tables . . . xiii
Chapter I: Introduction . . . 1
Chapter II: Vibrational Entropy of Silicon . . . 6
Chapter III: Thermal Expansion of Silicon . . . 32
Chapter IV: Thermal Conductivity of Silicon . . . 72
LIST OF ILLUSTRATIONS
Number Page
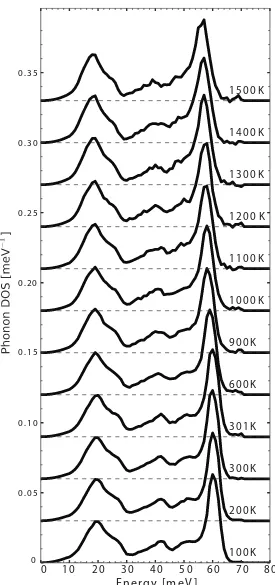
2.1 Phonon DOS curves of silicon,gT(ε), normalized to unity. Curves
are offset for clarity. . . 8
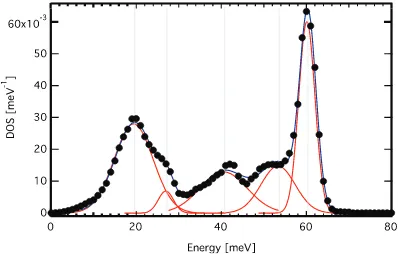
2.2 Gaussian fitted 100 K measured DOS of silicon. Individual
com-ponents are red, black curve is their sum. . . 10
2.3 Phonon dispersion and DOS of silicon at the quasiharmonic 100 K
equilibrium volume (black solid line) scaled in energy to fit the
experimental 100 K DOS (orange dotted line) from Fig.2.1. The
distinct features are labeled with their corresponding marker used
in Fig.2.4. . . 12
2.4 The negative of the fractional thermal shifts of the five features
of the DOS: transverse acoustic (TA: red squares and purple
circles), longitudinal acoustic (LA: blue pentagons), longitudinal
acoustic and optical (LA/LO: green hexagons), and transverse
and longitudinal optical modes (TO/LO: black triangles). The
average between the shifts of the five features is shown by a
dotted orange line. . . 14
2.5 Silicon phonon DOS of experimental measurements at 100 (blue)
and 1500 (red) K (solid lines). A DOS at 1500 K (dotted line) is
obtained from shifting and renormalizing the measured DOS at
(blue diamonds) [45]. Inset enlarges the high temperature region. 21
2.7 Enlargement of vibrational entropy from 1200 to 1500 K. The
difference between experimental (orange circles) and
quasihar-monic (green triangles) changes sign with temperature as
quasi-harmonic drifts further from the experimental points. . . 24
3.1 Experimental phonon dispersions of silicon. Inelastic neutron
scattering data of silicon were measured on the ARCS
time-of-flight spectrometer at (a) 100 K, (b) 200 K, (c) 300 K, (d)
900 K, (e) 1200 K, (f) 1500 K. The 4-D phonon dynamical
struc-ture factor, S(q,ε), were reduced, multiphonon subtracted, and
“folded” into one irreducible wedge in the first Brillouin zone.
Phonon dispersions are shown along high symmetry lines and
through the zone (L–X). . . 34
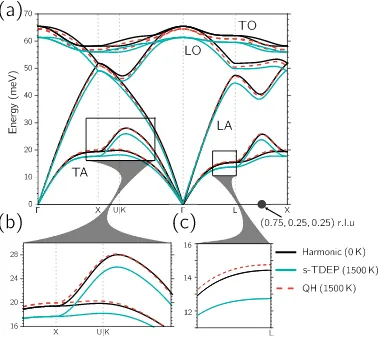
3.2 Comparison between experimental, s-TDEP and quasiharmonic
(QH) ab initio calculations throughout the Brillouin zone. (a)–
(c), Phonon dispersions of silicon from harmonic, s-TDEP, and
QHab initiodensity functional theory calculations. The
(0.75,0.25,0.25)-point is shown as a black circle marker for reference. (b),(c)
3.3 Comparison between experimental, s-TDEP and quasiharmonic
(QH) ab initio calculations throughout the Brillouin zone. (a)
Density of fractional phonon energy shifts with temperature. The
densities from all branches (s-TDEP: teal, QH: red) and densities
from just the low transverse modes are offset and scaled for
clarity. (b) The density of the 700 K s-TDEP. Notice the more
negative peak consists of a majority of TA-modes. . . 39
3.4 Comparison between experimental, s-TDEP and quasiharmonic
(QH)ab initiocalculations throughout the Brillouin zone.
Temperature-dependent phonon shifts, (ε−ε100 K)/ε100 K, of the low-energy transverse modes at the (a) L, (b) X, (c) (0.75,0.25,0.25) r.l.u.,
and (d) K points. Experimental fits of phonon centroids with
standard (1σ) error-bars from the present work are shown
along-side calculated shifts and previously reported shifts [14]. . . 40
3.5 Phonon shifts and entropy differences from constant volume ab
initio calculations. (a)–(f) Density of fractional shifts with
tem-perature at constant volumes using the s-TDEP method. The
mean (dashed color line), median (solid color line), and the 5th
and 95th percentile (black solid lines) of the density are also
shown. Calculations shown for: [(a),(d),(g)] 99 % of 0 K
vol-ume, [(b),(h),(e)] 0 K volvol-ume, and [(c),(f),(i)] 101 % of 0 K
volume. Quasiharmonic predictions are the dashed zero–lines in
(a)–(f). (g)–(i) Corresponding constant volume differences
be-tween the quasiharmonic (QH) and s-TDEP in free energies from
and experimental values at higher temperatures. . . 46
3.7 “Folded” inelastic neutron scattering data without (a) and with
(b) multiphonon subtracted S(q,ε) at 300 K. (c) Scattering
in-tensity and fitted spectrum at the X-point. Fitted peaks are
shown as the red solid line. Grey circles are without [(a)] and
black triangles with [(b)] multiphonon scattering subtracted. Black
dashed line shows subtracted multiphonon scattering intensity. . 48
3.8 Constant q-S(q,ε) data at the X point for 100, 200, 300, 900,
1200, 1500 K. Data are black markers and fits are in orange. . . 50
3.9 Inelastic neutron scattering [(a)–(c)] and first principle
calcula-tions [(d)–(f)] of S(q,ε) at 300 K along momenta q (X–Γ–X)
in different Brillouin zones. Calculated S(q,ε) was corrected for
instrument resolution and polarization effects to match the
ex-periment conditions [25, 26]. . . 52
3.10 Phonon DOS of Si from (thick line) experimental measurement
at 100 K [21], and (thin line) approximated with Debye and
3.11 (a) Heat capacities from phonons approximated by Debye and
Einstein models, using the six branches of Fig.3.10. (b)
Coef-ficient of thermal expansion, assuming all Gr¨uneisen parameters
were +1 except for TA modes set as –1. . . 57
3.12 a, Tetrahedral coordination around a central Si atom. b, four
interconnected tetrahedra of the diamond cubic structure. Thick
vertical lines are along a [111] direction. . . 61
3.13 Trends for silicons thermal expansion coefficient vs. temperature
plotted for scalings of the ratio of transverse to longitudinal force
constants between 0 and 2.8 . . . 62
3.14 Maximum negative thermal expansion coefficients taken from
each trend in Fig. S5 plotted against the scaling factor, k,
ap-plied to the ratios of transverse to longitudinal force constants. 64
3.15 Volume as a function of temperature for silicon obtained from
wedge in the first Brillouin zone. (b) Phonon scattering spectra
determined at q-point = (0.75,0.25,0.25)r.l.u.. Experimental
data is shown as purple circle markers and best fit of peaks is
in grey solid line. The longitudinal acoustic mode is highlighted
as an example of phonon lineshape deconvolution. (c)
Decon-voluted longitudinal acoustic mode phonon lineshape at q-point
= (0.75,0.25,0.25)r.l.u. at 300 K. . . 75
4.2 Temperature-dependence of phonon shifts and broadening of
the (0.75,0.25,0.25) q-point with temperature. Experimental
changes are shown as markers, and ab initio calculated linewidth
thermal trends with anharmonicity in teal solid line, and
quasi-harmonic approximation in red-dashed line. . . 77
4.3 Ab initio calculated phonon linewidths with temperature (2Γ =
1/τ). (a) Temperature dependence of shifts and broadenings
throughout the Brillouin zone. (b) A comparison between the
4.4 Brillouin zone averaged temperature-dependent phonon energies
(a) and linewidths (b). Energies calculated from experimental
fits from Table?? are in purple circle markers and ab initio
cal-culations of the s-TDEP (solid teal line) and quasiharmonic
ap-proximation (red dashed line) are also shown. . . 81
4.5 Spectral thermal conductivity (κ(ε)/κtot) at 300 (a) and 1500 K
(b). Ab initio calculated total spectral thermal conductivity of
silicon at as a black dashed line. Mode dependent spectral
func-tions are shown as the shaded area( TA: maroon and red,LA:
blue, LO: green, and TO: black). (b) Comparison between
s-TDEP (teal) and quasiharmonic (red) calculation of spectral
thermal conductivity. . . 83
4.6 Temperature-dependent thermal conductivity of silicon. Phonon
anharmonic ab intio calculations (s-TDEP) are shown as a solid
teal line and the quasiharmonic model in red dashed line.
C h a p t e r 1
INTRODUCTION
A
toms, the building blocks for all materials, are always in motion, evenat 0 K. The changes in the motion of nuclei affect the levels in en-ergy and entropy of materials, which in turn change its properties. Due to anever growing need for more efficient, cheaper, safer, and greener technologies,
there is interest in understanding the relationship between the atomic motions
and materials properties. The optimization of materials properties for a
spe-cific application will require a fundamental understanding of these relationships.
Since all manufacturing processes or synthesis conditions are influenced by the
presence of heat, the effect of atomic motion and their interactions on the
materials properties will be profound.
Starting from the seminal Gibbs free energy (G = E −T S+P V) we can see that entropy, S, is always correlated to temperature, the heat. In
many materials, especially for unary intrinsic semiconductors with a moderate
band gap, atomic vibrations make up the majority of entropy as the atoms
explore coordinate and momentum phase space [1]. Understanding how atomic
vibrations affect bonding, electronic states, to bulk properties is the basis of
this thesis. In other words, understanding the mechanisms behind changes in
entropy, anomalous thermal expansion behavior, and thermal conductivity will
result in a far greater control of the material’s thermal engineering parameter
The aim of this thesis work is to experimentally determine the
temperature-dependent lattice dynamics and elucidate its effects on thermodynamic
quan-tities and thermal transport properties. This work tests the limits of
time-of-flight inelastic neutron scattering methods to determine all phonon central
frequency shifts and linewidth broadenings with temperature in materials.
A first take on lattice dynamics is typically through an Einstein solid
where a delta function for the density of states (DOS) is used to approximate
the complexity of real solid-state materials. The Debye model, where phonon
dispersions are assumed to have constant group velocity can predict the
ex-perimental low temperature T3-dependent heat capacity behavior. Due to the
simplicity of this one fitting parameter model it is still heavily used today despite
the lack of accuracy. The accuracy, however, can further be improved through a
normal mode analysis. These harmonic phonons do capture significant portions
of thermophysical properties, but are still non-interacting with infinite lifetimes.
In this approximation phonons would never result in thermal expansion, thermal
conductivity or any interactions with other quasiparticles. A popular approach
to approximate temperature effects is through the quasiharmonic model (QH).
This assume harmonic oscillators with frequencies renormalized to account for
between atomic nuclei may lead to decreased forces based on the electronic
bonding. But intuition is not always evidence for reality. Until recently, the
ability to accurately include pure anharmonicities, phonon-phonon interactions,
through ab initio methods throughout the Brillouin zone were unavailable or
difficult to assess. But by now in 2017, many systems including “highly”
an-harmonic systems can be simulated.
The material of study in this thesis is silicon. Silicon, is the third most
abundant element on our Earths crusts and the stable phase at atmospheric
pressures is the diamond-cubic crystal structure (Fd¯3m). This material is
known for its strong covalent atomic bonds and in-direct bang-gap of 1.12
eV. This band-gap is the initial reason for silicon’s ubiquitous use in modern
semiconductor technologies, photovoltaics, thermoelectrics, nanomechanics,
and batteries. Understanding the thermal properties of silicon because of its
wide use in modern technology is of great importance. It also serves as a
perfect test case material for experimental and theoretical comparisons due to
the plethora of measured thermal quantities and synthesis capabilities already
available.
The title of this thesis emphasizes the need to reexamine revisit the
“solved” problem of atomic vibration effects on the thermophysical properties
of silicon. I found that silicon is more complex than previously explained. I show
that inelastic neutron scattering coupled with ab initio methods are perfect
complements to studying lattice dynamics of materials. I believe advancements
in both experimental and computational methods create better opportunities
References
1B. Fultz,Phase transitions in materials (Cambridge Univ. Press, Cambridge,
Jan. 2014).
2G. Grimvall, The electron-phonon interaction in metals, Selected topics in
solid state physics 16 (North-Holland Pub. Co. : sole distributors for the U.S.A. and Canada, Elsevier North-Holland, Amsterdam ; New York, 1981).
3G. L. Squires, Introduction to the Theory of Thermal Neutron Scattering
(Cambridge Univ. Press, Cambridge, Mar. 2012).
4J. M. Ziman,Elements of Advanced Quantum Theory (Cambridge University
Press, 1969).
5M. T. Dove,Introduction to Lattice Dynamics (Cambridge University Press,
Oct. 1993).
6D. Chandler,Introduction to modern statistical mechanics (Oxford University
Press, 1987).
7H. B. Callen, Thermodynamics and an introduction to thermostatistics
Inelastic neutron scattering was performed on silicon powder to measure
the phonon density of states (DOS) from 100 to 1500 K. The mean fractional
energy shifts with temperature of the modes wereh∆εi/εi∆Ti=−0.07 giving a mean isobaric Gr¨uneisen parameter of +6.95±0.67, significantly different from
the isothermal parameter of +0.98. These large effects are beyond the
pre-dictions from quasiharmonic models using density functional theory (DFT) or
experimental data, demonstrating large effects from phonon anharmonicity. At
1500 K the anharmonicity contributes 0.15kB/atom to the vibrational entropy,
compared to the 0.03kB/atom from quasiharmonicity. Excellent agreement
was found between the entropy from phonon DOS measurements and the
U
nderstanding finite-temperature thermodynamics requires the, at timeselusive, entropy. Phonons are responsible for most of the entropy of ma-terials at modest temperatures. The phonon entropy, or vibrational entropy,can be estimated with a set of fixed phonon frequencies in the harmonic
ap-proximation, but these results are usually too inaccurate for thermodynamic
predictions of phase stability at elevated temperatures [1]. Changes in phonon
frequencies with temperature are generally important for calculating
thermo-dynamic functions [2], but our understanding of high temperature behavior is
still emerging. Such studies require phonon spectra at high T, for which there
are few experimental data.
The thermal properties of silicon are of importance for silicon-based
elec-tronics, nano-mechanics, photovoltatics, thermoelectrics, and batteries [3–11].
Some of the nonharmonic behavior of a material is expected to originate from
“quasiharmonic” thermal softening (reduction in frequency) of phonons, where
the phonon entropy increases as the material expands against its bulk
modu-lus. Anharmonicity from phonon-phonon interactions causes further phonon
softening without thermal expansion and can account for a substantial part of
the entropy of materials at high temperatures. Anharmonic phonon-phonon
interactions also shorten the lifetimes of phonons, causing broadenings in the
phonon spectrum and a finite phonon mean free path for thermal transport.
The lattice dynamics of silicon has attracted ongoing attention owing
to its anomalous thermal expansion, which changes from negative to positive
at low temperatures. Phonon dispersions of silicon have been reported, as have
pa-0 1 0 2 0 3 0 4 0 5 0 6 0 7 0 8 0
E ne rgy [ m e V ]
0 0 . 0 5 0 . 1 0 0 . 1 5 0 . 2 0 0 . 2 5 0 . 3 0
[image:21.612.167.442.74.659.2]1 0 0 K 2 0 0 K 3 0 0 K 3 0 1 K 6 0 0 K 9 0 0 K 1 0 0 0 K 1 1 0 0 K 1 2 0 0 K 1 3 0 0 K 1 4 0 0 K
rameters [12–17]. The work with density functional theory (DFT) on silicon
includes one of its earliest successes for determining the crystal structure of a
solid at elevated temperatures [18]. Experimental work has employed inelastic
neutron scattering (INS) and Raman spectroscopy up to 300 K and to high
pressures [12–14, 19–23]. These studies assessed and correctly described the
low temperature lattice dynamics, but to our knowledge there has not been a
study of phonons above 700 K in silicon by inelastic neutron scattering.
Mea-surements at higher temperatures are important for assessing phonon
anhar-monicity, which is also pertinent to thermal conductivity at all temperatures.
Inelastic neutron scattering (INS) spectra were obtained with ARCS [24]
a time-of-flight Fermi chopper spectrometer at the Spallation Neutron Source
at Oak Ridge National Laboratory, using an incident energy of 97.5 meV and an
oscillating radial collimator to reduce background and multiple scattering [25].
Silicon of 99.9999% purity was pulverized, and 7.9 g of powder with an
ef-fective sample thickness of 6.0 mm was contained in an aluminum sachet and
mounted in a closed-cycle helium refrigerator for measurements at
tempera-tures 100, 200, and 300 K. Similar sachets made of niobium foil were mounted
in a low-background electrical resistance vacuum furnace for measurements
at temperatures 301, 600, 900, 1000, 1100, 1200, 1300, 1400, and 1500 K.
Backgrounds were measured on empty sachets in the same sample environment
at corresponding temperatures. Time-of-flight neutron data were reduced with
the standard software packages in the procedures for the ARCS instrument
as described previously [26–28]. Data reduction included subtraction of the
ing. Because silicon is a coherent scatterer, averages over a wide range of
momentum transfer (2-12 ˚A−1) were used to obtain the phonon DOS curves presented in Fig.2.1. Successful background subtraction is indicated by the
close similarity of the room temperature measurements in both the
closed-cycle refrigerator and the electrical resistance furnace (300 and 301 K).
Ab-initio density functional theory (DFT) and density functional
per-turbation theory (DFPT) calculations were performed with the VASP
pack-age [29–33]. The generalized gradient method was used with PBE exchange
correlation functionals [34, 35] for projector augmented wave
pseudopoten-tials [36, 37] and a plane wave basis set. All calculations used a kinetic energy
cutoff of 500 meV, a direct supercell of 216 atoms, and a 2×2×2 k-point
grid. The energy cutoffs, k-point density, and configurations were converged
to within 5 meV/atom. The phonon eigenenergies were computed through
DFPT [33, 38]. The free energy was calculated as
F(T , V) =E0(V)
+
Z
dε g(ε)
ε
2 +kBTln(1−e −ε/kBT
)
.
(2.1)
The quasiharmonic approximation (QHA) calculations were obtained by
minimizing the free energy F(T , V{a0}) of Eq. 2.1 with respect to the volume
of the supercell. Ground state energies,E0(V), were calculated separately and
self-consistently for each volume, and the DOS, g(ε), were calculated with the
specific lattice parameter, a0, that produced the minimized volume.
A sharp cutoff of the phonon spectrum occurs at 67 meV. The phonon
cor-L A T O T O
LO
TA
TA
LO
TA
[image:25.612.109.505.251.469.2]TA L A L A /LO T O /LO
rections for background, multiple scattering, and multiphonon scattering.
Fig-ure2.1shows that the phonon DOS go through a systematic thermal softening
(decrease in phonon energy) and thermal linewidth broadening with increasing
temperature. The DOS curves contain five distinct features caused by Van
Hove singularities which were fitted to gaussians with temperature. An
exam-ple of peak fits are shown in Fig.2.2.
At 300 K, two transverse acoustic modes between 10 and 30 meV give
the peak near 18 meV and the shoulder near 26 meV. The two features between
30 meV and 55 meV are from longitudinal acoustic and optical modes,
respec-tively. Finally, the higher energy feature around 60 meV is from transverse and
longitudinal optical modes. The high-energy optical modes centered around
60 meV show the largest thermal shift of approximately 4 meV between 100
and 1500 K, but the largest fractional changes, ∆εi/εi, are found for the
low-energy transverse acoustic modes from 10 to 30 meV. The negative fractional
shifts of the five features are shown in Fig.2.4. Fractional shifts agree within
±1% of the average fractional shift. This uniform trend might seem indicative
of a simple quasiharmonic behavior, but the magnitude of the shift proves too
large.
The measured DOS agree strongly with the calculations and allow for
the identification of the five distinct features in the DOS corresponding to the
specific branch or branches in the silicon dispersion relations as seen in Fig.2.3.
The phonon dispersion and DOS (Fig. 2.3) were calculated in the QHA at
the 100 K equilibrium volume and scaled in energy to fit the 100 K measured
0 2 0 0 4 0 0 6 0 0 8 0 0 1 0 0 0 1 2 0 0 1 4 0 0
Te m pe ra ture [ K ]
− 1 0 1 2 3 4 5 6 7
TA
TA
L A
LA/LO
T O /LO
< >
[image:27.612.114.505.187.502.2]methods and results [12,39]. The self-similarity of the phonon DOS at elevated
temperatures is shown in Fig.2.5. Here the phonon DOS measured at 100 K
was rescaled in energy and normalized to unity. The self-similarity of the
phonon DOS at elevated temperatures is shown in Fig.2.5. Here the phonon
DOS measured at 100 K was rescaled in energy and normalized to unity.
g0(ε) =g100K [1−3αTγ¯T(T −100)]ε
(2.2)
The rescaled phonon DOS,g0(ε), is shown with the experimental DOS curve for 1500 K. The thermal expansion coefficient,α, and isobaric Gr¨uneisen
parameter are defined later in the text (Eq.2.6). The two curves are in good
co-incidence, although the thermal broadening of the longitudinal peak at 56 meV
is evident.
In the quasiharmonic approximation, the minimization of the free energy
of Eq. 2.1 gives γi, the mode Gr¨uneisen parameter
γi ≡ − V εi
∂εi
∂V (2.3)
defined as the fractional shift of energy of phonon modei per fractional
shift in volume. There have been many studies defining the Gr¨uneisen
parame-ter as mode specific [14,17, 40], but from the uniform thermal behavior of the
phonons in the whole Brillouin zone, we present a mean Gr¨uneisen parameter
in Table. 2.1, defined as
¯
γ =−
V
εi ∆εi
∂V
=−
∂lnε
i ∂lnV
0 1 0 2 0 3 0 4 0 5 0 6 0 7 0 8 0
E ne rgy [ m e V ]
0 . 0 0 0 . 0 1 0 . 0 2 0 . 0 3 0 . 0 4 0 . 0 5 0 . 0 6 0 . 0 7
1 0 0 K
1 5 0 0 K
[image:29.612.109.500.216.520.2]g
1500 KThe isothermal (¯γP) and isobaric (¯γT) Gr¨uneisen parameters are defined as
¯
γP =−
1 3α(T)
∂lnεi ∂V T ∂V
∂T =BT
∂lnεi ∂P T (2.5) ¯
γT =−
1 3α(T)
∂lnεi ∂T P (2.6) ¯
γT =−
1 3α(T)
∂lnεi ∂V T ∂V ∂T +
∂lnεi ∂T V (2.7) ¯
γT = ¯γP − 1 3α(T)
∂lnεi ∂T V (2.8)
The isothermal and isobaric parameters describe the phonon energy
shifts from effects of temperature and volume, whereα(T) is the coefficient of
linear thermal expansion andBT is the bulk modulus. The experimental phonon
shifts shown in Fig.2.4 were used to obtain ¯γT with Eq.2.6, whereas all of the
QHA parameters used phonon energy shifts from the differences in DFPT
cal-culated DOS of the change in volume that minimized the free energy (Eq.2.1).
From Eq.2.8, ¯γT contains not only a contribution from the volume-dependent
phonon frequency shifts, the “quasiharmonic” contribution, but also a second
term from a pure temperature dependence, the “anharmonic” contribution.
The calculated isobaric and isothermal parameters were normalized with room
temperature thermal expansion coefficients for consistency. Coefficients of
lin-ear thermal expansion, α(T), were obtained from reported values of thermal
expansion and lattice constants [41, 42]. Our experimental isobaric
parame-ter (¯γP) was calculated using Eq.2.5 with phonon shifts from high pressure
Table 2.1: Calculated and measured Gr¨uneisen parameters using constants at room temperature. See text for details on values and method of calculation.
Experimental Calculated in the QHA ¯
γ - 1.00 ± 0.60
¯
γT 7.00 ±0.67 1.102 ± 0.72 ¯
γP 0.98
-γ 0.367
The thermodynamic Gr¨uneisen parameter γ is defined as
γ = 3αV0BT CV
(2.9)
and is listed in Table 2.1. It was evaluated with BT = 0.9784×10¹¹Pa [43], α = 2.59×10⁻⁶K−1[43], and the classical result of heat capacity [1], C
V =
25 J/(mol K). Table 2.1 shows a large discrepancy between the ¯γT from the
phonon measurements and the Gr¨uneisen parameters from volume expansion.
In the present work we measured phonon DOS curves on high purity
silicon powder using a direct geometry inelastic neutron spectrometer and
in-vestigated the phonon DOS with DFT. We found that the thermal changes in
phonon frequencies were a factor of seven larger than expected from the
quasi-harmonic model, indicating a large effect from phonon anquasi-harmonicity. The
thermal broadening of features in the phonon spectrum also indicates
anhar-monicity.
To first order, the phonon DOS is the only function needed to obtain
the vibrational entropy [1, 44]
Svi b(T) = 3kB
Z
dε g(ε)(n+ 1) ln(n+ 1)−nln(n) (2.10)
The entropy Svi b(T) obtained from each measured DOS at temperature T,
g(ε)(T), is shown by orange circles in Fig. 2.6. To obtain a continuous curve,
we also calculated the entropy with rescaled DOS curves from Eq.2.2, using the
experimental ¯γT = 7.0 from Table2.1. Anab initio calculation of a DOS at 0 K
is used with Eq.3.8to obtain a harmonic entropy for all temperatures. For the
experimental phonon DOS measurements is in excellent agreement with the
total entropy from the JANAF tables (Fig.2.6). The agreement to within
ap-proximately 1% is striking, especially considering that the JANAF tables were
assessed from calorimetric measurements, and our Svi b(T) was obtained by
counting phonons. The JANAF entropy is slightly higher than the phonon
entropy at high temperatures suggesting an additional contribution, but the
reliability of this difference is not yet understood. The contribution from
elec-tron excitations is probably negligible, and we also expect the phonon spectrum
will be little affected by adiabatic electron-phonon coupling [1, 44, 46–48].
A harmonic model accounts for most of the entropy of silicon at
mod-est temperatures, but the error at high temperatures is thermodynamically
significant. The first correction from the quasiharmonic approximation is small
because the bulk modulus is modest, and the thermal expansion is small for
strongly covalently bonded atoms [14]. Both the measured and calculated
mode-specific Gr¨uneisen parameters have variations but are approximately 1 at
elevated temperatures [17, 49]. Prior calculations of temperature-dependent
Gr¨uneisen parameters in the quasiharmonic approximation also do not exceed
1 [14]. Much of the previous interest in the lattice dynamics of silicon was
tem-6.50
6.75
1300
1400
1500
0
4 0 0
8 0 0
1 2 0 0
Te m pe ra ture [ K ]
0
1
2
3
4
5
6
7
7.00
NIST JANAF
Harmonic [Ab initio]
Anharmonic
[image:34.612.109.506.178.499.2]Experimental
Quasiharmonic [Ab initio]
source of the low temperature negative thermal expansion [20, 51, 52], but
the mechanistic details were not fully understood, and are addressed in [cite]
next chapter. Nevertheless, it is possible that the open-ness of the diamond
cubic structure may also be responsible for the anharmonicity and low thermal
expansion of silicon when all of the phonon modes are highly populated (above
800 K).
Thermal expansion is not a validation of the quasiharmonic model, as
it predicts phonon shifts that are in error by an order of magnitude when
ac-tual values of thermal expansion are used, as seen by the discrepancy of the
experimental and calculated γT in Table2.1 and by the tiny phonon shifts
predicted by the quasiharmonic model (e.g., [50]). The failure of the
quasihar-monic approximation at high T stems from the assumptions that phonons are
non-interacting. Thermal broadening is evident in the peak from longitudinal
acoustic modes at 39 meV and longitudinal optic modes at 56 meV at high
temperatures. Although lifetime broadening has no effect on the vibrational
entropy to first order, we should expect that other anharmonic corrections to
the phonon self energy from the cubic and quartic parts of the phonon
poten-tials may be important [44]. This is most evident in the differences between ¯γP
temperature dependence of the phonon energy, is much larger than the first
term from the quasiharmonic contribution. This pure anharmonicity dominates
the non-harmonic thermodynamics of silicon at high temperatures, where 80%
of the deviation from the harmonic model is from pure anharmonicity. If the
phonon shifts (Fig.2.4) were only dependent on volume changes and excluded
temperature effects, the mode Gr¨uneisen parameter (¯γ) would have a value of
around 4.4 when using experimental lattice parameters [41, 42]. This is more
than a factor of four larger than the previously measured isothermal
parame-ters (γP) found in Table2.1 showing the need to differentiate the isothermal
and isobaric parameters. The experimental points were obtained with Eq.3.8,
which was derived for non-interacting harmonic or quasi-harmonic phonons.
With phonon lifetime broadening, there is a net shift of spectral weight to
higher frequencies, lowering the apparent vibrational entropy. A small
correc-tion for this effect was suggested recently [2], and using this correction for
the thermal broadening of the present data would give an upward shift of the
experimental points in Fig.2.6 by 0.015kB/atom at 1500 K, but less at lower
temperatures.
At high temperatures (Fig2.7) the problem is even less well understood
because phonon spectra have only become available with the work reported
in the present manuscript. What we show is that the quasiharmonic model is
unreliable at high temperatures. Even though the quasiharmonic model gives
thermal expansion results that are reasonable, the phonon energy shifts with
temperature from anharmonicity are a factor of 7 larger than the thermal shifts
namics and thermal transport, which require anharmonic phonons. Although
we report an experimental result that is not yet provable by theory, it is an
important effect in an important material.
The phonon DOS of silicon shows a curious self-similarity. With
increas-ing temperature the phonon DOS keeps approximately the same shape but is
rescaled in energy. The simplest explanation is that all interatomic force
con-stants decrease proportionately with temperature, but this explanation may be
specious. At 1500 K the different features of the phonon DOS are broadened
differently, reflecting differences in the imaginary part of the phonon self energy
from cubic terms in the phonon potential [44]. Such differences were reported
recently by Hellman, et al. [40], who showed large broadenings of the
longitudi-nal and highest optical modes compared to the lower energy transverse acoustic
modes. (Perhaps the lack of inversion symmetry at silicon atom sites allows for
a relatively large cubic contribution to the potential energy of some phonons.)
The different cubic anharmonicities also contribute different real shifts to the
phonon self energies, so a thermal re-scaling of force constants would require
compensating contributions from the quartic and quasiharmonic contributions
of different phonons. It, therefore, seems unlikely that this self-similarity of the
phonon DOS could be precisely accurate, and the different slopes in Fig.2.4
suggest that it is only approximate.
Measurements of the phonon DOS of silicon from 100 to 1500 K showed
significant thermal softening and some thermal broadening. From prior
experi-mental studies of the effect of pressure on the phonons, and from the present
quasi-found to be within 1% of the total thermodynamic entropy reported by JANAF
References
1B. Fultz, “Vibrational thermodynamics of materials”, Progress in Materials Science 55, 247–352 (2010).
2M. Palumbo, B. Burton, A. Costa e Silva, B. Fultz, B. Grabowski, G.
Grim-vall, B. Hallstedt, O. Hellman, B. Lindahl, A. Schneider, P. E. A. Turchi, and W. Xiong, “Thermodynamic modelling of crystalline unary phases: thermo-dynamic modelling of crystalline phases”, en, physica status solidi (b) 251, 14–32 (2014) 10.1002/pssb.201350133.
3M. A. Green, J. Zhao, A. Wang, P. J. Reece, and M. Gal, “Efficient silicon
light-emitting diodes”, Nature 412, 805–808 (2001) 10.1038/35090539.
4A. I. Hochbaum, R. Chen, R. D. Delgado, W. Liang, E. C. Garnett, M.
Na-jarian, A. Majumdar, and P. Yang, “Enhanced thermoelectric performance of rough silicon nanowires”,Nature451, 163–167 (2008)10.1038/nature06381.
5Y. Cui, Z. Zhong, D. Wang, W. U. Wang, and C. M. Lieber, “High
perfor-mance silicon nanowire field effect transistors”, en,Nano Letters 3, 149–152 (2003) 10.1021/nl025875l.
6J. Graetz, C. C. Ahn, R. Yazami, and B. Fultz, “Highly reversible lithium
stor-age in nanostructured silicon”, en, Electrochemical and Solid-State Letters
6, A194 (2003) 10.1149/1.1596917.
7A. I. Boukai, Y. Bunimovich, J. Tahir-Kheli, J.-K. Yu, W. A. Goddard III, and
J. R. Heath, “Silicon nanowires as efficient thermoelectric materials”,Nature
451, 168–171 (2008) 10.1038/nature06458.
8K. D. Hirschman, L. Tsybeskov, S. P. Duttagupta, and P. M. Fauchet,
“Silicon-based visible light-emitting devices integrated into microelectronic circuits”, Nature 384, 338–341 (1996) 10.1038/384338a0.
9H. A. Atwater and A. Polman, “Plasmonics for improved photovoltaic
de-vices”, Nature Materials 9, 205–213 (2010) 10.1038/nmat2629.
10B. Tian, X. Zheng, T. J. Kempa, Y. Fang, N. Yu, G. Yu, J. Huang, and
C. M. Lieber, “Coaxial silicon nanowires as solar cells and nanoelectronic power sources”, Nature 449, 885–889 (2007) 10.1038/nature06181.
11K. E. Petersen, “Silicon as a mechanical material”, Proceedings of the IEEE
70, 420–457 (1982).
12G. Nilsson and G. Nelin, “Study of the homology between silicon and
silicon”, Phys. Rev. B 60, 284 (1999).
16G. Lang, K. Karch, M. Schmitt, P. Pavone, A. P. Mayer, R. K. Wehner,
and D. Strauch, “Anharmonic line shift and linewidth of the raman mode in covalent semiconductors”, Phys. Rev. B 59, 6182 (1999).
17W. B. Gauster, “Low-temperature gr¨uneisen parameters for silicon and
alu-minum”, Phys. Rev. B 4, 1288 (1971).
18M. T. Yin and M. L. Cohen, “Theory of static structural properties, crystal
stability, and phase transformations: application to si and ge”, Phys. Rev. B
26, 5668 (1982).
19J. Kulda, D. Strauch, P. Pavone, and Y. Ishii, “Inelastic-neutron-scattering
study of phonon eigenvectors and frequencies in si”, Phys. Rev. B50, 13347 (1994).
20S. Biernacki and M. Scheffler, “Negative thermal expansion of diamond and
zinc-blende semiconductors”, Phys. Rev. Lett. 63, 290–293 (1989).
21P. Mishra and K. P. Jain, “Temperature-dependent raman scattering studies
in nanocrystalline silicon and finite-size effects”, Phys. Rev. B 62, 14790 (2000).
22J. Men´endez and M. Cardona, “Temperature dependence of the first-order
raman scattering by phonons in si, ge, and α-sn: anharmonic effects”,Phys. Rev. B 29, 2051 (1984).
23B. A. Weinstein and G. J. Piermarini, “Raman scattering and phonon
disper-sion in si and GaP at very high pressure”, Phys. Rev. B 12, 1172 (1975).
24D. L. Abernathy, M. B. Stone, M. J. Loguillo, M. S. Lucas, O. Delaire, X.
25M. B. Stone, J. L. Niedziela, M. J. Loguillo, M. A. Overbay, and D. L.
Abernathy, “A radial collimator for a time-of-flight neutron spectrometer”, Review of Scientific Instruments 85, 085101 (2014).
26Mantid: http://www.mantidproject.org/, 2013.
27M. Kresch, M. Lucas, O. Delaire, J. Y. Y. Lin, and B. Fultz, “Phonons
in aluminum at high temperatures studied by inelastic neutron scattering”, Phys. Rev. B 77, 024301 (2008)10.1103/PhysRevB.77.024301.
28M. Kresch, O. Delaire, R. Stevens, J. Y. Y. Lin, and B. Fultz, “Neutron
scattering measurements of phonons in nickel at elevated temperatures”, Phys. Rev. B 75, 104301 (2007)10.1103/PhysRevB.75.104301.
29G. Kresse and J. Furthm¨uller, “Efficiency of ab-initio total energy calculations
for metals and semiconductors using a plane-wave basis set”, en, Computa-tional Materials Science 6, 15–50 (1996).
30G. Kresse and J. Hafner, “Ab initio molecular dynamics for liquid metals”,
Phys. Rev. B 47, 558–561 (1993).
31G. Kresse and J. Hafner, “Ab initio molecular-dynamics simulation of the
liquid-metal–amorphous-semiconductor transition in germanium”, en, Phys. Rev. B 49, 14251–14269 (1994) 10.1103/PhysRevB.49.14251.
32G. Kresse and J. Furthm¨uller, “Efficient iterative schemes for ab initio
total-energy calculations using a plane-wave basis set”, Phys. Rev. B 54, 11169 (1996).
33X. Gonze and C. Lee, “Dynamical matrices, born effective charges, dielectric
permittivity tensors, and interatomic force constants from density-functional perturbation theory”, Phys. Rev. B 55, 10355 (1997).
34J. P. Perdew, K. Burke, and M. Ernzerhof, “Generalized gradient
approxima-tion made simple”, Phys. Rev. Lett. 77, 3865 (1996).
35J. P. Perdew, K. Burke, and M. Ernzerhof, “Generalized gradient
approxima-tion made simple [phys. rev. lett. 77, 3865 (1996)]”, en, Phys. Rev. Lett.
78, 1396–1396 (1997) 10.1103/PhysRevLett.78.1396.
36G. Kresse and D. Joubert, “From ultrasoft pseudopotentials to the projector
augmented-wave method”, Phys. Rev. B59, 1758 (1999).
order interatomic force constants from first principles”, Phys. Rev. B 88, 144301 (2013) 10.1103/PhysRevB.88.144301.
41Y. Okada and Y. Tokumaru, “Precise determination of lattice parameter and
thermal expansion coefficient of silicon between 300 and 1500 k”, en,Journal of Applied Physics 56, 314 (1984) 10.1063/1.333965.
42D. N. Batchelder and R. O. Simmons, “Lattice constants and thermal
ex-pansivities of silicon and of calcium fluoride between 6◦ and 322◦ k”, The Journal of Chemical Physics 41, 2324 (1964) 10.1063/1.1726266.
43Hull, Robert, Properties of crystalline silicon (INSPEC, the Institution of
Electrical Engineers, London, 1999).
44D. C. Wallace, Thermodynamics of crystals (Dover Publications, Mineola,
N.Y, 1998).
45M. W. J. Chase, NIST-JANAF Thermochemical Tables, 4th Edition
(Amer-ican Institute of Physics, New York, 1998).
46G. Grimvall, The electron-phonon interaction in metals, Selected topics in
solid state physics 16 (North-Holland Pub. Co. : sole distributors for the U.S.A. and Canada, Elsevier North-Holland, Amsterdam ; New York, 1981).
47O. Delaire, K. Marty, M. B. Stone, P. R. Kent, M. S. Lucas, D. L. Abernathy,
D. Mandrus, and B. C. Sales, “Phonon softening and metallization of a narrow-gap semiconductor by thermal disorder”, Proceedings of the National Academy of Sciences 108, 4725–4730 (2011).
48G. Grimvall,Thermophysical properties of materials, Enl. and Rev. (Elsevier,
Amsterdam, Netherlands ; New York, 1999), 424 pp.
49A. Beattie and J. Schirber, “Experimental determination of the low-temperature
50Z.-K. Liu, Y. Wang, and S. Shang, “Thermal Expansion Anomaly Regulated
by Entropy”, Scientific Reports 4, 7043 (2014).
51J. S. Shah and M. E. Straumanis, “Thermal expansion behavior of silicon at
low temperatures”, Solid State Communications 10, 159–162 (1972).
52D. F. Gibbons, “Thermal Expansion of Some Crystals with the Diamond
anomalous thermal expansion of silicon” [2]:
Despite the widespread use of silicon in modern technology, its
pecu-liar thermal expansion is not well-understood. Adapting harmonic phonons to
the specific volume at temperature, the quasiharmonic approximation, has
be-come accepted for simulating the thermal expansion, but has given ambiguous
interpretations for microscopic mechanisms. To test atomistic mechanisms,
we performed inelastic neutron scattering experiments from 100–1500 K on a
single-crystal of silicon to measure the changes in phonon frequencies. Our
state-of-the-art ab initio calculations, which fully account for phonon
anhar-monicity and nuclear quantum effects, reproduced the measured shifts of
in-dividual phonons with temperature, whereas quasiharmonic shifts were mostly
of the wrong sign. Surprisingly, the accepted quasiharmonic model was found
to predict the thermal expansion owing to a fortuitous cancellation of
A
quantized harmonic oscillator was Einstein’s seminal idea for understand-ing atom vibrations in solids. Better accuracy for crystalline solids is achieved when the vibrations are resolved into normal modes. Each normalmode is quantized, with a zero-point energy and excitations called phonons.
However, harmonic models are limited to quadratic terms in the interatomic
potential, and it is well-known that higher order terms are necessary to
de-scribe properties of real solids such as thermal conductivity and thermal
ex-pansivity. Despite this knowledge, the necessary and sufficient contributions
to non-harmonic effects remain less clear. A popular approach is the
quasi-harmonic model (QH), which assumes quasi-harmonic oscillators, but with
frequen-cies renormalized to account for the thermal expansion. In a quasiharmonic
model, the energy of the phonon mode i changes with crystal volume, V.
Changes to phonon energies are usually described by a mode Gr¨uneisen
pa-rameter, γi = −(V ∂εi)/(εi∂V), where εi = ~ωi is the phonon energy (and ωi/2π is the frequency). A positive γ gives a reduction in mode energy with
thermal expansion, increasing the vibrational entropy ∆Svi b. At finite
temper-ature, the extra elastic energy from thermal expansion, ∆Eel, is offset by the
term −T∆Svi b in the free energy ∆F = ∆Eel −T∆Svi b [1, 2]. For positive γ,
∆F is minimized with a positive thermal expansion; for negative γ, a negative
thermal expansion is expected.
The cubic and quartic terms of the interatomic potential cause the
nor-mal modes to interact and exchange energy. This is pure anharmonicity, where
the the energy of a phonon is altered by the presence of other phonons
monicity and anharmonicity are linear in temperature [3], so if anharmonicity
is important at high temperatures, it can have the same relative importance
at low temperatures, too. Furthermore, at low temperatures the “zero-point”
energy gives atom displacements that allow a nuclear quantum effect to engage
the high-energy phonon modes that are half occupied.
Finding the relative importances of quasiharmonicity and anharmonicity
should be done by quantitative analysis, but to date the dominance of
quasi-harmonicity for silicon has been assumed in part because quasiharmonic models
predict the thermal expansion with reasonable accuracy [4–6]. The
quasihar-monic model predicts the anomalous negative thermal expansion of silicon from
10 K to 125 K and the low thermal expansion up to the melting temperature
[7–11]. The positive thermal expansion coefficients observed at moderate and
high temperatures are anomalous in their own right – they are small
com-pared to diamond and other materials with zincblende structures [9]. Further
validation of the quasiharmonic approximation was provided by measurements
of the Raman mode and a few second-order Raman modes of silicon under
pressure, which were accurately predicted by volume-dependent density
func-tional theory (DFT) calculations at low temperature [12, 13]. The negative
received considerable attention and have been attributed to the “open-ness”
of the diamond cubic structure [11], the stability of angular forces [6], or
en-tropy in general [5]. Nevertheless, the precise role of the TA modes in thermal
expansion remains unclear [4, 6]. With increasing temperature, phonons are
excited in higher-energy phonon branches, and their positive Gr¨uneisen
param-eters are expected to cause the overall thermal expansion to change sign (as
discussed in the (Supporting Information). Today this quasiharmonic model is
the workhorse for predicting thermal expansion.
“Non-trivial” phonon shifts that were not accounted for by thermal
ex-pansion were reported in an earlier experimental paper on phonon dispersions in
silicon up to 300 K [14]. The importance of pure anharmonicity in
temperature-dependent phonon shifts at moderate and high temperatures was also found
in work based on molecular dynamics, many-body perturbation theory, and ab
initio calculations on silicon [15–21]. The uncertainty principle and quantum
distributions of nuclear positions influence the exploration of atomic potential
landscapes. The zero-point motion was shown to be important, but does not
by itself reproduce the correct thermal expansion coefficients [22, 23]. (More
information on quantum and zero-point effects are in the Supporting
Informa-tion.) Temperature-dependent phonon shifts from pure phonon anharmonicity
with zero-point energy could give a nuclear quantum effect that alters
ther-mophysical properties. A more detailed study of the temperature dependence
of phonons in silicon is therefore appropriate because very few modes were
previously assessed [14, 19, 20, 24].
The experiments used a high-purity single crystal of silicon (mass ≈ 28.5 g) with h110i-orientation, machined into a tube for optimal neutron
scat-tering properties. The sample was rotated in a furnace on a direct geometry
time-of-flight inelastic neutron scattering spectrometer (ARCS) [25] at the
Spallation Neutron Source at Oak Ridge National Laboratory. For each
tem-perature the 4-dimensional S(q,ε) data were reduced and multiphonon
scat-tering subtracted to give all phonon dispersions in the irreducible wedge of the
first Brillouin zone. The multiphonon scattering produces a relatively smooth
background between the phonon dispersions and was determined to produce
the majority of the background intensity (Supporting Information) [26]. Our
“folding” technique of summing all of the S(q,ε) data (from >100 Brillouin
zones) into an irreducible wedge increases the signal strength, suppresses
polar-ization effects that alter intensities in some Brillouin zones [26], and averages
out any possible effects of “anharmonic interference” [27].
Figure3.1 shows phonon dispersions as bright intensities. The
disper-sions at low temperatures are in excellent agreement with previous work that
used triple-axis spectrometers [14, 24]. With increasing temperature, the
ma-jority of phonon modes, including the low-energy transverse acoustic modes,
similar. This self-similar behavior of phonon softening was reported previously
[21].
All ab initio calculations were performed with the VASP package [28–
34]. A stochastically-initialized temperature-dependent effective potential method
(s-TDEP) [12, 35–37] was implemented to obtain phonon shifts with
temper-ature, including intrinsic phonon anharmonicities and nuclear quantum effects.
Quasiharmonic calculations were also conducted as described previously [21].
Methods for both the measurements and the calculations are described in the
Supporting Information.
Results from calculations by the s-TDEP method (with anharmonicity
and thermal expansion) and conventional quasiharmonic ab initio calculations
(with no anharmonicity) are shown in Fig.3.2through Fig.3.4. There are large
discrepancies in the signs and magnitudes of phonon energy shifts between
the two models. Most interestingly, Fig.3.2(b),(c) show that the s-TDEP
calculations predict a reduction in phonon energy, a thermal “softening”, in the
transverse modes (roughly <35 meV), whereas the quasiharmonic calculations
predict an increase in phonon energy, “stiffening”, at 1500 K (with negative
Gr¨uneisen parameters as reported previously [4–6]).
We calculated the fractional shifts of energies, ∆ε/ε(T), for all phonon
modes in the first Brillouin zone. The energies of all phonons were calculated
using a 50×50×50 grid of q-points. Figure3.3(a) compares the density of
fractional phonon shifts from quasiharmonic and anharmonic (s-TDEP)
the s-TDEP method at 700 K. Compared to the quasiharmonic predictions for
the TA modes (shown at top of Fig.3.3(a)), the anharmonic shifts are an
order-of-magnitude larger, have opposite signs, and follow opposite thermal
trends. Such large discrepancies allow for definitive experimental tests.
Individual phonon energies were obtained from constant-q fits to the
measured S(q,ε), as shown in the Supporting Information. Fig.3.4(a)–(d)
show that the trends from the anharmonic s-TDEP calculations are in far
better agreement with experiment than the quasiharmonic trends. Thermal
trends for individual phonons at the L,X,K-points (Fig.3.4(a), (b), (d) are
presented for their importance in the interpretation of quasiharmonic results
[4]. Another example for a phonon mode located away from a high-symmetry
line is shown in Fig.3.4(d).
Additional s-TDEP calculations of densities of thermal shifts suggest
why the quasiharmonic theory has been so apparently successful. Calculations
were performed for volumes that were 1% larger and 1% smaller than the 0 K
harmonic volume calculated for Fig.3.2(a), and the results are shown on the
left and right sides of Fig.3.5 for the TA modes (top three panels) and all
phonon modes (middle three panels). For all three volumes, at low
tempera-tures there is a wide spread in the thermal phonon shifts, both stiffening and
softening. At low temperatures, the average thermal shift from
anharmonic-ity at a fixed volume is surprisingly nearly zero. At fixed volume, the shifts
of all quasiharmonic phonons are zero, of course, so the two methods agree
on the average owing to the cancellation of anharmonic stiffenings and
entropies from the s-TDEP and quasiharmonic methods were calculated
us-ing equations in the Supporting Information. The difference in entropies ∆S
from the quasiharmonic and anharmonic calculations was used to obtain the
−T∆S shown in Fig.3.5(g)–(i). For all volumes, the differences are negligible
up to 125 K but increase at higher temperatures (Fig.3.6). The success of the
quasiharmonic theory may be an indicator that the diamond cubic structure is
intrinsically prone to anomalies in thermal expansion, but the quasiharmonic
model is not physically correct.
An independent concern about the quasiharmonic model is the elastic
energy of thermal expansion, ∆Eel = 1/2Bv(βT)2, where B is the bulk
mod-ulus, β is the volume coefficient of thermal expansion, and v is the atomic
volume. This ∆Eel should be comparable to the −T∆Svib contribution to the free energy from finite temperature phonons including pure
anharmonic-ity and nuclear quantum effects. The maximum negative linear expansion at
atmospheric pressure is 0.003 %, and the maximum positive linear expansion
is 0.5 ˙% near the melting temperature [7, 8, 10]. The corresponding elastic
energy per atom for the negative thermal expansion is in the µeV range, and
the positive thermal expansion gives approximately 0.2 meV at 500 K [7, 8,
the correct entropic contributions to the free energy. A quasiharmonic model
with negative Gr¨uneisen parameters gives a physically incorrect explanation of
thermal expansion, although some of its predictions of average properties are
preserved by gross cancellations of errors.
The zero-point energy proves important for thermal expansion in silicon
[22, 23], where the (fractional) population of the higher energy phonons alters
the self-energies of the TA phonons that change their population at low
tem-peratures. Without this nuclear quantum effect, our anharmonic calculations
predict significantly different thermal expansion at low temperatures (
Support-ing Information). Classical mechanical models based on the “open-ness” of the
structure, classical springs, force constant ratios, and negative Gr¨uneisen
pa-rameters may contribute to the general behavior as discussed in theSupporting
Information, but a classical picture of thermal expansion is not reliable. Nuclear
quantum effects give an anharmonic coupling between phonons of all energies,
even modes of higher energy that are not excited at low temperature, and these
couplings are essential for correct predictions of thermal expansion. Nuclear
quantum effects with pure anharmonicity should also alter thermal conductivity
and other thermophysical properties at low temperatures.
Measurements of the phonon dispersions of single crystal silicon from
100 to 1500 K showed thermal shifts that contradict the trends predicted by
the widely accepted quasiharmonic model, even at low temperatures. Pure
phonon anharmonicity, i.e., phonon-phonon interactions, dominate the phonons
in silicon from low to high temperatures, altering the effective interatomic
Figure 3.6: Calculated and experimental coefficients of linear thermal expan-sion in silicon. Calculated coefficients are from minimized free energies using
low temperatures the zero-point quantum occupancy of high-energy vibrational
modes alter the energies of low-energy modes through anharmonic coupling.
This nuclear quantum effect with anharmonicity is the essential cause of the
negative thermal expansion of silicon. The crystal structure, anharmonicity,
and nuclear quantum effects of silicon all play important roles in the thermal
expansion of silicon, and could be essential in other technologically important
materials.
Supporting Information (SI)
Inelastic Neutron Scattering
Inelastic neutron scattering measurements were performed on a single
crystal of silicon of 99.999% purity that was highly-oriented (<2◦), purchased from Virginia Semiconductor, Inc. The [110] oriented single crystal was further
machined into a cylinder of 3.8 cm in height, 2.54 cm in outer diameter and
a 1.59 cm inner diameter to minimize multiple scattering. The crystal was
suspended in an aluminum holder and then mounted into a closed-cycle helium
refrigerator for the 100 and 200 K measurements, and a similar holder made
from niobium was mounted into a low-background electrical resistance vacuum
furnace for measurements at 300, 900, 1200 and 1500 K. For all measurements
the incident energy was 97.5 meV, and an oscillating radial collimator was used
to reduce background and multiple scattering [25, 39].
The time-of-flight neutron data included multiple datasets from 200
4-dimensional S(q,ε) [40, 41]. A secondary data reduction process consisted
of ‘folding’ the entireS(q,ε) data set into an irreducible wedge in the first
Bril-louin zone. Non-linear offsets of the q-grid were corrected by fitting typically
50 in situ Bragg diffractions in an energy transfer range of ∆ε= ± 4 meV by a transformation to the positions of the theoretical diffraction peaks for a
di-amond cubic structure. The multiphonon scattering was then subtracted, and
the data ‘folded back’ and corrected for the phonon creation thermal factor
[26].
The multiphonon scattering was determined withq-dependence through
the incoherent approximation and calculated from Eq. 3.1[26],
Sn>1(~q, ε) = 10
X
n=2
e−2W(2W) n
n! A1~An−1, (3.1)
where the 2W is the well-known Debye-Waller factor calculated from
the experimental temperature-dependent phonon density of states (DOS) [21,
26]. The single andn-phonon scattering spectrum are,
A1= g(ε)
ε hn+ 1i, (3.2)
An=A1~An−1. (3.3)
The g(ε) is the experimental phonon DOS [21], and n is the Planck
distribution. We find that even at temperatures > 1000 K the contributions
(b∗Sn>1) was applied to the total multiphonon scattering function throughout
the Brillouin zone after “folding” to correct for normalization. The multiphonon
scattering accounted for most of the background intensity as seen clearly in
Fig3.7.
The correct alignment of the data in reciprocal space and multiphonon
subtraction produced S(q,ε) of high statistical quality. Thermal shifts of
phonons reported previously, when available, were in good agreement [14, 15,
20].
Energy spectra at specific q-points mentioned were evaluated by
in-tegrating over 0.0025 ˚A−3. Phonon centroids were then fitted using the Levenberg-Marquardt non-linear least square method for multiple skewed-Voigt
functions. The skewed-Voigt functions gave the best fits to the known
asym-metric lineshape of the ARCS time-of-flight spectometer. Examples of the
scattered intensities at a constant-q, with fits, are shown for the X-point in
Fig.3.8.
For comparison, a “slice” of “unfolded” 4-D S(q,ε) along a
momen-tum direction is shown in Fig.3.9. The data were processed using standard
software and corrected for the phonon creation thermal factor [26, 42]. First
principles calculations were performed using the s-TDEP method described
be-low and elsewhere [12, 43]. The experimental results are in good agreement
with first principles calculations throughout reciprocal space. There are
bene-fits of assessing phonon intensities over multiple Brillouin zones, but these are
Ab-initio Calculations
Ab initio DFT calculations were performed with the projector augmented
wave [44] formalism as implemented in VASP [28–30, 45]. All calculations
used a 5×5×5 supercell and a 500 eV plane wave energy cutoff. The Brillouin
zone integrations used a 3×3×3 k-point grid, and the exchange-correlation
energy was calculated with the AM05 functional [32–34]. All calculations were
converged to within 1 meV/atom.
Finite temperature phonon dispersions of silicon were calculated by
fit-ting first-principles forces to a model hamiltonian,
H = U0+
X
i
p2 i 2m +
1 2
X
i j αβ
Φαβi j uiαujβ + 1 3!
X
i j k αβγ
Φαβγi j k uiαujβukγ. (3.4)
The forces on atoms were generated using DFT with various configurations
of displaced atoms by a stochastic sampling of a canonical ensemble, with
cartesian displacements (uiα) normally distributed around the mean thermal
displacement using
uiα =X
k
i αk ck √
mi
p
−2 lnξ1sin(2πξ2). (3.5)
The thermal factor,ck, is based on thermal amplitudes of normal mode
k, with eigenvector k and frequency ωk [36, 46, 47]
ck =
s
~(2nk + 1) 2ωk
, (3.6)
andξ1 andξ2are stochastically sampled numbers between 0 and 1. The
tational resources required of ab initio molecular-dynamics (AIMD), replacing
AIMD with a Monte Carlo sampling of atomic positions and momentum near
equilibrium positions [12, 36]. The quasiharmonic model was calculated as
described previously [21].
Thermodynamic Calculations
Temperature dependent coefficients of linear thermal expansion in silicon were
calculated through the minimization of the free energy,
F(T , V) =E(T , V) +X
q,k
~ωk(q, V, T)
2
+kBTln(1−e−~ωk(q,T ,V)/kBT)
,
(3.7)
from quasiharmonic calculations, and from s-TDEP (main text Fig. 5). The
quasiharmonic model implies the only temperature dependence of the entropy is
from the volume expansionεi(V{T}) and the Planck distribution (nk), whereas the anharmonic s-TDEP method minimizes the free energy for temperature and
volume simultaneously. The vibrational entropy from all phonon modes, P
k,
was calculated as [1],
Svi b(T) = 3kB
X
k
(nk + 1) ln(nk + 1)−nkln(nk)
Possible Contributions to the Thermal Expansion
As stated in the main text, a simple physical model for the anomalous
thermal expansion of silicon is unlikely because different effects contribute to
the thermal expansion. In particular, the anharmonicity and nuclear quantum
effects are difficult to formulate as a simple 3D model. The thermal expansion
of Si can be simulated properly with methods based on ab initio calculations
that includes all these factors, but this seems unsatisfying for a “physical”
understanding. A number of possible contributions and models are presented
here, but any single model is insufficient by itself.
Negative Gr¨uneisen Parameters as Fitting Parameters
If individual Gr¨uneisen parameters are assigned to different parts of the phonon
DOS, it is easy to make a model that predicts negative thermal expansion at
low temperatures. An approximation for silicon is shown in Fig.3.10, together
with the experimental phonon DOS reported previously [21]. The six phonon
branches were modeled as follows: acoustic branches were approximated by
Debye models with cutoff energies of 20, 25, 42 meV, and optical branches
were approximated as Einstein modes with energies of 52, 60, 60 meV. These
curves were convoluted with a Gaussian function of standard deviation√3 meV, summed, and are compared to the experimental phonon DOS of Si [21] in
Fig.3.10.
The heat capacities of these six functions were calculated as shown
in Fig.3 (a). For simplicity, a Gr¨uneisen parameter of –1 was assigned to