2020 4th International Conference on Modelling, Simulation and Applied Mathematics (MSAM 2020) ISBN: 978-1-60595-674-9
The Empirical Analysis about Financial Performance of SSE Company
Based on PCA-Bootstrap-DEA Model
Jian-chong YANG
1and Yu-xue WANG
21,2
School of Mathematics and Statistics, Northeast Petroleum University, High-Technology District, Daqing City, Heilongjiang Province, China
*Corresponding Author
Keywords: Financial performance, PCA method, DEA method, Bootstrap-DEA method.
Abstract. This paper analysis accounting indicators of all companies those trade in Shanghai Securities Exchange and explores the PCA method in order to solve the repetitiveness of information between indicators which caused by the excessive number of indicators and simplify the original indicator system structure. Then the outcomes of principal component becomes input-output indicator of the Bootstrap-DEA arithmetic. At last we obtain the “relative efficiency” of the financial performance of companies. We get the conclusion that the PCA-Bootstrap-DEA model. This paper can provide reference for improving the understanding of the financial performance of the SSE company.
Introduction
In recent years, as the country to vigorously support the financial sector, many listed companies have sprung up, competition in the financial sector has become more intense, then if a listed company wants to maintain a good competitive edge, it must have a clear understanding of the company itself. The level of financial performance is an important factor in measuring whether a company can maintain a healthy development. Therefore, this paper focuses on the research on the financial performance of listed companies, provides decision-making basis for decision-makers
of enterprises, and promotes the healthy development of listed companies.
As early as 1922, the famous American economist McKinsey proposed that the evaluation of corporate performance should start from its external environment and compare the management of the enterprise with the development strategy and the level of management in peacetime through the external environment [1]. In the 1990s, Robert Kaplan and David Norton created the “balanced scorecard” approach to corporate performance evaluation [2]. In 2017, Xu Xiaofei and others used the DEA analysis method to evaluate and study the corporate performance of China's New Third Board listed companies. The research results show that the overall operating performance of the listed companies in the New Third Board is considerable, which is worthy of investors' investment and attention [3].
Summary of Related Theories
Principal Component Analysis
Principal Components Analysis (PCA) is a dimensionality reduction method, which is a multivariate statistical method that converts multiple indicators into several comprehensive indicators under the premise of little information loss. we can simplify the original index architecture and make the problem easier to improve the efficiency of analysis [4].
The Basic Principle of DEA
The BCC model assumes that there are n decision units DMU, each DMU has minputs and s
outputs,xijandyijrepresent the i-th input and the r-th output of the j-th DMU, respectively, andjis
for each DMU Index weight, 1 n
ij j j x
and 1n ij j j y
is the weighted DMU input and output,isthe relative efficiency,si
and + i
s
represents the slack variable, represents infinity, and the target is planned as follows:
1 1
1
1
1
min[ ( )]
0, 1, 2,...,
0, 1, 2,...,
1
, , , 0
m m
r r
i i
n
ij j i ij j
n
ij j i rj j
n j j
j i i
s s
x s x i m
y s y r s
s s
DEA Model Correction Based on Bootstrap Algorithm
Traditional DEA model is difficult to avoid the problem of sample sensitivity and extreme value because the observation sample is so limited that the measured efficiency value is limited. Kniep et al. also pointed out that the efficiency value obtained by the DEA model is actually a kind of "relative efficiency", which is a biased and inconsistent estimator relative to the absolute efficiency value [5]. For this reason, Simar and Wilson proposed the Bootstrap-DEA method to solve this drawback. The Bootstrap-DEA method uses the method of repeated self-sampling to infer the empirical distribution of DEA estimates.
Sample Indicator Data Preprocessing
Indicator Selection
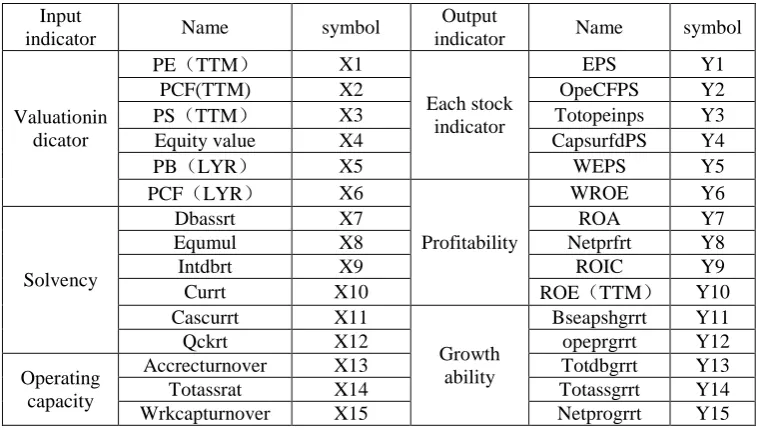
[image:2.595.108.489.564.779.2]This paper mainly selects 1326 listed companies in China's SSE section as research samples. In the choice financial terminal database, the relevant financial indicators are divided into six dimensions: valuation index, solvency, operational capability, per share index, profitability and growth ability. Therefore, based on these six dimensions, this paper selects all aspects. Based on the existing research, the specific indicators are shown in Table 1.
Table 1. Input-output indicator specific classification table.
Input
indicator Name symbol
Output
indicator Name symbol
Valuationin dicator
PE(TTM) X1
Each stock indicator
EPS Y1
PCF(TTM) X2 OpeCFPS Y2
PS(TTM) X3 Totopeinps Y3
Equity value X4 CapsurfdPS Y4
PB(LYR) X5 WEPS Y5
PCF(LYR) X6
Profitability
WROE Y6
Solvency
Dbassrt X7 ROA Y7
Equmul X8 Netprfrt Y8
Intdbrt X9 ROIC Y9
Currt X10 ROE(TTM) Y10
Cascurrt X11
Growth ability
Bseapshgrrt Y11
Qckrt X12 opeprgrrt Y12
Operating capacity
Accrecturnover X13 Totdbgrrt Y13
Totassrat X14 Totassgrrt Y14
PCA Processing of Alternative Indicators
Through the factor analysis of the alternative input and output indicators, the KMO values are 0.667 and 0.693 (greater than 0.5), and the chi-square statistic significance after the Bartlett test is 0.000(less than 0.05).This shows that there are common factors between input and output indicators, which are suitable for PCA.
[image:3.595.84.510.225.323.2]The cumulative variance contribution rate of the 6 principal components FAC1-FAC6 selected in the input index reached 89.8%, and the cumulative variance contribution rate of the 5 principal components FAC1-FAC5 selected in the output index reached 88.22%. The specific results are shown in Table 2.
Table 2. Input and output index FAC eigenvalue and cumulative contribution rate.
Input index FAC1 FAC2 FAC3 FAC4 FAC5 FAC6 Eigenvalues 5.937 3.301 1.104 1.088 1.033 1.007 Contribution rate% 39.58 22.01 7.36 7.25 6.88 6.72 Cumulative contribution rate% 39.58 61.59 68.59 76.2 83.09 89.8
Output index FAC1 FAC2 FAC3 FAC4 FAC5 Eigenvalues 6.897 3.561 1.388 1.279 1.068 Contribution rate% 45.98 23.74 9.25 8.53 7.12 Cumulative contribution rate% 39.58 63.32 72.57 81.10 88.22
Empirical Results and Analysis
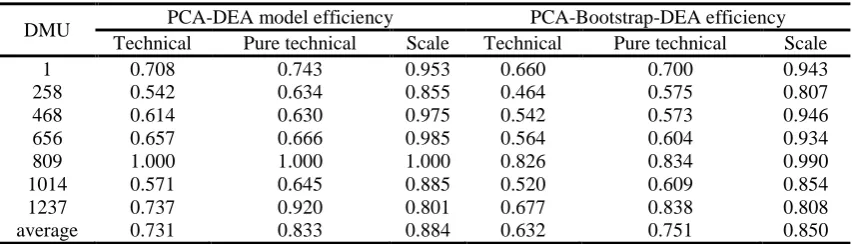
In the results obtained by principal component analysis of the data, the value of some principal components is negative, which does not satisfy the requirement that the input-output variable values are positive in the DEA model. Therefore, the principal components obtained in the above are forward-processed, and the new input-output data is input into the PCA-DEA model and the PCA-Bootstrap-DEA model. Due to the excessive number of selected data listed companies (DMUs), The results are written in Table 3.
Table 3. SSE's 2018 financial indicator evaluation results (partial).
DMU PCA-DEA model efficiency PCA-Bootstrap-DEA efficiency Technical Pure technical Scale Technical Pure technical Scale
1 0.708 0.743 0.953 0.660 0.700 0.943
258 0.542 0.634 0.855 0.464 0.575 0.807
468 0.614 0.630 0.975 0.542 0.573 0.946
656 0.657 0.666 0.985 0.564 0.604 0.934
809 1.000 1.000 1.000 0.826 0.834 0.990
1014 0.571 0.645 0.885 0.520 0.609 0.854
1237 0.737 0.920 0.801 0.677 0.838 0.808
average 0.731 0.833 0.884 0.632 0.751 0.850 The table in the text only part of the data is selected for display
According to Table 3, the average technical efficiency of SSE companies in 2018 is 0.731, and the pure technical efficiency and scale efficiency are 0.833 and 0.884, respectively. The results show that the financial performance level of SSE companies have not yet reached the effective frontier, because of the double inefficiency of pure technical efficiency and scale efficiency.
[image:3.595.85.513.467.589.2]Table 4. 2018 SSE company technical efficiency correction results (partial).
DMU
PCA-DEA PCA- Bootstrap-DEA correction value Technical
efficiency
Technical
efficiency Skewness
Lower boundary
Upper boundary
1 0.708 0.660 0.049 0.604 0.701
258 0.542 0.464 0.079 0.402 0.533
468 0.614 0.542 0.072 0.496 0.600
656 0.657 0.564 0.093 0.495 0.648
809 1.000 0.826 0.174 0.731 0.986
1014 0.571 0.520 0.050 0.475 0.563
1237 0.737 0.677 0.059 0.616 0.726
average 0.731 0.632 0.098 0.561 0.720
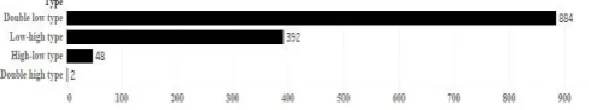
According to the division method of Wilson et al [6], with the efficiency value of 0.9000 (PCA-Bootstrap-DEA) as the critical point, the pure technical efficiency and scale efficiency of 1326 SSE companies are divided according to high and low, and combined into high. There are four types of double high type, double low type, high-low type, and low-high type. The four types of frequency distribution histograms are shown in Figure 1:
Figure 1. Four types of frequency distribution histograms.
It can be seen from Table 3 and Figure 1. The first type is a double high type with pure technical efficiency and scale efficiency of more than 0.9000. There are only two such companies, indicating that most SSE companies are facing urgent need to improve their finances. The second type is a double low type with pure technical efficiency and scale efficiency of less than 0.900. 884 companies are double-low companies. The third type is characterized by a high level of technical efficiency and low scale efficiency, with a total of 48 companies. The fourth type is low-altitude with low efficiency and high scale efficiency with 392 companies.
Conclusion
In this paper, the results show that the technical efficiency of the SSE's financial performance level is low, mainly due to the common inefficiency of pure technical efficiency and scale efficiency. At the same time, the efficiency value after the correction by the Bootstrap method is significantly lower than that of the traditional DEA model, and the pure technical efficiency is significantly lower than the scale efficiency. This shows that if the SSE company wants to improve its financial performance level, it must start with financial management and improve the efficiency of pure technology, instead of simply increasing its investment scale. And according to the figure 1, there are only two double high type companies. This shows that the SSE company has a low level of financial resource management and lacks effective financial resource allocation, which needs further improvement.
References
[1] Wangjing, GaoJianshe, NingXuanxi. Empirical Study on the Construction and Evaluation Method of Enterprise Value Evaluation Index System [J]. Management world, 2009(02):180-181.
[image:4.595.145.440.314.369.2][3] Xu Xiaofei, Li Yunxi. DEA Application and Research of Analytical Method in Enterprise Performance Evaluation of New Third Board Listed Companies [J]. Time finance, 2017(05):173-174+177.
[4] Zhangtian. Analysis of Stock Price Factors Based on Principal Component Analysis [D] Lanzhou University, 2013.
[5] A. Charnes, C. T. Clark, W. W. Cooper, B. Golany. A developmental study of data envelopment analysis in measuring the efficiency of maintenance units in the U.S. airforces [J]. Annals of Operations Research, 1984, 2(1).