2016 International Congress on Computation Algorithms in Engineering (ICCAE 2016) ISBN: 978-1-60595-386-1
1 INTRODUCTION
With continuous increase of oil-gas resources in China, oil-gas enterprises have entered rapid development phase. Usage quantities of corresponding oil-gas well fields and mechanical equipment are in continuous increase. The safety and stable operation of this kind of equipment can directly affect the planning, con-struction, and safety of oil-gas fields. Therefore, me-chanical equipment used in oil-gas fields has occupied an important part in the daily equipment management of oil-gas field enterprises. Due to facility or technical problems occurred in the construction or operation process of oil-gas fields, there can be downtime risks caused by accidental failure during the production run of oil-gas well fields and part mechanical equipment. In most cases, this kind of risks can directly or indi-rectly cause the occurrence of related major accidents in oil-gas field enterprises. Hence, it can make a big difference in conducting assessment and analysis of oil-gas field production system equipment. The goal of safe production in oil-gas field enterprises can be eventually reached by enhancing scientific manage-ment on related equipmanage-ment failure in well fields and stations [1].
Key links in the oil-gas field production system are composed of different types of rotating equipment. Assessment on the reliability of corresponding pro-duction system will depend on accurate calculation of corresponding equipment failure. Therefore, deep analysis and research on the method used to estimate corresponding mechanical equipment are needed. Generally, equipment failure can be divided into early failure, accidental failure and aging failure. At present, most scholars are conducting corresponding research on accidental failure [2] and aging failure [3]. These two kinds of failure are mainly used in analysis of equip-ment failure caused by one kind of reasons or in statis-tical analysis of failure rate without full life cycle of equipment. Equipment failure rate is used to describe a set of the same equipment type. As equipment shares different operating years, operating conditions and usages, different reasons for equipment failure (such as early failure, accidental failure and aging failure) can coexist in most cases. While conducting estima-tion on the failure rate of full life circle, parameter distribution features of various failure frequencies shall be fully considered. While conducting estimation on full life circle failure rate of equipment, longer statistical data period can lead to larger data size. As a
Early Warning Analysis of Oil-Gas Field Equipment
Failure Based on Statistical Model of Failure Rate
Wenbin Yi1, Zhenxiong Ke2 & Shuncheng Wu1 1
China National Petroleum Corporation, Beijing, China 2
School of Machinery, Storage and Transportation Engineering, China University of Petroleum-Beijing, Beijing, China
ABSTRACT: This paper proposed a method used to estimate mechanical equipment failure for oil-gas field enterprises. First, this method established a mixed failure distribution model of mechanical equipment modules. According to the collected statistical data of module defect, this method then applied MLE (Maximum Likeli-hood Estimation) algorithm and EM algorithm to calculate the mixed failure distribution parameters of mechani-cal equipment modules, so as to form the mixed distribution function of failure rate. The feasibility of this meth-od was verified through examples. At last, the concept of risk early warning management for mechanical equip-ment failure was proposed based on the estimated distribution function of mechanical equipequip-ment failure rate. As a result, there are scientific grounds for the equipment maintenance & repair cycle regulated by grass-roots staff and the equipment replacement & scrapping strategy set by management-level users.
result, corresponding statistical failure rate can show higher practicability and accuracy. However, as the informationized management level for failure rate data of mechanical equipment in oil-gas field enterprises is low and it is limited to conduct analysis according to data records and statistics, serious censored data exist in the final results of equipment failure data analysis.
Based on original statistical failure data of equip-ment, this paper proposed a mixed distribution model of equipment failure according to the situation that different equipment failure causes coexisted and, dif-ferent parameter distribution patterns were caused by various occurring frequencies of those failure causes. This model can apply an accurate parameter estima-tion method to analyze the maximum likelihood func-tion pattern corresponding to bilateral timing censored data while using EM algorithm to obtain the mixed failure rate function through parameter estimation in order to solve problems of short statistical cycle, in-complete aging failure data, and censored data. In the end, by analyzing effective equipment failure records of oil-gas field enterprises, this model can make quan-titative simulation on the failure rate function of me-chanical equipment. By conducting risk early warning of equipment failure rate in different time periods, this model can also provide scientific grounds for the equipment maintenance & repair cycle regulated by grass-roots staff and the equipment replacement & scrapping strategy set by management-level users.
2 STATISTICAL ANALYSIS PRINCIPLES OF
OIL AND GAS FIELD MECHANICAL EQUIP-MENT FAILURE RATE
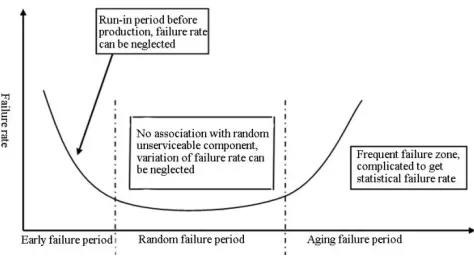
The relationship between failure rate of oil-gas field production equipment and operating years can be sim-ilar to a “bathtub curve”. This curve can be divided into three periods: early failure period, accidental failure period, and aging failure period [4].
(1) Early failure period refers to the initial come- into-use period of equipment. Failure in this period is caused by internal material defect, design defect or manufacturing defect of product. The failure rate gets
lower with the passage of time, showing negative growth.
(2) A type feature of accidental failure period is the failure rate can stay in a low level and maintain in a stable variation period for a long time. Failure in this period is caused by random variation in stress condi-tions. The failure rate shows random distribution.
(3) The failure rate corresponding to aging failure period gets higher quickly with the passage of time. Failure in this period is caused by equipment abrasion and aging. The failure rate shows positive growth.
See Figure 1 for the “bathtub curve” between fail-ure rate of equipment and operating years.
In consideration of the actual usage of mechanical equipment in oil-gas field enterprises, most equipment have completed sufficient abrasion and got through early failure period. Therefore, statistical analysis is mainly conducted for accidental failure rate and aging failure rate of mechanical equipment used in oil-gas field enterprises. As the frequencies of accidental failure and aging failure are different, there are differ-ences between their corresponding parameter distribu-tion patterns. The specific differences are: (1) Statis-tics between accidental failures is independent and the failure rate is approximate to a constant where expo-nential distribution (E(t|λ)) can be applied; (2) aging failure rate gets higher with the passage of time and Weibull distribution (W(t|a,b)) is usually applied for analysis.
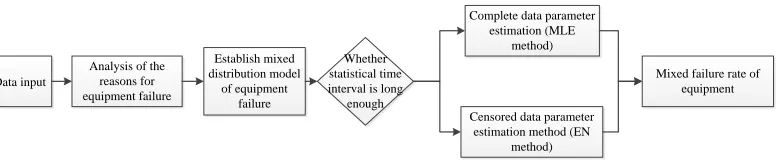
In conclusion, this paper proposed a method to es-timate statistical analysis of failure rate of mechanical equipment in combination with the operating proper-ties of mechanical equipment used in oil-gas field enterprises. See Figure 2 for the specific algorithm process.
Analysis of this algorithm mainly includes five steps. The content of each step is as follows:
1) Step 1: Complete collection and processing of statistical failure data of mechanical equipment used in oil-gas field enterprises to form essential data in-cluding equipment type, installation time, failure oc-currence time, failure cause, repair record, and re-placement record.
[image:2.516.140.377.55.183.2]2) Step 2: Make analysis of failure causes based on
input basic data and conduct preliminary classification of accidental failure and aging failure of mechanical equipment. Calculate the proportion p that aging fail-ure occupies.
3) Step 3: Initialize the mixed distribution model of accidental failure and aging failure, and infer the mixed failure rate function of mechanical equipment according to the proportional relationship between accidental failure and aging failure. See Section 3 for the specific process of function derivation.
4) Step 4: Make comprehensive judgement on sta-tistical period of mechanical equipment failure, so as to obtain solution of failure rate function solution. When statistical period of failure is long and statistical failure data is complete, traditional MLE method can be directly applied to estimate unknown parameters of mixed distribution model. When statistical period of failure is short and there’s serious censored data, EM method can be applied for parameter estimation on censored data. See Section 4 for specific process of function solution.
5) Step 5: Bring parameter estimation results into mixed failure rate function of mechanical equipment to obtain failure rate function of mechanical equip-ment. In the end, conduct statistic predictive analysis of failure rate of mechanical equipment.
3 MIXED DISTRIBUTION MODEL OF
EQUIP-MENT FAILURE
3.1 Universal mixed distribution model
Mechanical equipment used in oil-gas fields are com-posed of several components. Take centrifugal pump as an example. Centrifugal pump is mainly made of pump body, impeller, sealing ring, rotation axis, and axle sealing box. Some centrifugal pumps are even equipped with guide roller, inducer, and balance disk. Each component of failure rate contains its own fea-tures. Different components have different failure probabilities in their life circles. All together, they can form the entire accumulated distribution function of failure probability of mechanical equipment.
Assume some centrifugal pump is composed of n different components and each component is in its life circle (t refers to the time period). Set the accumulated distribution function of failure corresponding to each component as G1(t), G2(t), ..., Gn(t) and the
corre-sponding mixed proportions are p1, p2, …, pn. See Formula (1) for the accumulated distribution function of equipment failure G(t) given below:
1 1
n n
G t p G t p G t (1)
Among which, pi>0 and 1 1 1 i i p
. G (t) refers to the mixed distribution model [6].Assume that the reliability function and probability density function of mixed distribution model G(t) are respectively R(t) and g(t). See Formula (2) for the specific forms given below:
1 1 ( ) ( ) ( ) ( ) n i i i n i i i R t p R t
g t p g t
(2)Then, the equipment failure rate function h(t) after mixing is shown as follows:
1 1 1 ( ) ( ) ( ) ( ) ( ) ( ) ( ) n
i i n i i i n i i i i
p g t g t
h t v t h t
R t
p R t
(3)Among which, ( )
i
v t refers to the mixed failure rate function of equipment with a size range as follows:
( )
0 ( ) 1
( )
i i i
p R t v t
R t
(4)
3.2 Solution principles for model of mixed failure rate
In some statistical period of entire equipment failure record in one oil-gas field unit, accidental failure and aging failure of equipment component can generally coexist due to different operating years of different equipment components, certain differences between individual components, and differences in operating conditions. Moreover, occurrence frequencies of ac-cidental failure and aging failure can also be different and they respectively correspond to exponential dis-tribution (E(t|λ)) and Weibull disdis-tribution (W(t|a,b)). Assume that the mixed proportion of equipment aging failure is p (0<p<1). In combination of the reliability Data input
Analysis of the reasons for equipment failure Establish mixed distribution model of equipment failure Whether statistical time interval is long
enough
Complete data parameter estimation (MLE
method)
Censored data parameter estimation method (EN
method)
[image:3.516.67.457.56.136.2]Mixed failure rate of equipment
function formulas of W and E for equipment facilities and according to Formula (2), we can calculate the reliability function of mixed distribution model of equipment:
( ) ( ) (1 ) ( ) exp ( / ) (1 ) exp( / )
b
W E
t pR t p R t p t a
p t
R
(5)
Combing this formula with Formula (4), we can calculate the failure rate function after mixing. By calculating the mixed failure rate function according to Formula (3), we can obtain the following formula through simplification:
1 1
( )
1 ( )
(1 ) exp[( ) ]
b b b b p a h t t t p p a
t
(6)
It can be seen from the calculation results of the formula given above that there are 3 unknown varia-bles in the mixed failure rate function h(t): , a and b. Method to solve parameters will be introduced in Sec-tion 4.
4 ESTIMATION ON PARAMETERS OF MIXED
FAILURE RATE MODEL
To some extent, accidental failure and aging failure of equipment can be totally separated in the statistical failure data of oil-gas field production equipment, and the proportional relationship p of these two types can be directly calculated through formulas. According to Formula (6), further calculation of mixed failure rate function can be obtained by calculating the unknown parameter of the exponential distribution corre-sponding to accidental failure and the unknown pa-rameters a and b of the Weibull distribution corre-sponding to aging failure [7].
4.1 Estimation methods for MLE parameters in exponential distribution
In general, accident failure can be repaired by equip-ment maintenance and there’s no association between each failure. In this case, failure rate is approximate to a constant. Parameter estimation value can be obtained through traditional MLE method as shown in Formula (7):
1 2
( t t) /N
(7)Among which, N refers to the total number of acci-dentally failed equipment components;
1
t
refers to the total operating time of accidentally failed equip-ment components;2
t
refers to the total operating time of normal operating components duringequip-ment operation; refers to the average total operat-ing time of components duroperat-ing statistical failure cycle.
4.2 Estimation methods for EM parameters in Weibull distribution
Oil-gas field equipment is composed of different components and there are major differences between the aging failure periods of each component. As a result, parameter estimation is required in a given period. Assume there’re n components of oil-gas field operating system suffering from aging failure in their life cycle X. The statistics of corresponding times of aging failure is as follows:
1 ... s1 ... s ... r r1... n
t t t t t t
However, according to the statistical analysis of the actual sample collection situation, the sequential aging moment data is actually shown as follows:
1
t
st
s 1...
t
r 1t
r 2T
T
This sample is called a censored sample while T1 and T2 are respectively the left censored time and the right censored time. Set
1 1
, ,...
( s s r , r)
T t t t t to obtain the maximum likelihood function of censored sample:
1
!
( , ) ( , , )( ( , , )) (1 ( , , )) ( 1)!( )!
r
s n r
W i s i s r
n
L a b T g t a b G t a b G t a b
s n r
It is very hard to solve the Weibull distribution pa-rameters in this statistical period; EM algorithm needs to be introduced to complete parameter solution. EM (Expectation-Maximization) algorithm is an iteration algorithm to solve maximum likelihood estimation of parameter. Its calculation process is simple and stable. Convergence can be reliably obtained. Each iteration includes E step (Expectation) and M step (Maximiza-tion).
At first, set ( , )a b , Trefers to observed in-complete distribution data, and Z refers to potential data of construction. ( )
W
L T is used to represent
the observation posterior distribution of
and( , )
W
L T Z means to add posterior distribution.
( , )
W
L ZT refers to conditional distribution density function. Set ( )i as the estimation value of
No.(i+1) iteration. The two steps of No. (i+1) iteration are shown as follows:
E step: Take logLW(T Z, ) as the distribution of Z to solve expectation:
( ) ( )
( )
( , ) [log ( , ) , ] log ( , ) ( , )
i i Z W i W WQ T E L T Z T
M step: Use ( )
( i , )
Q T to calculate the deriva-tions of ( , )a b . Find a point ( 1) ( 1) ( 1)
( , )
i i i
a b
to make:
( 1) ( ) ( )
( i i , ) max ( i, )
Q T Q T
Hence, the No.1 iteration ( )i (i1) is complet-ed. Iterate the above E and M, and stops after
( 1)i ( )i
hours to obtain parameter ( , )a b . Thus, the estimation value of accidental failure parameter, aging failure parameter values a and b can be calculated when input equipment gets failure data. According to the three calculated parameters and in combination of Formula (6), the equipment failure rate of oil field equipment can be calculated.
5 ANALYSIS OF MIXED MODEL ALGORITHM
ACCURACY OF FAILURE RATE BASED ON OIL FIELD CASES
This section conducted calculation analysis of the failure rate obtained from the complete failure record-ing data of the production & operation mechanical equipment used in an oil extraction work zone of a branch oil field company of PetroChina, aiming to verify the effectiveness of applying EM algorithm as the statistical failure rate method which is mentioned above.
By stating the failure recording data collected in the oil extraction work zone of this oil field and analyzing different reasons for the failure recorded in the origi-nal recording data, two failure types were figured out to explain the causes of failure: aging failure and ac-cidental failure. See Table 1 for the specific classifica-tion method.
In order to verify the effectiveness of the failure statistical method mentioned above, two comparison schemes were designed according to complete record-ing data. See Table 2 for the details. As the data size collected from the original failure record is huge, only total statistical numbers of component failure are giv-en here.
Under the two schemes as shown in Table 2,
Weibull probability was used to fit equipment acci-dental failure data (corresponding exponential distri-bution can be regarded as the Weibull distridistri-bution of shape parameter b=1) and aging failure data. As de-grees of fitting were both higher than 0.8, exponential distribution (E(t|λ)) and Weibull distribution (W(t|a,b)) can be used to simulate these two types of failure data respectively.
1) Comparison validation of parameter estimation in mixed distribution model of equipment failure rate
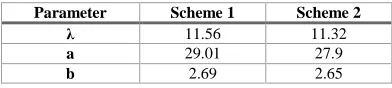
MLE method was applied to process the statistical failure data of Scheme 1 and EM algorithm was used to process the bilateral timing censored aging failure data of Scheme 2. See Table 3 for the results of pa-rameter estimation.
Table 3. The results of parameter estimation.
Parameter Scheme 1 Scheme 2
λ 11.56 11.32
a 29.01 27.9
b 2.69 2.65
From the results as shown in Table 3, it can be seen that parameter of exponential distribution λ corre-sponding to accidental failure had low sensitivity to statistical time interval of failure and size of failure data sample. Besides, after processing the bilateral timing censored data in ten years by EM algorithm in Scheme 2, the result of the obtained shape parameter b was close to that obtained by MLE method in Scheme 1.
2) Failure rate curves of the two schemes
After bringing the results of parameter estimation calculated in Table 3 into the failure rate function Formula (6) in Section 3.2 mentioned above, the vari-ation of the mixed failure rates corresponding to these two schemes changing with time in the work zone of this oil field could be seen and shown in Figure 3.
[image:5.516.265.461.373.417.2]It can be seen that the trend of the time-varying failure rate in this work zone accorded with the law of equipment “bathtub curve”. Moreover, the difference between the element failure rate calculated in Scheme 2 by applying the statistical failure data in 10 years and that calculated in Scheme 1 by applying the statis-tical failure data in 30 years is little, further verifying that this EM algorithm can be used in operational
Table 1. Failure causes and classification of equipment in oil field.
Failure cause Failure type
External factors (broken by external force, broken in traffic offence, broken by a crashing object, etc.) Natural risk damage (lightning stroke damage, air humidity, strong wind and heavy rain, etc.)
Accidental failure
Expiration of natural lifetime of equipment Aging failure
Table 2. Comparison of two cases.
Scheme Data period Data type Times of accidental failure
Times of aging failure
Mixed proportion
Estimation method
Scheme 1 1984-2014 Complete data 455 208 31.114% MLE method
analysis of equipment failure rate when censored data is insufficient in oil-field equipment failure record.
6 FOREWARNING MANAGEMENT OF
MECHANICAL EQUIPMENT FAILURE RISK BASED ON FAILURE RATE DISTRIBUTION EM algorithm used to deal with the serious censored situation of current failure record data in oil fields has been mentioned above and, further verification about the feasibility of this algorithm was made at last. The statistical probability results of this algorithm can further provide quantification proof for the mainte-nance & repair cycle, scrapping, and replacement of mechanical equipment in oil-gas enterprises and help change current equipment management pattern which is inclined to daily administrative staff’s working ex-perience. However, there’s huge working load in making artificial statistics of the tremendous and complex equipment failure data at the site. Therefore, the establishment of automatized equipment failure risk early warning management system is needed to obtain deeper data analysis, so as to improve the utili-zation effect of failure record data.
Automatized equipment failure risk early warning management system mainly analyzes the equipment failure rate distribution in different time cycles through the failure rate analysis model embedded in the system and realizes the failure rate exceeding early warning by presetting precaution value. The system can provide scientific grounds for the equipment
maintenance & repair cycle regulated by grass-roots staff and the equipment replacement & scrapping strategy set by management-level users.
As shown in Figure 4, the risk early warning man-agement principles of equipment failure based on equipment failure rate distribution are shown as fol-lows:
(1) When time frame was in TA, mechanical equip-ment failure rate was in value A and the corresponding failure rate was obviously higher than average level, meaning the current maintenance and repair level is insufficient to eliminate equipment failure risk. As a result, grass-roots staff shall conduct more routing inspection and maintenance management on equip-ment.
(2) When time frame was in TB, mechanical equip-ment failure rate was in value B and the corresponding failure rate was in a high level, meaning current aging failure probability is high and, the routing inspection and maintenance management conducted by grass-roots staff on equipment cannot guarantee nor-mal operation of equipment. As a result, manage-ment-level users need to set up an equipment re-placement and scrapping plan.
[image:6.516.128.392.59.156.2]In combination of the distribution diagram of esti-mated mechanical equipment failure rate, values of corresponding time TA and TB can be inferred and, effective risk early warning of equipment failure can be realized after grass-roots staff and manage-ment-level users confirm the A value and B value of equipment failure rate. Therefore, based on the re-search results shown in this paper, grass-roots staff
Figure 3. Mixed failure rate of oil field equipment under the two cases.
[image:6.516.145.370.191.299.2]and management-level users can make effective use of finite data to obtain preliminary analysis of equipment failure rate and realize risk early warning of equip-ment failure in different time frames, so as to improve the management level on mechanical equipment used in oil-gas fields.
7 CONCLUSIONS
This paper proposed a method to estimate the failure rate of mechanical equipment used in oil and gas fields. It can conduct corresponding failure rate simu-lation based on limited failure record. Based on the current situation that the statistical time range of me-chanical equipment failure data used in oil-gas field enterprises is short and the statistical data is incom-plete, the application of this research method can ef-fectively simulate the failure rate distribution of me-chanical equipment variation with time. This paper proposed a risk early warning management concept for mechanical equipment failure and provided scien-tific grounds for the equipment maintenance & repair cycle regulated by grass-roots staff and the equipment replacement & scrapping strategy set by manage-ment-level users, so as to effectively guarantee normal
operation of safety production in oil-gas field enter-prises.
REFERENCES
[1] Zhou, C.Y. 2014. Research on the management system based on reliability maintenance of mechanical equip-ment. Mechanical Engineer, 11: 37-40.
[2] Wang, G.X. 2014. Reliability Analysis of Early Fault Period and Random Failure Period in Machining Cen-ter. Dalian: Dalian University of Technology.
[3] Li W. 2002. Incorporating aging failures in power sys-tem reliability evaluation. IEEE Trans on Power System, 17: 918-23.
[4] Cai, Y.Z. 2014. Research on maintenance decision for highway electromechanical equipment based on bathtub curve law. North Traffic, 10: 125-132.
[5] Pan, F.Q. 2015. Structural lift and development of cen-trifugal pump. Equipment Manufacturing Technology, 5: 100-102.
[6] Ling, Y. 2006. Parameter Estimation of Hybrid Model. Shanghai: East China Normal University.