BEAR: VISUAL GESTURE VARIABILITY
Visual gesture variability between talkers
in continuous visual speech
Helen L Bear [email protected]
University of East London London E16 2RD UK
Abstract
Recent adoption of deep learning methods to the field of machine lipreading research gives us two options to pursue to improve system performance. Either, we develop end-to-end systems holistically or, we experiment to further our understanding of the visual speech signal. The latter option is more difficult but this knowledge would enable re-searchers to both improve systems and apply the new knowledge to other domains such as speech therapy.
One challenge in lipreading systems is the correct labeling of the classifiers. These labels map an estimated function between visemes on the lips and the phonemes ut-tered. Here we ask if such maps are speaker-dependent? Prior work investigated isolated word recognition from speaker-dependent (SD) visemes, we extend this to continuous speech. Benchmarked against SD results, and the isolated words performance, we test with RMAV dataset speakers and observe that with continuous speech, the trajectory between visemes has a greater negative effect on the speaker differentiation.
1
Introduction
In machine lip-reading we have a dilemma: evidence suggests we can identify individuals from their unique visual speech information ([9,19]) yet with conventional systems we pur-sue the ideal scenario of being able to lip-read any speaker. Recent work with deep learning classifiers and very large datasets promise to achieve this in end-to-end systems but by taking this road, we risk failing to understand the visual speech signal. Whilst there are behavoural studies on human perception of visual speech (human speech readers), we are yet to fully utilise computers fully to undertake these investigations.
In machine lip-reading, one attempts to interpret words spoken from the visual represen-tation of sounds as they’re uttered. This means there are two levels of ‘translation’ within the process, visual gestures (known as visemes) into phonemes, and phonemes into words. Pre-vious literature reports lip-reading performance based on different units in these three stages which makes comparing performance difficult. Some report word error rate [17,18], others viseme error rate [3], or others accuracy of these two units. However, without a known function, or map, to determine which phoneme a viseme translates to (some phonemes are visually indistinguishable and there are many suggested mappings in literature), and the same words can be pronounced with alternative phonemes, there is an argument for a speaker-dependent function for mapping between visual gestures and phonemes [2]. This idea was first presented in [16] and the latest algorithm for deriving speaker-dependent maps
c
2017. The copyright of this document resides with its authors.
BEAR: VISUAL GESTURE VARIABILITY from phoneme confusions was presented in [4]. But we need to understand, how speaker-dependent should these maps be? Whilst a speaker-generic phoneme-to-viseme (P2V) map is desirable as the concept of a viseme alphabet for every speaker is daunting, we know that adapting a trained classifier from one speaker to another similar speaker, is more data-efficient than learning a model for all speakers [11,14] which in turn achieves less accuracy. Therefore, we try to determine, just how different are speaker-dependent visemes when lip-reading continuous speech? The only prior attempt at answering this question used an iso-lated word dataset [6]. Here we use a similar methodology to test the effects of the P2V maps and suggest a simple metric to compare the maps.
2
Method Overview
We use the phoneme clustering approach in [4] to produce a series of speaker-dependent P2V maps. The intention behind the design of this viseme derivation algorithm, is to utilise the unique gestures of each speaker to improve lip reading over previous viseme sets [21] and phoneme labelled classifiers [4]. Our series of maps is made up of the following:
1. a multi-speaker P2V map usingallspeakers’ phoneme confusions;
2. a speaker-independent P2V map for each speaker using confusions of allother speak-ers in the data;
3. a speaker-dependent P2V map for each speaker.
So we have 25 P2V maps (one multi-speaker map, and 12 speaker maps per types two and three). Maps are constructed using separate training and test data over ten fold cross-validation [12]. All 25 P2V maps are in the appendices of [1].
We use the HTK toolkit [24] and build HMM classifiers with the visemes in each P2V map. The HMMs are flat-started withHCompV, re-estimated 11 times over (HERest) with forced alignment after the seventh re-estimate. Then we classify usingHViteand output results withHResults. We follow the design decisions of [20], with three state HMMs with an associated five-component Gaussian mixture per state [6]. A bigram word network is built withHBuildandHLStats, and classification is measured as word Correctness (Equation1) [24]. We report word correctness,Cw, rather than viseme correctness. This is because lip-reading is the understanding of speech, i.e. the interpretation of words rather than the matching of a single viseme. This also normalises for training sample bias across the viseme sets. The number of visemes varies per speaker so training sample volumes are not consistent, but the number of words spoken is. The BEEP pronunciation dictionary used throughout these experiments is in British English [7].
Cw=
N−D−S
N (1)
In Equation1Cw is the word correctness,Nis the total number of words,Dis the number of deletion errors, andS are substitution errors. These are counted when comparing our classifier recognition outputs with the ground truth.
2.1
RMAV Data
Of the continuous speech datasets available, most still use speaker-dependent tests [8,13,15,
BEAR: VISUAL GESTURE VARIABILITY
the test speaker is included in the training data (not the same samples). Active Appearance Models (AAMs) have been described fully in previous literature [20] so we do not repeat this here but we track all 12 speakers and extract AAM features.
The RMAV dataset is a corpus of 12 speakers, seven male and five female, each reciting 200 sentences selected from the Resource Management Corpus [3]. The database has a vocabulary size of approximately 1000 words, and was recorded in full-frontal view in HD. Head motion is restrained and lighting constant.
3
Experiment Design
Each test in this experiment is designated as:
Mn(p,q) (2)
This means P2V mapMnfrom speakern, is trained using visual speech data from speaker pand tested using speakerq. E.g. M1(2,3)designates testing a P2V map constructed from
Speaker 1, using training data from Speaker 2, and testing on Speaker 3.
3.1
Multi-speaker (MS) and Speaker-Independent (SI) tests
Accuracte speaker-dependent lip-reading exists [8,22]. However with independent speakers between training and test sets, accuracy significantly falls [11]. Our first tests use a P2V map based on the phoneme confusions of all speakers. Therefore, the MS map is tested as: M[all](1,1),M[all](2,2),M[all](3,3),M[all](4,4),M[all](5,5),M[all](6,6),M[all](7,7),M[all](8,8),
M[all](9,9),M[all](10,10),M[all](11,11), andM[all](12,12). Our SI tests use 12 maps derived using all speakers confusions bar the test speaker. This time we substitute the symbol ‘!n’ in place of a list of speaker ID numbers, meaning ‘not including speakern’. The tests for these maps are as followsM!1(1,1),M!2(2,2)and so on.
3.2
Different Speaker-Dependent maps & Data (DSD&D) tests
This set of tests use the P2V maps and training data of the non-test speaker. So for Speaker 1 we testM2(2,1),M3(3,1), up toM12(12,1), and for Speaker 2 we testM1(1,2),M3(3,2)
and so on for all speakers. Table1shows Speaker 1 tests.
Table 1: Different speaker-dependent maps and Data (DS&D) experiments for Speaker one.
Mapping (M
n)
Training data (p)
Test speaker (q)
M
n(
p
,
q
)
Sp2
Sp2
Sp1
M
2(
2
,
1
)
Sp...
Sp...
Sp1
M
...
(
...,
1
)
Sp12
Sp12
Sp1
M
12(
12
,
1
)
3.3
Different Speaker-Dependent maps (DSD) tests
BEAR: VISUAL GESTURE VARIABILITY
Table 2: Different Speaker-Dependent maps (DSD) for Speaker one.
Mapping (M
n)
Training data (p)
Test speaker (q)
M
n(
p
,
q
)
Sp2
Sp1
Sp1
M
2(
1
,
1
)
Sp...
Sp1
Sp1
M
...
(
1
,
1
)
Sp12
Sp1
Sp1
M
12(
1
,
1
)
3.4
Speaker dependent lip-reading benchmark (SSD)
Our baseline performance are speaker-dependent P2V results wheren=p=q. They are SSD because each map, training and test data are all from the same speaker. This mimics previous work in conventional systems due to small AV datasets. These maps are:M1(1,1),
(M2(2,2),(M3(3,3), up toM12,(12,12).
4
Analysis of Results
All results are measured inCw% with error bars showing one standard error (s.e) over 10 folds.
4.1
Multi-speaker and speaker-independent maps
Speaker2 Speaker4 Speaker6 Speaker7 Speaker9 Speaker11 0
2 4 6 8 10 12 14 16 18 20
M2(2,2)
Mall(2,2) M!2(2,2) M4(4,4)
Mall(4,4) M!4(4,4)
M6(6,6)
Mall(6,6) M!6(6,6) M7(7,7)
Mall(7,7) M!7(7,7) M9(9,9)
M
all(9,9) M!9(9,9)
M11(11,11)
Mall(11,11)M!11(11,11)
Te s t Sp e ake rq
W
o
r
d
c
o
r
r
e
c
t
n
e
s
s
,
C
%
[image:4.408.29.373.309.546.2]Random gue s s ing SSD bas e line Mult i- s pe ake r Sp e ake r - inde pe nde nt
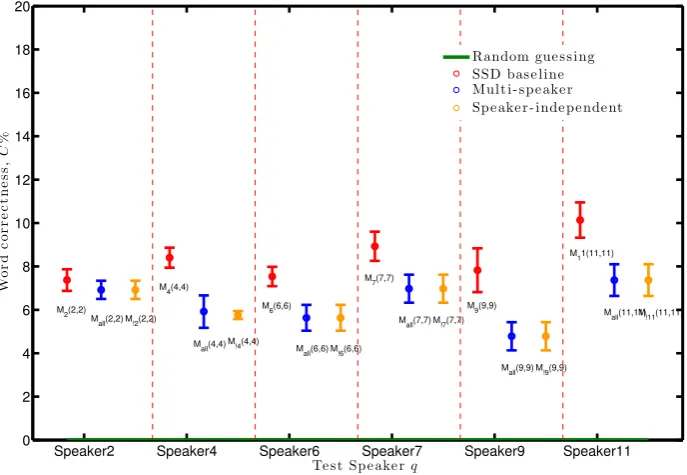
Figure 1: Word classification correctness,C±1s.e, of the MS and SI tests. Baseline is SSD maps (red)
BEAR: VISUAL GESTURE VARIABILITY
speakers (all results are plotted in supplementary materials). The SD benchmark scores are in red. All speakers bar Speaker 2 are significantly negatively affected by using generalised multi-speaker visemes, including test speakers phoneme confusions in the MS P2V doesn’t improveCw. This quantifies lip-reading dependency on speaker identity as dependent on which two speakers are being compared. Our one exception, Speaker 2, (Figure1) shows only an insignificant decrease inCw with MS and SI visemes. So one future improvement possibility is deriving multi-speaker visemes based upon sets of visually similar speakers. The challenge remains in knowing which speakers should be grouped together. This is con-sistent with the neuroscience learning adage how the human brain learns “we recognise the familiar, generalise to the similar, and adapt to the novel” [14]. Also, in [6] Figure 4 this test on isolated words were 50/50 if MS or SI maps significantly reduced lipreading. On such a small dataset we can not be conclusive, but it is reassuring that our continuous speech results are similar.
4.2
Different Speaker-Dependent results
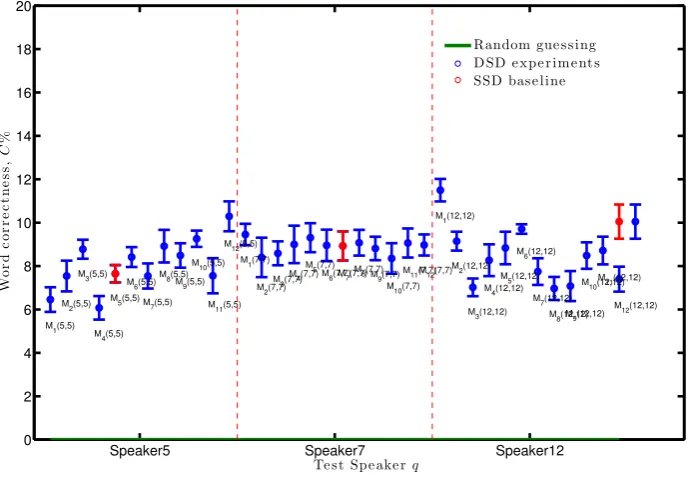
In Figures2and3we have plotted our results inCw, on they-axis and our SD benchmark. Here, the HMM is trained on the test speaker so we see the effects of the unit selection. In Figure2the three mapsM3,M7andM12all significantly reduceCwfor Speaker 1. In con-trast, for Speaker 2 there are no significantly reducing maps but maps 1, 4, 5, 6, 9, and 11 all significantly improve the classification of Speaker 2. This suggests its not just the speakers identity which is important for good classification but how it is used. Some individuals may simply be easier to lip-read (for reasons as yet unknown) or there are similarities between cer-tain speakers which when learned from SpeakerAare adaptable to lip-read visually-similar speakers.
BEAR: VISUAL GESTURE VARIABILITY
Speaker1 Speaker2 Speaker3 0 2 4 6 8 10 12 14 16 18 20
M1(1,1) M2(1,1)
M
3(1,1)
M
4(1,1)
M5(1,1) M6(1,1)
M7(1,1) M
8(1,1)
M
9(1,1)M10(1,1)
M11(1,1) M12(1,1)
M1(2,2)
M2(2,2)M3(2,2)M4(2,2)
M5(2,2) M
6(2,2)
M7(2,2)M8(2,2)
M
9(2,2)
M
10(2,2)
M11(2,2) M12(2,2)
M
1(3,3)
M2(3,3) M3(3,3)
M4(3,3) M
5(3,3)
M6(3,3)M7(3,3) M8(3,3)
M
9(3,3)
M10(3,3)M11(3,3)
M12(3,3)
Te s t Spe ake r q
W o r d c o r r e c t n e s s , C %
[image:6.408.29.374.36.272.2]Random gue s s ing D SD e xpe r im e nt s SSD bas e line
Figure 2: Word classification correctness,C±1s.e, of the DSD tests for speakers 1, 2 and 3. Baseline is SSD maps (red)
Speaker5 Speaker7 Speaker12 0 2 4 6 8 10 12 14 16 18 20 M 1(5,5)
M2(5,5) M3(5,5)
M
4(5,5)
M5(5,5) M6(5,5)
M7(5,5) M8(5,5)
M
9(5,5)
M
10(5,5)
M11(5,5) M12(5,5)
M1(7,7)
M2(7,7)M3(7,7)
M4(7,7) M5(7,7)
M6(7,7)M7(7,7)M8(7,7)M9(7,7) M10(7,7)
M11(7,7)M12(7,7) M1(12,12)
M2(12,12)
M3(12,12) M
4(12,12)
M
5(12,12)
M6(12,12)
M7(12,12) M8(12,12)M
9(12,12)
M10(12,12)M11(12,12)
M
12(12,12)
Te s t Spe ake r q
W o r d c o r r e c t n e s s , C %
Random gue s s ing D SD e xpe r im e nt s SSD bas e line
[image:6.408.28.373.326.564.2]BEAR: VISUAL GESTURE VARIABILITY
We rank each speaker viseme set by weighting the effect of the DSD tests in Table3. If a map increases on SSDCw within 1s.e, this scores+1 or outside 1s.escores +2. If a map decreasesCw, these weights are negative. The key observation in Table3is Speaker
Table 3: Comparison scores measuring the effect of using speaker-dependent maps forother
speakers lip-reading.
M1 M2 M3 M4 M5 M6 M7 M8 M9 M10 M11 M12
Sp01 0 −1 −2 −2 +1 −1 −1 −1 +1 +1 −1 +1
Sp02 +2 0 +1 +1 +2 +2 +1 +1 +2 +2 +1 +2
Sp03 −2 −2 0 −2 +1 −1 −1 −2 −2 −2 −2 +1
Sp04 −2 −1 −1 0 +1 +1 −2 −2 +1 −1 −2 +1
Sp05 −2 −1 +2 −2 0 +1 −1 +2 +1 +2 −1 +2
Sp06 −1 −1 −1 +1 +2 0 +2 −1 −1 +1 +1 +2
Sp07 +1 −1 −1 +1 +1 +1 0 +1 −1 −1 +1 +1
Sp08 −1 −1 +1 −1 −1 −2 −2 0 +1 +2 +1 +1
Sp09 −2 −2 −1 −2 −1 −1 −1 −2 0 −1 −2 +1
Sp10 −2 −2 −1 −1 −1 −2 −2 −2 −2 0 −2 −2
Sp11 −1 +1 −1 +1 +1 −1 +1 −1 −1 +2 0 +2
Sp12 −1 −2 −2 −1 −1 −2 −2 −2 −2 −1 −2 0
Total −9 −11 −6 −7 +3 −5 −8 −9 −3 −4 −8 +12
12. M12 is one of two (M12 andM5) which make an overall improvement in classifying
other speakers with positive values in the total row and crucially,M12only has one speaker
(Speaker 10) for whom the visemes inM12does not make an improvement in classification.
The one other speaker P2V map which improves over other speakers isM5. All others show
a negative effect, this reinforces the assertion visual speech is unique to speakers but we now have evidence of exceptions. In future a way of measuring the similarity between the viseme maps of each individual speaker, this would help adaptation from one speaker to another with less training data.
4.3
Different Speaker-Dependent map & Data results
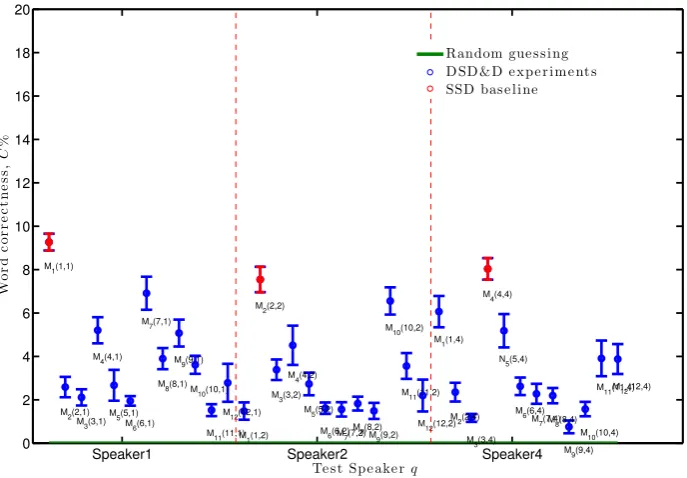
Figures4 and 5 show theCw achieved with the labelled DS&D tests. It is reassuring to see some speakers significantly deteriorate the classification rates when the speaker used to train the classifier is not the same as the test speaker as this is consistent with our MS and SI tests. For example, on the leftmost side of Figure4, the test speaker is Speaker 1. The speaker-dependent maps for all 12 speakers have been used to build sets of classifiers. But when tested on Speaker 1, only maps and models for speakers 3, 7 and 12 show a significant reduction in word correctness. All eight other speakers are within one standard error. Figure5we see a similar trend with Speaker 4 showing the most variation of these three speakers. To lip-read Speaker 4 we actually see a significant improvement by using the map and model of Speaker 6 and less significant improvements by speakers 3, 5 and 11. However, whilst these are all signs towards speaker-independent lip-reading, the most common trend is, there is a lot of overlap between our continuous speech speakers and this natural variation is attributed to the speaker identity and or linguistics restrictions.
BEAR: VISUAL GESTURE VARIABILITY
Speaker1 Speaker2 Speaker4 0
2 4 6 8 10 12 14 16 18 20
M1(1,1)
M
2(2,1)M 3(3,1)
M4(4,1)
M5(5,1) M6(6,1)
M
7(7,1)
M8(8,1) M9(9,1)
M10(10,1)
M11(11,1) M
12(12,1)
M1(1,2) M2(2,2)
M
3(3,2)
M
4(4,2)
M
5(5,2)
M
6(6,2)M7(7,2)
M
8(8,2)M
9(9,2)
M10(10,2)
M11(11,2)
M12(12,2) M1(1,4)
M2(2,4) M3(3,4)
M4(4,4)
N
5(5,4)
M
6(6,4)M
7(7,4)M8(8,4)
M9(9,4) M10(10,4)
M11(11,4)M12(12,4)
Te s t Spe ake rq
W
o
r
d
c
o
r
r
e
c
t
n
e
s
s
,
C
%
[image:8.408.29.373.30.269.2]Random gue s s ing D SD &D e xpe r im e nt s SSD bas e line
Figure 4: Word classification correctness,C±1s.e, of the DSD&D tests for speakers 1, 2 and 4. Baseline is SSD maps (red)
Table 4:
Dataset Sp1 Sp2 Sp3 Sp4 Sp5 Sp6 Sp7 Sp8 Sp9 Sp10 Sp11 Sp12 AVL2 14.06 11.87 42.08 32.75 - - - -RMAV 5.78 4.74 6.49 5.13 5.57 4.92 6.60 5.19 5.64 7.03 7.49 8.04
BEAR: VISUAL GESTURE VARIABILITY
Speaker6 Speaker7 Speaker8 0 2 4 6 8 10 12 14 16 18 20 M
1(1,6)M2(2,6)
M3(3,6) M4(4,6)
M5(5,6) M6(6,6)
M7(7,6) M
8(8,6)
M9(9,6) M
10(10,6)
M
11(11,6)
M12(12,6) M
1(1,7)
M2(2,7)
M3(3,7) M4(4,7)
M5(5,7)
M
6(6,7)
M7(7,7)
M8(8,7) M9(9,7)
M
10(10,7)
M
11(11,7)
M12(12,7)M1(1,8)
M2(2,8)
M
3(3,8)
M4(4,8)
N5(5,8) M 6(6,8) M 7(7,8) M 8(8,8) M 9(9,8) M 10(10,8)
M11(11,8) M12(12,8)
Te s t Spe ake rq
W o r d c o r r e c t n e s s , C %
[image:9.408.36.383.31.270.2]Random gue s s ing D SD &D e xpe r im e nt s SSD bas e line
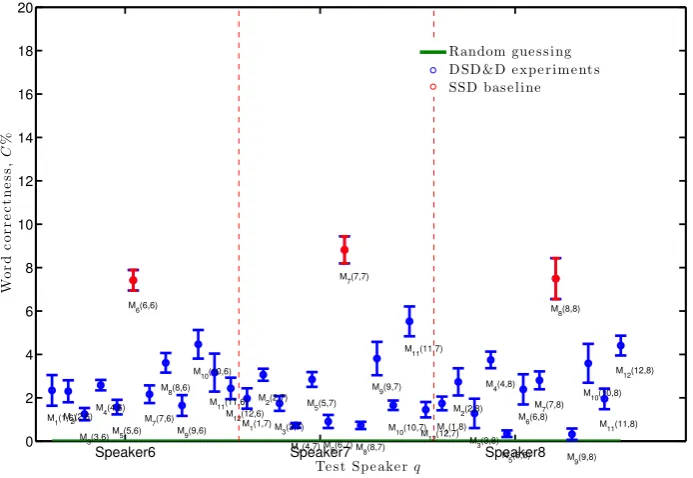
Figure 5: Word classification correctness,C±1s.e, of the DSD&D tests for speakers 6,7, and 8. Baseline is SSD maps (red)
5
Conclusions
In our MS and SI maps, there are±2 visemes per set whereas the SSD maps have a range of six. So we conclude, there is high risk of over-generalising a MS/SI P2V map. We suggest it is not only the speaker-dependency that varies but also the contribution of each viseme within the set which affects the word classification performance, an idea also shown in [5]. These results present, that a set of certain MS visemes with some SD visemes, may improve speaker-independent lip-reading. We have shown exceptions where the P2V map selection is significant and where classifiers trained on non-test speakers has not been detrimental. This gives hope that with visually similar speakers, speaker independent lip-reading is possible.
Furthermore, with continuous speech, we have shown that speaker dependent phoneme-to-viseme maps significantly improve lipreading over isolated words. We attribute this to the co-articulation effects on phoneme recognition confusions which in turn influences the speaker-dependent maps with linguistic or context information. This is supported by evi-dence from conventional lipreading systems which show the strength of language models in lipreading accuracy.
BEAR: VISUAL GESTURE VARIABILITY
References
[1] Helen L Bear.Decoding visemes: improving machine lip-reading. PhD thesis. Univer-sity of East Anglia, 2016.
[2] Helen L Bear and Richard Harvey. Decoding visemes: improving machine lip-reading. In41st International Conference Acoustics, Speech and Signal Processing (ICASSP), 2016.
[3] Helen L Bear, Richard Harvey, Barry-John Theobald, and Yuxuan Lan. Resolution limits on visual speech recognition. InImage Processing (ICIP), IEEE International Conference on, pages 1371–1375. IEEE, 2014.
[4] Helen L Bear, Richard W Harvey, Barry-John Theobald, and Yuxuan Lan. Which phoneme-to-viseme maps best improve visual-only computer lip-reading? In Advances in Visual Computing, pages 230–239. Springer, 2014. doi: 10.1007/ 978-3-319-14364-4_22.
[5] Helen L Bear, Gari Owen, Richard Harvey, and Barry-John Theobald. Some observa-tions on computer lip-reading: moving from the dream to the reality. InSPIE Security and Defence, pages 92530G–92530G. International Society for Optics and Photonics, 2014. doi: 10.1117/12.2067464.
[6] Helen L Bear, Stephen J Cox, and Richard Harvey. Speaker independent machine lip reading with speaker dependent viseme classifiers. In1st Joint International Confer-ence on Facial Analysis, Animation and Audio-Visual Speech Processing (FAAVSP), pages 115–120. ISCA, 2015.
[7] Cambridge University, UK. The BEEP Pronunciation Dictionary - British English.
ftp://svr-ftp.eng.cam.ac.uk/comp.speech/dictionaries/, 1997.
Accessed: January 2013.
[8] Luca Cappelletta and Naomi Harte. Phoneme-to-viseme mapping for visual speech recognition. In International Conference on Pattern Recognition Applications and Methods (ICPRAM), pages 322–329, 2012.
[9] H. E. Cetingul, Y. Yemez, E. Erzin, and A. M. Tekalp. Discriminative analysis of lip motion features for speaker identification and speech-reading. IEEE Transactions on Image Processing, 15(10):2879–2891, Oct 2006. ISSN 1057-7149. doi: 10.1109/TIP. 2006.877528.
[10] J S Chung and Andrew Zisserman. Lip reading in the wild. InAsian Conference on Computer Vision, 2016.
[11] Stephen Cox, Richard Harvey, Yuxuan Lan, Jacob Newman, and Barry Theobald. The challenge of multispeaker lip-reading. InProceedings of the International Conference on Auditory-Visual Speech Processing (AVSP), pages 179–184, 2008.
BEAR: VISUAL GESTURE VARIABILITY
[13] Timothy J. Hazen, Kate Saenko, Chia-Hao La, and James R. Glass. A segment-based audio-visual speech recognizer: Data collection, development, and initial experiments. InProceedings of the 6th International Conference on Multimodal Interfaces, ICMI ‘04, pages 235–242, New York, NY, USA, 2004. ACM. ISBN 1-58113-995-0. doi: 10.1145/1027933.1027972. URLhttp://doi.acm.org/10.1145/1027933. 1027972.
[14] Dave F Kleinschmidt and T Florian Jaeger. Robust speech perception: Recognize the familiar, generalize to the similar, and adapt to the novel. Psychological review, 122 (2):148, 2015.
[15] Yuxuan Lan, Richard Harvey, and Theobald Barry-John. Insights into machine lip reading. In38th International Conference Acoustics, Speech and Signal Processing (ICASSP), 2012.
[16] S.A. Lesner and P.B Kricos. Visual vowel and diphthong perception across speakers. Journal of the Academy of Rehabilitative Audiology, 14:252–258, 1981.
[17] P. Lucey and G. Potamianos. Lipreading using profile versus frontal views. In2006 IEEE Workshop on Multimedia Signal Processing, pages 24–28, Oct 2006. doi: 10. 1109/MMSP.2006.285261.
[18] Patrick Lucey, Gerasimos Potamianos, and Sridha Sridharan. Visual speech recognition across multiple views. Visual Speech Reognition: Lip Segmentation and Mapping, 2009.
[19] J. Luettin, N. A. Thacker, and S. W. Beet. Speaker identification by lipreading. In Spoken Language, 1996. ICSLP 96. Proceedings., Fourth International Conference on, volume 1, pages 62–65 vol.1, Oct 1996. doi: 10.1109/ICSLP.1996.607030.
[20] Iain Matthews and Simon Baker. Active appearance models revisited. International Journal of Computer Vision, 60:135–164, 2004.
[21] Sarah L Taylor, Moshe Mahler, Barry-John Theobald, and Iain Matthews. Dynamic units of visual speech. InProceedings of the 11th ACM SIGGRAPH/Eurographics conference on Computer Animation, pages 275–284. Eurographics Association, 2012.
[22] Kwanchiva Thangthai, Richard W Harvey, Stephen J Cox, and Barry-John Theobald. Improving lip-reading performance for robust audiovisual speech recognition using dnns. InAVSP, pages 127–131, 2015.
[23] Yee Wan Wong, Sue Inn ChÕng, Kah Phooi Seng, Li-Minn Ang, Siew Wen Chin, Wei Jen Chew, and King Hann Lim. A new multi-purpose audio-visual unmc-vier database with multiple variabilities. Pattern Recognition Letters, 32(13):1503 – 1510, 2011. ISSN 0167-8655. doi: http://dx.doi.org/10.1016/j.patrec.2011.06.011.