Munich Personal RePEc Archive
Hate Source: White Supremacist Hate
Groups and Hate Crime
Mulholland, Sean E.
Stonehill College
11 February 2011
Hate Source: White Supremacist Hate
Groups and Hate Crime
Sean E. Mulholland
Stonehill College
Abstract
The relationship between hate group activity and hate crime is the-oretically ambiguous. Hate groups may incite criminal behavior in sup-port of their beliefs. On the other hand, hate groups may reduce hate crime by serving as a forum for members to verbally vent their frus-trations or as protection from future biased violence. I …nd that the presence of an active white supremacist hate group chapter is associ-ated with an 18.7 percent higher hate crime rate. White supremacist groups are not associated with the level of anti-white hate crimes com-mitted by non-whites, nor do they form in expectation of future hate crimes by non-whites.
JEL Codes: K14, J15, D71
1
Introduction
The relationship between hate group activity and hate crime is theoretically ambiguous.1Hate group activities may serve to incite criminal or violent
be-havior in support of their beliefs. On the other hand, if hate groups serve as support groups for like-minded individuals, members may use meetings and protests as a way to verbally vent their frustrations. Thus hate group members may be less likely to carry out these frustrations through criminal or violent acts. Hate grous may also serve as a means of protection for individuals who believe they will be victims of biased violence in the future.
From 1997 to 2007, the Southern Poverty Law Center (SPLC), an authority on hate group activity, declared that the number of active white supremacist hate group chapters in the United States increased by 63 percent, from 474 in 1997 to 888 in 2007.2 Yet, over the same period, the number of hate crimes
1For a discussion of the historical literature and a fresh look at old analyses of hate
crimes, see Green, Glaser, and Rich [1998].
2The number of groups and the number of a¢liations have changed over time. The
recorded in the United States fell by 6.1 percent, from 8443 to 7945.3 Figure
1 depicts the slow and steady increase in the total number of active white supremacist chapters and the number of hate crimes reported across in the United States.
<<Figure 1 here>>
Previous studies have focused on economic conditions, demographics, and historical links between government provided services and the choice to form or join a hate group [Je¤erson and Pryor, 1999 and Mulholland, 2010]. However, few have looked at the determinants of hate crimes and all but one fail to in-clude a measure of hate group activity. McDevitt and Levin [1993] use Boston data and observe that many hate crimes involved violence directed at dissim-ilar others moving into a previously segregated area. Medo¤ [1999] performs a cross-sectional state estimation and …nds that market wages, mean age, and law enforcement activity predict hateful activity, but urbanization, occupa-tional status, and social mobility do not. Gale, Heath, and Ressler [2002] use a panel of 37 states from 1992 through 1995 and …nd that hate crime rates are positively correlated with unemployment rates, abuse rates, and the parity of income between blacks and whites. They also …nd hate crime is negatively correlated with law enforcement expenditures. Ryan and Leeson [2010] use state level panel data from 2002 through 2008 to …nd that unemployment and poverty are strongly associated with more hate crime, where as demographics and, most notably, the number of hate groups are not.
Using U.S. county-level panel data from 1997 through 2007 and control-ling for unobserved county-level time-invariant heterogeneity, I …nd that hate crimes are 18.7 percent more likely to occur in counties with active white supremacist hate group chapters. Excluding hate crimes listed as anti-white, the presence of a white supremacist chapter is associated with a 19.7 to 24 percent higher rate of hate crimes and between a 22 to 25 percent higher rate of hate crimes committed by white perpetrators. Anti-white hate crimes committed by non-white perpetrators are not associated with the presence of a white supremacist chapter. Rejecting the protection hypothesis, I fail to …nd white supremacist chapter formation in expectation of future hate crimes by non-whites. Nor do I …nd chapter formation in response to increases in anti-white hate crimes perpetrated by non-whites.
Section 2 presents a brief historical look at the evolution of hate crime legislation in the United States. Section 3 discusses hate groups and their origins. Section 4 lays out the estimation methodology. Sections 5 and 6 discuss the data and the estimated relationship between white supremacist chapters and hate crimes. Section 7 investigates further hypotheses on the relationship between hate groups and hate crimes. Section 8 o¤ers concluding remarks.
3Multiple hate crimes are sometimes reported for a single hate crime incident. Hate
2
Hate Crime
Biased violence directed toward select social characteristics or status, moti-vated by racism, xenophobia, anti-Semitism, and other biases has been docu-mented throughout history: from the Old Testament description of the geno-cides of Amalekites and Midianites to more recent ethnic and religious-based violence in Bosnia and Sudan. The history of the United States includes bias-motivated violence against Native Americans, African Americans, and others. The movement for categorizing certain violent activity directed at individuals based on their ethnic or social characteristics as “hate crimes" in the United States, however, is a recent phenomena. According to Jenness and Ryken, in their bookMaking Hate a Crime: From Social Movement to Law Enforce-ment, an "anti-hate crime movement" was "energized by several previous social movements" and "emerged in the late 1970s to bring public attention to vio-lence directed at certain minorities" [Jenness and Ryken, 2001. p.17]. Jenness and Ryken suggest that the movement to make biased violence a unique type of crime was born out of the combination of the modern civil rights movement and the crime victim movement.
The civil rights movement initially concentrated on contesting legal prohi-bitions based on race. First focusing on voting and then expanding to separate but equal standards, the civil rights movement sought to obtain similar rights for those of all races. As groups such as the National Association for the Ad-vancement of Colored People (NAACP) slowly reduced legal racism, they then turned to reducing violence directed at those due to ethnic, racial, or religious status. With these successes, women’s and gay rights groups became more active in highlighting violence directed at women and gays [Katz, 1976].
In the late seventies, a separate and distinct victim rights movement de-veloped as a response to the Warren court’s expansion of defendant’s rights [Weed, 1995 and Maroney, 1998]. The victim rights movement, along with the women’s rights groups brought attention to the long run trauma of survivors of violence. These organizations focused their e¤orts on both the direct trauma resulting from the violence and the abuse that often times took place through the court system. Lead by Wisconsin in 1981, states began passing victims’ rights legislation. By 1989, forty-two states had passed victims’ rights bills [Weed, 1995].
As these organizations continued to track bias-motivated violence, they slowly began creating "a societal perception that hate crime was a speci…c evil requiring a speci…c response" Maroney [1998, 579]. The speci…c response often requested was legal redress. Beginning with Washington and Oregon in 1981, states began enacting hate crime legislation that criminalized violence direct at groups due to their racial, ethnic, religious, and various other characteristics. The activity of organizations interested in victims and civil rights culmi-nated in the 1990 passage of the Federal Hate Crime Statistics Act (P.L.101-275). The act de…nes hate crimes as criminal incidents that are at least par-tially directed against the victims’ race, religion, sexual orientation, or eth-nicity/nationality.4 The act also instructed the FBI to aggregate hate crime
data from agencies actively documenting and willing to voluntarily report hate crime statistics. In 1992, the FBI began publishing Hate Crime Statistics, a compilation of hate crime reported by various law enforcement agencies across the US.5
Di¤erences in how agencies de…ne and report hate crimes are problematic in any empirical study on crimes in general and hate crimes in particular. As pointed out by Gale, Heath, and Ressler [2002], while hate crime statis-tics documentation have improved, there are still serious problems associated with crime statistics. DiIulio [1996] identi…es two potentially severe measure-ment errors of crime data: under-reporting by victims and by law enforcemeasure-ment agencies. Besci [1999] shows that wide variation exists between crime data sources by comparing the Uniform Crime Report to other sources of crime data. Furthermore, Grove, Hughes, and Geerken [1985] …nd that the reported crime rates are closer to the real crime rates for crimes that are less ambigu-ous between victims and law enforcement, such as homicide, than for more ambiguous crimes, such as aggravated assault. Grove et al. suggest that this ambiguity will likely overstate the reported crime rate.
The core concept of a hate crime is ambiguous and therefore can make classi…cation di¢cult in almost every case [Jacobs and Potter 1998]. However, Martin [1995, 1996] in two quantitative studies on the Baltimore County and New York City police departments and Boyd, Berk, and Hamner [1996] in a study looking at two policing divisions within a large urban police department, …nd that the process is less problematic than suggested by Jacob and Potter. "[F]ar from …nding it problematic to interpret and classify speci…c incidents, police detectives engage in certain routine practices in order to determine the hate-related status of an incident" [Boyd, Berk, and Hammer 1996, 821]. Thus
4For more information on the Hate Crime Statistics Act, see CRS Report RL33403, Hate
Crime Legislation, by William J. Krouse.
5Especially early on, the concept of a hate crime was nebulous and had yet to be tested
within a division the reporting mechanism for these police departments may be well de…ned and easier to follow than suggested by Jacobs and Potter [1998]. However, Boyd, Berk, and Hammer show that reporting methods di¤eracross
divisions causing comparisons across divisions to be suspect. Therefore, this manuscript will only look at changes in hate crimes within each county. Even looking within each county does not eliminate ambiguity and subjectivity that may occur across each division within each agency. Thus any empirical results must be interpreted through a critical lens.
3
Hate Groups
The Southern Poverty Law Center de…nes a hate group as an organization having "beliefs or practices that attack or malign an entire class of people, typically for their immutable characteristics" [SPLC 2010]. Iannaccone [1992] and Berman [2000; 2003] demonstrate why rational, utility-maximizing in-dividuals voluntarily sacri…ce to join religious organizations, fraternities and sororities, communes, and hate groups. Hate group membership often requires certain prohibitions and costly signals, such as tattoos, piercings, and acts of violence. Participation in such prohibitions reveals to other members that the individual is committed to the organization, and as such, grants an active member certain privileges and bene…ts. Joining reveals that the bene…ts of membership are greater than the costs associated with signaling commitment to the group.
White supremacist hate groups are by no means identical. Each organiza-tion, as shown in Table 1, has di¤erent levels of prohibitions and goals and thus solves the problem of collective action in a variety of ways. Racist Skinhead and neo-Nazi members, unlike Ku Klux Klan and Christian Identity mem-bers, often display tattoos or wear distinctive clothing to signal membership. Furthermore, each type and chapter express their biased views in a variety of manners. Some are physically violent while others are not.
<<Table 1 here>>
own shared incapacities than by mutual goals. Primarily, group identi…cation is important as it serves individual needs; it leads to delinquent group activity only secondarily and only in the absence of pro-social alternatives.” Thus, if Klein is correct, it may be the case that hate groups do not a¤ect the overall rate of hate crimes if they serve more of a pro-social role.
Furthermore, recent emprical work by Osoba and Sobell [2009] on youth gangs suggests that gangs form in response to government’s failure to protect youth against violence.6 Without gangs, the level of violence may actually be
higher. If hate groups form to protect its members from future violence, hate groups may actually be associated with less crime and even less hate crime.
4
Estimation Method
The goal is to determine whether the hate crime rate in county i in year t is associated with white supremacist activity in countyi for yeart. While anec-dotal evidence suggests that the number of chapters is positively correlated with the number of members, the SPLC does not report the number of mem-bers per chapter.7 Therefore, changes in the number of chapters may be a poor
measure of the level of activity. The formation of additional active hate group chapters from one year to the next may simply be a result of the splintering of one large group; the reduction in the number of chapters may be the result of a merger. Following Je¤erson and Pryor [1999] and Mulholland [2010], this analysis will focus on whether hate crime rates are associated with counties home to any active white supremacist chapters and not the total number of chapters.8
To address these issues, I …rst construct a dichotomous variable, activeit:
activeit =
1if number of active white supremacist chapters is >0
0 if no active white supremacist chapters present (1)
where activeit equals one if there are active white supremacist hate group 6Theoretical models of government formation out of anarchy are developed by Nozick
[1974] and Buchanan [1975].
7For two discussions on the correlation between number of active chapters and
member-ship see: Intelligence Report [2000] and The Stephen Roth Institute [2004].
8A county may be home to a hate group even though it is not reported as present for
that calendar year. It is possible that the hate group chapters simply did not draw attention to themselves for that calendar year. In order to determine the e¤ects of this possibility, I construct alternative measures that assumed a county was hate group free only if that county witnessed no hate group activity over multiple years. If an active hate group is present during any one of these years, I assume that the hate group was simply silent during the others and continued to be present over the entire time period.
chapters in county iat timet and zero if no active white supremacist chapter is reported.
I then estimate the e¤ects of the presence of one or more active white supremacist chapters on the overall rate of a hate crime:
hate crimeit = + activeit +xit + i+ t+"it (2)
wherehate crimeitis the hate crime rate in countyiin yeart; activeit indicates
presence of an active white supremacist chapter, xit is the vector of
explana-tory variables for county i in time period t, and is the vector of county parameters to be estimated. The control variables in xit include real median
household income, the unemployment rate, the real unemployment bene…ts per unemployed citizen, the poverty rate, the percentages of the population that are black, Hispanic, and white, the population density, the percentage of males age …fteen through forty-four, and the overall crime rate.9 The Hausman
test rejects the null hypothesis that the coe¢cients estimated by the e¢cient random e¤ects estimator are the same as the ones estimated by the consistent …xed e¤ects estimator.10 Therefore I include time-invariant, county-speci…c
e¤ects represented by i to control for omitted variables that di¤er between
counties but are constant over time. This …xed e¤ects estimation methodology relies on within county variation. The year dummies, t, control for omitted
changes over time that a¤ect all counties similarly. The error term,"it;is
clus-tered by county in order to account for non-random errors within each panel [Rogers, 1993; Williams, 2000; and Wooldridge, 2002].11
There are ‡aws associated with the collection of hate crime data that may bias the estimates. First, many states and local governments do not have formal guidelines for law enforcement o¢cials on how to complete a formal hate crime report.12 Thus only a fraction all possible hate crimes are reported.
If counties with active hate groups are more likely to report crimes as hate crimes, then the estimates will be upward biased. If counties with active hate
9I do not include real expenditures on police protection because it is only available for
1997 and 2002 at the county level from the Census Bureau’sCensus of Governments. When including real police expenditures, the presence of an active white supremacist chapter is associated with a greater increase in all types of hate crimes than the estimates presented in Table 3.
10The Hausman test value of 73.26 with 20 degrees of freedom result in a p-value of .00,
thus rejecting the null that the more e¢cient random e¤ects estimator returns the same estimates as the …xed e¤ects estimator.
11Assuming that hate groups did not alter their voting behavior over this time period,
using …xed e¤ects partially addresses any worry that that hate groups "may vote for policies that reduce the local government provision of services [Glaeser 2005]."
12Hate crime data reported by the FBI are "from all law enforcement agencies that
groups are less likely to report crimes as hate crimes, then the estimates will be downward biased.
Second, in counties where hate crime reporting is conducted by a fraction of state and local agencies, only a portion of a county’s population may be covered. If localities within a county where active white supremacist chapters are present are less likely to be covered by hate crime reporting, this will downward bias the estimates. Finally, participation of agencies can vary from year to year. If this is random, it will not bias the estimates. However, if agencies are less likely to …le a report when chapters are present, the estimates will be downward biased. If agencies fail to submit hate crime information when white supremacist chapters are not present, the estimates will be upward biased.
5
Hate Crime and Hate Group Data
Hate crime data comes from the FBI’s annual report, Hate Crime Statistics.
First published in 1992, Hate Crime Statistics compiles hate crimes reported by various law enforcement agencies. In 1992, Hate Crime Statistics covered only 51 percent of the United States population from 42 states. By 1997, 83 percent of the population from 48 states and DC were covered. This is similar to the coverage in 2007: 85.7 percent from 49 states and DC. Due to the relative stable percentage of population covered from 1997 to 2007, ranging from a high of 86.6 percent in 2004 and a low of 80.0 percent in 1998, this manuscript uses data on hate crimes from 1997 through 2007.
Figure 2 maps the highest hate crime rate for each county over the 1997 to 2007 time period.13 In 1997 approximately 21 percent of counties reported at
least one hate crime incident with 52 percent of incidents resulting in one or two hate crimes committed. By 2007, 27 percent of counties reported at least one hate crime incident with just under 50 percent of incidents resulting in one or two criminal charges. While the overall number of hate crimes fell between 1997 to 2007, the number of counties reporting at least one hate crime rose by twenty-four percent. The portion of counties reporting at least one hate crime between 1997 and 2007 is 60.6 percent. The highest hate crime rate over this period, 37.4 out of 10,000, was reported for Scott County, Arkansas in 2003. Even though states such as Georgia, Alabama, and Mississippi have no state data collection statutes, some agencies voluntarily submit hate crime reports to the FBI. The portion of former Confederate States of America (CSA) counties reporting at least one hate crime is 55.8 percent.
<<Figure 2 here>>
13Hate crimes are reported at the agency level not the county level. Agencies whose
The Southern Poverty Law Center tracks hate groups by "using hate group publications and websites, citizen and law enforcement reports, …eld sources and news reports" [Southern Poverty Law Center]. Initiated in 1981, 1997 marks the …rst year the SPLC attempted to gather data for all known active hate group chapters by city.14 Although the SPLC now tracks many types of
organizations only the Ku Klux Klan, neo-Nazi, Racist Skinhead, and Chris-tian Identity groups are available for every year from 1997 to 2007.15 Between
1997 and 2007, 793 US counties, or approximately 25 percent, were home to at least one active hate group.16 Figure 3 shows the maximum number of Ku
Klux Klan, neo-Nazi, Racist Skinheads, and Christian Identity chapters by county reported during any calendar year from 1997 to 2007. Harris County, Texas, in 2006, and Cook County, Illinois, in 1997, 2005, and 2006, were home to the largest number of active hate group chapters during a single calendar year. Counties located in states that were part of the CSA are well represented and make up 43.4 percent of those reporting an active hate group through-out the period. However, over half of the counties reporting an active hate group were located outside the former CSA. In fact, of the twelve counties that report …ve or more active hate group chapters during a calendar year, only three: Harris, Texas in 2006 and 2007; Tarrant, Texas in 1998, and Spar-tanburg, South Carolina in 2005 and 2006 are located in states that were part of the CSA.
<<Figure 3 here>>
Figure 4 depicts the change in the overall presence of active Ku Klux Klan, neo-Nazi, Racist Skinheads, and Christian Identity chapters between 1997 through 2007. The thirty-two counties in red were always home to at least one active white supremacist chapter. Seven hundred and sixty one counties, shown in blue, representing 49 states witnessed at least one year with one or more active white supremacist chapters and one year without an active chapter. Of these 761 counties, 215 report an active chapter for only one year.
14Although the SPLC reports hate group location by city or town, the analysis is
per-formed at the county level for theoretical and empirical reasons. First, many hate groups chapters hold rallies and recruitment meetings outside their home towns in locations nearby and thus have members from the surrounding towns and townships. Second, because many of these towns are not in Metropolitan Statistical Areas, county level data represents the least aggregated measures of crime, unemployment, poverty, and the like that are available.
15In 2000 the Southern Poverty Law Center began monitoring Neo-Confederate
organi-zations. This study does not include those organizations because of their initial omission by the Southern Poverty Law Center, nor does it include Black Separatists or the "Other" category.
16Not all active hate groups can be assigned to a single county. For instance the SPLC
All remaining counties, shown in white were never home to an active white supremacist chapter.
<<Figure 4 here>>
Looking at the individual hate group types, 3.8 percent of the county-year observations report the presence of at least one active Ku Klux Klan chapter. Counties reporting an active KKK chapter for at least one year, were home to an active KKK chapter about 26 percent of the time. Neo-Nazi chapters look similar to KKK chapters with 4.1 percent of county-year observations reporting the presence of a neo-Nazi chapter. Only about 2 percent of counties were home to a neo-Nazi organization over the ten year period. Racist Skinheads are much more transient than most other type of hate groups; counties that were home to a Racist Skinhead chapter reported an active Racist Skinhead chapter only 15 percent of the time. Christian Identity Churches were present in 3.5 percent of the counties. Christian Identity Churches were the least likely to disband. Counties that were home to a Christian Identity Church for at least one year, were home to an active church 34 percent of time.
Table 2 displays the county-level summary statistics for hate crime rates, by various types of victims and perpetrators, and white supremacist activity.
<<Table 2 here>>
6
The Relationship Between Hate Groups and Hate
Crime
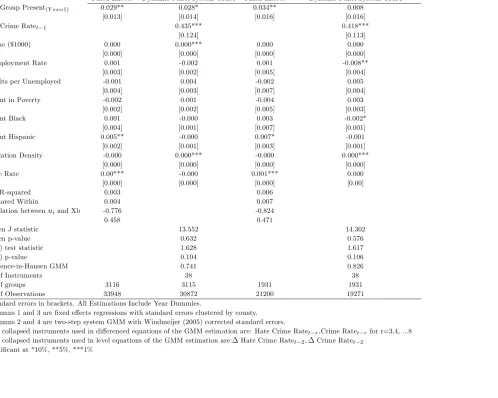
The results of the …xed e¤ects estimation in equation 2 are reported in column one of Table 3.
<<Table 3 here>>
Using the overall sample, the presence of an active white supremacist chap-ter is associated with 286 more hate crimes per 10,000 residents. Given that the average number of hate crimes per 10,000 residents is 1494, the presence of an active white supremacist chapter is associated with an 18.7 percent higher hate crime rate.17 Column 3 displays the same estimation using only those
counties that report one or more hate crimes over the 1997-2007 time frame. The restricted sample reveals that the presence of a chapter is associated with 335 more hate crime per 10,000 residents or an increase of 14.0 percent.18
17Agencies covering multiple counties do not report the county in which a hate crime
took place. Therefore, I also estimate Equation 2 excluding the 5.5 percent of hate crimes reported by agencies covering multiple counties. The estimated coe¢cient on active white supremacist chapters is .029 and signi…cant at the …ve percent level. This corresponds to a 20.2 percent higher hate crime rate.
18The annual average number of hate crimes for counties that submit at least one report
These results suggest the validity of Levin’s (1993) hypothesis that commit-ting an act of violence may enhance members’ image within the group.
Given the annual nature of these data, I perform three tests for autocorre-lation: the Wooldridge Test, the modi…ed Bhargava et al. Durbin-Watson, and the Baltagi-Wu LBI test. The Woodlrigde Test barely fails to reject the null of no autocorrelation.19 The modi…ed Bhargava et al. Durbin-Watson statistic
of 1.78 and the Baltagi-Wu LBI statistic of 1.93 both suggest the presence of …rst-order autocorrelation.20 Because the dependent variable exhibits
…rst-order autocorrelation in two of the three tests, that is, it is dependent on its own past realizations, I use the Arellano-Bover (1995) and Blundell-Bond (1998) System General Method of Moments (GMM) dynamic panel estimator and include a lagged dependent variable as an explanatory variable.
hate crimeit = + hate crimei;t 1+ activeit +xit + i+ t+"it (3)
In this model speci…cation, the lagged hate crime rate is an endogenous variable and the overall crime rate is treated as a predetermined variable. All others variables are treated as exogenous. I address the endogeneity of the one year lag of hate crimes by using internal instruments, namely lagged levels and lagged di¤erence of the hate crime rate and the overall crime rate. This eliminates potential endogeneity and reverse causation. Given the number of instruments, I conduct a Hansen’s J-statistic overidenti…cation test based on the weighted matrix.21 With resulting Hansen J values of 13.628 and 14.698,
and the resulting p-values of 0.626 and 0.547, for the full and restricted sample respectively, I fail to reject the null that these instruments are valid.
Column 2 and 4 in Table 3 reports the estimated results using the two stage System-GMM estimation method.22 For the overall sample, the System-GMM
estimator returns a similar signi…cant relationship between white supremacist hate group presence and a higher hate crime rate: an increase of 18.6 percent. For the restricted sample, the relationship between hate crimes and white supremacist hate groups is imprecisely estimated
7
Further Investigation of Alternative Hypotheses
The results above support the theory that white supremacist chapters increase the hate crime rate. However, the results are also consistent with two
compet-19The Wooldridge test for …rst-level autocorrelation returns an F( 1, 3101) = 4.017 with
a Prob>F = 0.05, just barely failing to reject the null of no autocorrelation.
20For the both the modi…ed Bhargava et al. Durbin-Watson and the Baltagi-Wu LBI
with a large number of cross sections, a test statistic of less than 2 indicates positive serial correlation.
21One di¢culty with Hansen’s J-statistic test is that its size is distorted as the number of
instruments grows. Therefore, instead of generating an additional instrument for each panel, lag, and time, I only use the instruments for each panel and lag. Another overidenti…cation test, the Sargan test is more reliable, but not appropriate if errors are heteroskedastic.
22The Arellano and Bond two stage procedure generates estimates of the standard
ing hypotheses: (1) that the presence of one or more white supremacist groups is a symptom of the overall level of distrust and violent antagonism amongst various citizens in a county and (2) that an increase in expected future hate crime leads to hate group formation for self-defensive purposes. Luckily,Hate
Crime Statistics reports both the type of biased-motivated crime, for
exam-ple anti-black or anti-homosexual, and the race of the perpetrator for each hate crime. To investigate the …rst competing hypothesis I look at whether activity by white supremacist chapters is associated with a higher rate of hate crimes listed as anti-white or hate crimes committed by non-whites. If the relationship is positive, white supremacist activity may proxy for the overall biased-motivated antagonism in a county and not be directly related to white supremacist group activity. Alternatively if white supremacist activity is as-sociated with more hate crimes excluding those listed as anti-white or more hate crimes committed by white perpetrators, the initial hypothesis that hate crimes are caused by white supremacist groups is more plausible.
7.1
Non-anti-white hate crimes and white perpetrators
To disentangle these hypotheses, I …rst repeat the estimations in equations 2 and 3 but replace the dependent variable with the hate crimes, excluding those listed as anti-white.23 As reported in column 1 and 2 of Table 4, I …nd that
the presence of a white supremacist chapter is associated with between 245 to 300 more non-anti-white hate crimes per 10,000 residents or an increase of between 19.7 to 24.1 percent. This is a slightly larger result than those found in Table 3 when looking at all types of hate crime.
However, a portion of these hate crimes are committed by people who are unlikely to be members of white supremacists groups, namely non-whites. To account for this, I estimate the relationship between white supremacist groups and hate crimes committed by whites with non-white victims.24 The
estimates are reported in columns 3 and 4 of Table 4. The presence of a white supremacist chapter is associated with between 136 and 155 more white on non-white hate crimes. Recognizing the smaller number of white-on-non-white hate crimes, this is an increase of between 22.0 and 25.1 percent. In both cases I …nd that the presence of an active white supremacist group is associated with a greater likelihood of non-anti-white hate crimes and hate crimes with non-white victims committed by whites. The percentage increase for these types of hate crimes is greater than the increase estimated for all types of hate crimes shown in Table 3. This suggests that white supremacist chapters play a direct role in hate crime rates.
<<Table 4 here>>
23hate crime(excluding anti-white)
i;t is constructed using the entire county population
in the denominator.
24The variablehate crime(white-on-other)
i;tuses the total population as its denominator
7.2
Anti-white hate crimes and non-white perpetrators
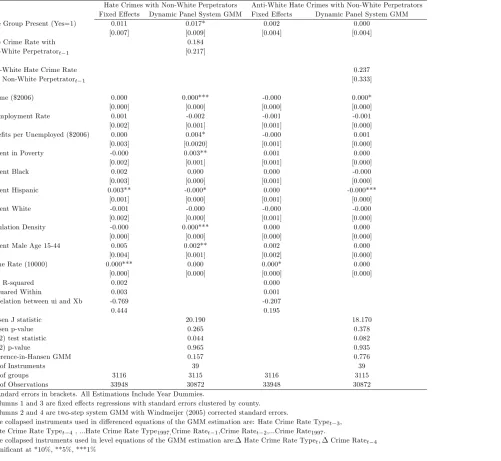
White supremacist group members or those sympathetic to white supremacist organizations are not likely to perpetrate hate crimes classi…ed as anti-white. They are also unlikely to be white. By looking at hate crimes by non-whites and those by non-white listed as anti-white, I am able to di¤erentiate whether or not white supremacist groups are symptomatic of the overall level of antagonism. A positive relationship between these types of hate crimes and white supremacists groups would reject the hypothesis that white suprema-cist groups cause hate crimes. A negative or non-relationship would further support the hypothesis that active white supremacist groups directly increase hate crime rates. I …rst estimate the relationship between white supremacist chapters and hate crimes committed by non-whites by replacing the dependent variable in equation 2 with the rate of hate crimes by non-whites.
The results are reported in columns 1 and 2 in Table 5. The …xed e¤ect estimation shows no statistical relationship between white supremacist groups and hate crimes with non-white perpetrators. However, the System-GMM reports a positive relationship, suggesting that presence of a hate group may be symptomatic of overall antagonism. This results may come about if white supremacist groups in‡ame anti-gay or anti-black, or other biases.
Hate crimes listed as anti-white, however, are unlikely to be perpetrated by white supremacists Therefore, I replace the dependent variable with hate crimes listed as anti-white committed by non-whites. The estimated the re-lationship is reported in columns 3 and 4 in Table 5. Both the …xed e¤ects and the System-GMM reject the hypothesis that white supremacist groups are simply a proxy for violent antagonism.
<<Table 5 here>>
7.3
Protection from future hate crimes
The results in Tables 4 and 5, save for column 2 in Table 5, reject the hypoth-esis that white supremacist groups are symptomatic of overall antagonism in a county. Instead the results suggest that white supremacists are the source of greater hate crime rates. White supremacist chapters may, however, be a response to expected future increases in hate crime activity. Thus the above results may not reveal a causal e¤ect of white supremacist chapters on hate crimes. Rather the estimates may reveal the formation of chapters in antici-pation of future increases in hate crime by non-whites or hate crimes with an anti-white bias.25
To determine whether current changes in hate crimes perpetrated by non-whites is related to past changes in white supremacist activity or lagged changes in hate crimes by non-whites, I estimate Equation 4. Equation 4
25Heckman [2000] mentions that future y
toften determines current xtin a dynamic
estimates whether a change hate crimes committed by non-whites is associ-ated with past changes in the presence of active white supremacist chapters. The regression controls for the lagged changes in hate crimes by non-whites as well.
hate crime(by non-white)it = +P2
r=1 r hate crime(by non-white)i;t r
+P2
r=1 r activei;t r
+xit + t+"it
(4) The results in column 1 of Table 6 show that the coe¢cient estimates of lagged chapter activity are not signi…cant. This reinforces the notion that non-whites do not commit more hate crime when a county witnesses a change in the activity of white supremacist chapters. To test whether chapters form in anticipation of future changes in hate crimes by non-whites, I …rst construct the trichotomous variable activeit where:
activeit = 8
<
:
1if a county is no longer home to an active white supremacist chapter
0if a county realizes no change in the presence or lack of presence of a chapter
1if a county is no longer free of white supremacist activity
9
=
;
(5) I then replace the dependent variable in Equation 4 with, activeit, the change
in the probability an active white supremacist chapter is present, and estimate the ordered logistic using Equation 6.
activeit = + P2
r=1 r hate crime(by non-white)i;t r
+P2
r=1 r activei;t r +xit + t+"it
(6)
Column 2 in Table 6 shows the results. The coe¢cient on hate crimes by non-whites is again not signi…cant, suggesting that current white supremacist activity is not related to past hate crimes committed by non-whites. White supremacist groups do not appear to form for protection from hate crimes committed by non-whites.
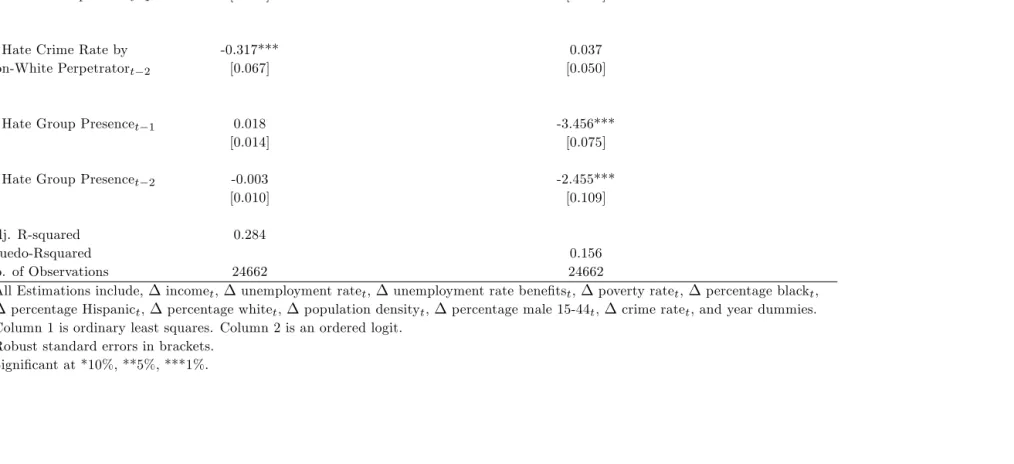
Looking more deeply, however, potential white supremacy members may be less concerned with hate crimes committed by non-whites and more concerned with hate crimes by non-whites that are listed as anti-white. Table 7 repeats the exercise in Table 6 but replaces the dependent variable with anti-white hate crimes committed by non-whites and estimates each of the following two equations:
hate crime(other-on-white)i;t = +P2
r=1 r hate crime(other-on-white)i;t r
+P2
r=1 r activei;t r
+xit + i+"it
(7)
activei;t = + P2
r=1 r hate crime(other-on-white)i;t r
+P2
r=1 r activei;t r +xit + i+"it
I again …nd no relationship. The change in anti-white hate crimes commit-ted by non-whites does not appear relacommit-ted to past changes in white supremacist activity. Neither do white supremacist chapters appear to form to protect their members from anti-white hate crimes.
8
Conclusion
Counties with active white supremacist chapters experience greater rates of hate crime. In particular, hate crimes not listed as anti-white and hate crimes committed by white perpetrators increase by a greater percentage than all types of hate crimes. White supremacists groups do not appear to increase the rate of anti-white hate crime perpetrated by non-whites. These results rejects the possibility that white supremacist groups are symptomatic of changes in the overall level of bias-motivated antagonism. I also reject the protection hypothesis. White supremacist groups do not appear to form to protect against expected future increases in hate crimes by non-whites. Nor do they form to protect against future anti-white crimes perpetrated by non-whites.
Previous research by Ryan and Leeson [2010] …nds no relationship between hate groups and hate crimes. There are several possible reasons why these results di¤er. First, Ryan and Leeson perform their estimation at the state level whereas this analysis is at the county level. If hate groups are a local phenomena, then white supremacist groups are much more likely to direct their frustration at local residents. If a hate group member commits a hate crime, it is likely that they will do so against those whom they feel have directly wronged them such as others in the community. Due to local di¤erences, aggregation may result in lost variation and reduce the estimated e¤ect. Moreover, because the SPLC does not report chapter size, the number of chapters many be a noisy measure of the number of white supremacists.
Second, even if a hate group is not actively seeking to commit crimes, its presence may signal to local community members that a particular bias is acceptable. Non-members may act out against those viewed as inferior by the white supremacists because such views are present in the community. This may partially explain why I …nd a positive relationship between current white supremacist activity and hate crimes by non-white perpetrators, though I do not …nd a relationship when looking at the lagged changes. Spill over e¤ects, if they exist at all, are much more likely to be local in nature and thus lost when aggregating to the state level.
in-cludes scienti…c research institutes, recording studios, religious organizations, rights organizations, and retail outlets . Included in the "Other" category is the Charles Darwin Research Institute (CDRI), "a scienti…c and educa-tional foundation established to honor and extend the scienti…c revolution inaugurated by one of the greatest …gures in the history of human thought" [http://www.charlesdarwinresearch.org, Viewed 11/10/10] and the Family Re-search Institute whose goal is "to generate empirical reRe-search on issues that threaten the traditional family, particularly homosexuality, AIDS, sexual social policy, and drug abuse" [http://www.familyresearchinst.org, Viewed 11/10/10] Although both organizations may hold biased views that may "malign an en-tire class of people," they do not advocate violence. This "Other" category may produce a spill over e¤ect, and increase hate crime, but it is unlikely to occur through direct action of the organization’s members.
White supremacist chapters do not appear to form in response to hate crimes perpetrated by non-whites or hate crimes listed as anti-white. In this re-spect white supremacists groups are unlike gangs, where "violent crime causes an increase in gang membership" [Osoba and Sobel, 2010]. This di¤erence may be a function of how law enforcement agencies address hate crimes and gang crimes. When it comes to hate crimes, agencies may more closely follow Osoba and Sobel’s suggestion that "governments should try harder to protect the rights of individuals who are the victims of violence." This may in part be due to how hate crime legislation attempts to protect the rights of individuals who are victims of bias-based violence.
Further research is needed to determine the source of these con‡icting re-sults. In addition, further queries are required to determine if black separatist organizations, such as the new Black Panthers, and Patriot organizations are positively related to hate crimes in the United States.
Acknowledgement 1 Bene…cial suggestions were received from seminar
par-ticipants at the College of the Holy Cross, Lebanon Valley College, Macon State College, Mercer University, Stonehill College and the Southern Economic As-sociation, and the Association for Private Enterprise Education. I wish to extend my gratitude to Angela K. Dills, Rey Hernandez-Julian, Peter Leeson, Matt Ryan, and Robert Tollison, for their valuable comments and suggestions. Errors or de…ciencies that have to this point survived this counsel are most assuredly mine alone.
References
[1] Anti Defamation League Website. http://www.adl.org/. (Accessed Feb-ruary 4, 2005).
[4] Besci, Z. 1999. "Economics and Crime in the State."Federal Reserve Bank
of Atlanta Economic Review, 38-56.
[5] Boyd, Elizabeth, Richard Berk, and Karl Hamner.1996. "Motivated by Hatred or Prejudice : Categorization of Hate-Motivated Crimes in Two Police Divisions." Law & Society Review, 30(4): 819-850.
[6] Buchanan, James M. 1975. The Limits of Liberty: Between Anarchy and
Leviathan.University of Chicago Press: Chicago, IL.
[7] DiIulio, J. J., Jr. 1996. "Help Wanted: Economists, Crime and Public Policy." The Journal of Economic Perspectivies. 3-24.
[8] Gale, Lewis R., Will C. Heath, and Rand W. Ressler. 2002. "An Economic Analysis of Hate Crime." Eastern Economic Journal 28: 203-15.
[9] Glaeser, Edward L. 2005. "The Political Economy of Hatred,"Quarterly
Journal of Economics. 120(1), 45-86.
[10] Green, Donald P., Jack Glaser, and Andrew Rich. 1998. "From Lynching to Gay-Bashing: The Elusive Connection Between Economic Conditions and Hate Crime."Journal of Personality and Social Psychology, 75, 82-92. [11] Grove, W.R., M. Hughes, and M. Geerken. 1985. "Are Uniform Crime Reports a Valid Indicator of Index Crimes? An A¢rmative Answer with Minor Quali…cations." Criminology, 451-501.
[12] Iannaccone, Laurence R. 1992. "Sacri…ce and Stigma: Reducing Free-riding in Cults, Communes, and Other Collectives," Journal of Political
Economy, 100(2), 271-291.
[13] Jacobs, James and Kimberly Potter, 1998. Hate Crimes: Criminal Law
and Identity Politics, New York: Oxford University Press.
[14] Je¤erson, Philip N, and Frederic L. Pryor, 1999. "On the Geography of Hate," Economics Letters, 65(3), 389-395.
[15] Jenness, Valerie and Ryken Grattet. 2001. Making Hate a Crime: From
Social Movement to Law Enforcement. New York: Russell Sage
Founda-tion.
[16] Katz, Jack, 1976. Gay American History: Lesbians and Gay Men in the
U.S.A. New York: Thomas Y. Crowell.
[17] Kleg, Milton. 1993. Hate Prejudice and Racism. (The State of New York: Albany Press).
[18] Klein, M. W. 1995.The American street gang: Its nature, prevalence and
control. New York: Oxford Univerity Press.
[19] Krouse, William J. 2007. “CRS Report for Congress: Hate Crime Legis-lation.”
[20] Levin, Brian. 1993. "A Dream Deferred: the Social and Legal Implications of Hate Crimes in the 1990s". The Journal of Intergroup Relations, vol. xx, no. 3, Fall.
[21] Maroney, Terry. A., 1998. "The Struggle Against Hate Crime: Movement at a Crossroads." New York University Law Review, 73(2): 564-620. [22] Martin, Susan. 1995. "A Cross-Burning is Not Just an Arson: Police
[23] Martin, Susan. 1996. "Investigating Hate Crimes: Case Characteristics and Law Enforcement Responses." Justice Quarterly 13(3): 455-480. [24] McDevitt, Jack. and Jack Levin. 1993. "Hate Crimes: The Rising Tide of
Bigotry and Bloodshed". 9-19.
[25] Medo¤, Marshall. 1999. "Allocation of Time and Hateful Behavior: A Theoretical Analysis of Hate and Hate Crimes." American Journal of
Economics and Sociology 58: 959-973.
[26] Nozick, Robert. 1974. Anarchy, State, and Utopia. Basic Books: New York, NY.
[27] Phillips, Scott and Ryken Grattet. 2000. "Judicial Rhetoric, Meaning-Making, and the Institutionalization of Hate Crime Laws."Law & Society
Review 34(3): 567-602.
[28] Rogers, W. H. 1993. Regression standard errors in clustered samples.
Stata Technical Bulletin 13: 19–23. Reprinted inStata Technical Bulletin
Reprints, vol. 3, 88–94.
[29] Ryan, Matt E., and Peter T. Leeson. 2010. "Hate Groups and Hate Crimes". Working Paper.
[30] Sobel, Russell S. and Brian J. Osoba. 2009. "Youth Gangs as Pseudo-Governments: Implications for Violent Crime,"Southern Economic Jour-nal 75:4, pp. 996-1018.
[31] Southern Poverty Law Center Website: http://www.splcenter.org/. (Ac-cessed 07/18/08).
[32] The Southern Poverty Law Center. 1998. "474 Hate Groups Blanket America."Intelligence Report. Issue 89.
[33] ____________. 1999. "Hate Groups Top 500."Intelligence Report.
Issue 93.
[34] ____________. 2000. "The Decade in Review."Intelligence Report.
Issue 97.
[35] ____________. 2001. "Blood on the Border." Intelligence Report.
Issue 101.
[36] ____________. 2002. "The Year in Hate." Intelligence Report. Is-sue 105.
[37] ____________. 2003. "Hate Takes a Hit."Intelligence Report.Issue 109.
[38] ____________. 2004. "Age of Rage."Intelligence Report.Issue 114. [39] ____________. 2005. "Holy War". Intelligence Report. Issue 117. [40] ____________. 2006. "The Year in Hate". Intelligence Report.
Is-sue 121.
[41] ____________. 2007. "The Year in Hate". Intelligence Report. Is-sue 125.
[42] ____________. 2008. "The Year in Hate". Intelligence Report. Is-sue 129.
[43] The Stephen Roth Institute. 2004.For The Study of Contemporary Anti-semitism and Racism Annual Report United States 2004.
ENFORCE-MENT AGENCY IDENTIFIERS CROSSWALK [UNITED STATES], 1996 [Computer …le]. ICPSR ed. Ann Arbor, MI: Inter-university Consor-tium for Political and Social Research [producer and distributor], 2000. doi:10.3886/ICPSR02876
[45] United States Census. 1992 Census of Government. Volume 4. Govern-ment Finances. Number 5, Compendium of GovernGovern-ment Finances
[46] ____________. 1997 Census of Government. Volume 4. Govern-ment Finances. Compendium of GovernGovern-ment Finances.
[47] Weed, Frank, 1995. Certainty of Justice: Refonn in the Crime victim
Movement. New York,NY: Aldine De Gruyter.
[48] Williams, R. L. 2000. A note on robust variance estimation for cluster-correlated data. Biometrics 56: 645–646.
[49] Windmeijer, Frank, 2005. "A …nite sample correction for the variance of linear e¢cient two-step GMM estimators," Journal of Econometrics, 126(1), 25-51.
[50] Wooldridge, J. M. 2002.Econometric Analysis of Cross Section and Panel Data. Cambridge, MA: MIT Press.
A
Data Appendix
crimedata comes from the U.S. Dept. of Justice, Federal Bureau of
Investiga-tion. Uniform Crime Reporting Program Data: County-Level Detailed Arrest And O¤ense Data, 1997 -2007. Ann Arbor, MI: Inter-university Consortium for Political and Social Research (Retrieved 5/20/2006 & 10/20/10).
1997-2007. (Retrieved June 20, 2006), from the University of Virginia,
Geospatial and Statistical Data Center: http://…sher.lib.virginia.edu/collections/stats/crime/.
income is the median household income in thousands ($1000s) of 2006
dollars by county as reported by the U.S. Census Bureau, "State and County Income and Poverty Estimates (SAIPE) from 1997 through 2007. http:// www.census.gov/hhes/www/saipe/county.html. Viewed (10/20/10).
unemployment rate is the annual average percent of county residents
who are unemployed and looking for a job as reported by the United States De-partment of Labor: Bureau of Labor Statistics. Labor Force Data by County, Annual Averages (Viewed (07/10/10):
poverty is the portion of a county’s residents that are below a household income threshold as reported by the U.S. Census Bureau, "State and County Income and Poverty Estimates (SAIPE) from 1997 through 2007. http:// www.census.gov/hhes/www/saipe/county.html. Viewed (07/10/08).
adult male is the percentage of the county population that is male and
between the ages of 15 and 44. U.S. Census Bureau, Population Division: County estimates by demographic characteristics - age, sex, race, and Hispanic Origin. http://www.census.gov/popest/datasets.html (Viewed 7/15/08) U.S. Census Bureau, Population Division:
adult female is the percentage of the county population that is female
and between the ages of 15 and 44. U.S. Census Bureau, Population Division: County estimates by demographic characteristics - age, sex, race, and Hispanic Origin. http://www.census.gov/popest/datasets.html (Viewed 7/15/08)
male youthis the percentage of the county population that is male and
be-tween the ages of 5 to 14 (1997 - 1999) or 5 to 13 (2000 - 2005) U.S. Census Bureau, Population Division: County estimates by demographic characteristics -age, sex, race, and Hispanic Origin. http:// www.census.gov/popest/datasets.html (Viewed 7/15/08)
female youthis the percentage of the county population that is female and
between the ages of 5 to 14 (1997 - 1999) or 5 to 13 (2000 - 2005). U.S. Census Bureau, Population Division: County estimates by demographic
characteris-tics - age, sex, race, and Hispanic Origin. http:// www.census.gov/popest/datasets.html (Viewed 7/15/08)
blackis the percentage of county population that is black. U.S. Census
Bureau, Population Division: County estimates by demographic characteristics -age, sex, race, and Hispanic Origin. http:// www.census.gov/popest/datasets.html (Viewed 7/15/08)
hispanicis the percentage of the county population that is Hispanic. U.S.
Census Bureau, Population Division: County estimates by demographic
char-acteristics - age, sex, race, and Hispanic Origin. http:// www.census.gov/popest/datasets.html (Viewed 7/15/08)
msais the Metropolitan Statistical Area reported by the Population
Divi-sion, U.S. Census Bureau in 1999 and updated in 2003: http:// www.census.gov/population/estimate city/99m…ps.txt (Viewed 1/29/2007).
population densityis calculated from the county population in U.S.
Cen-sus Bureau, Population Division: County estimates by demographic charac-teristics - age, sex, race, and Hispanic Origin, (Viewed 7/15/08) divided by the land area in square miles from the U.S. Census Bureau (Viewed 1/29/2007).
hate group total is the total number of hate group chapters active in
a county. This variable is the sum of all Ku Klux Klan, Neo-Nazi, Racist Skinheads, and Christian Identity Chapters active at the county level. These data are reported annually at the city level by the Southern Poverty Law Center in their quarterly publication the Intelligence Report. Each annual report reports activity for the previous year.
Center. Issue 89.
- 1999. "Hate Groups Top 500." The Southern Poverty Law Center. Issue 93.
- 2000. "The Decade in Review." The Southern Poverty Law Center. Issue 97.
- 2001. "Blood on the Border." The Southern Poverty Law Center. Issue 101
- 2002. "The Year in Hate." The Southern Poverty Law Center. Issue 105. - 2003. "Hate Takes a Hit." The Southern Poverty Law Center. Issue 109. - 2004. "Age of Rage." The Southern Poverty Law Center. Issue 114. - 2005. "Holy War". The Southern Poverty Law Center. Issue 117
- 2006. "The Year in Hate". The Southern Poverty Law Center. Issue 121. - 2007. "The Year in Hate". The Southern Poverty Law Center. Issue 125. - 2008. "The Year in Hate". The Southern Poverty Law Center. Issue 129.
kkk is the total number of Ku Klux Klan Chapters active in a county. These data are reported annually at the city level by the Southern Poverty Law Center in their quarterly publication the Intelligence Report, Issues 85, 89, 93, 97, 101, 105, 109, 114, 117, 121, 125, 129.
nazi is the number of Neo-Nazi chapters active in county. These data are reported annually at the city level by the Southern Poverty Law Center in their quarterly publication the Intelligence Report, Issues 85, 89, 93, 97, 101, 105, 109, 114, 117, 121, 125, 129.
skinheads is the number of racists skinhead chapters active in a county.
These data are reported annually at the city level by the Southern Poverty Law Center in their quarterly publication the Intelligence Report, Issues 85, 89, 93, 97, 101, 105, 109, 114, 117, 121, 125, 129.
identity is the number of Christian Identity Churches active in a county
.These data are reported annually at the city level by the Southern Poverty Law Center in their quarterly publication the Intelligence Report, Issues 85, 89, 93, 97, 101, 105, 109, 114, 117, 121, 125, 129.
consumer price index is from the United States Department of Labor:
Bureau of Labor Statistics: Consumer Price Index. Washington, D.C. ftp:// ftp.bls.gov/pub/special.requests/cpi/cpiai.txt (viewed 7/10/08)
hate crime data come from the United States Department of Justice.
Figure 2: Maximum Hate Crime Rate in a Given Year: 1997 - 2007
Figure 3: Maximum Annual Number of Active Hate Group Chapters Present In Between 1997 and 2007
Figure 4: Change in Hate Group Presence From 1997 Through 2007
Table 1: Hate Group Characteristics
Movement Ku Klux Klan neo-Nazi Racist Skinheads Christian Identity
Year Established 1866 1913 1970s 1940s
Estimated Membership 6,000 6,000 20,000-50,000
Prohibitions/Sacri…ce
Clothing Scar Race Ethnic Religious
Sexual
No No Yes Yes Yes Yes
Yes Yes Yes Yes Yes Yes
Yes Yes Yes Yes Yes Yes
No No Yes Yes Yes Yes
Membership Bene…ts Mutual Insurance
Mutual Insurance Educational Services
Safety
Mutual Insurance Safety
Mutual Insurance Educational Services
Safety Sources: Anti-Defamation Leage, Southern Poverty Law Center, Kleg (1993)
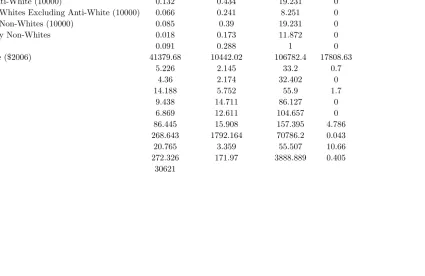
Table 2: Summary Statistics
Mean Standard Deviation Maximum Minimum
Number of Hate Crimes 2.877 18.261 925 0
Hate Crime Rate (10000) 0.16 0.58 37.443 0
Hate Crime Rate Excluding Anti-White (10000) 0.132 0.434 19.231 0
Hate Crime Rate Comitted by Whites Excluding Anti-White (10000) 0.066 0.241 8.251 0
Hate Crime Rate Comitted by Non-Whites (10000) 0.085 0.39 19.231 0
Anti-White Hate Crime Rate by Non-Whites 0.018 0.173 11.872 0
Hate Group Present (Yes=1) 0.091 0.288 1 0
Real Median Household Income ($2006) 41379.68 10442.02 106782.4 17808.63
Unemployment Rate 5.226 2.145 33.2 0.7
Bene…ts per Unemployed 4.36 2.174 32.402 0
Percent in Poverty 14.188 5.752 55.9 1.7
Percent Black 9.438 14.711 86.127 0
Percent Hispanic 6.869 12.611 104.657 0
Percent White 86.445 15.908 157.395 4.786
Population Density 268.643 1792.164 70786.2 0.043
Percentage Male Age 15-44 20.765 3.359 55.507 10.66
Crime Rate (10000) 272.326 171.97 3888.889 0.405
N 30621
Table 3: Hate Crime Rate 1997 - 2007: All Counties and Only Those Reporting At Least One Hate Crime
All Counties Counties Reporting At Least One Hate Crime Fixed E¤ects Dynamic Panel System GMM Fixed E¤ects Dynamic Panel System GMM Hate Group Present(Ye =1) 0.029
* * 0.028* 0.034* * 0.008 [0.013] [0.014] [0.016] [0.016] Hate Crime Ratet 1 0.435* * * 0.418* * *
[0.124] [0.113]
Income ($1000) 0.000 0.000* * * 0.000 0.000 [0.000] [0.000] [0.000] [0.000] Unemployment Rate 0.001 -0.002 0.001 -0.008* * [0.003] [0.002] [0.005] [0.004] Bene…ts per Unemployed -0.001 0.004 -0.002 0.005
[0.004] [0.003] [0.007] [0.004] Percent in Poverty -0.002 0.001 -0.004 0.003
[0.002] [0.002] [0.005] [0.003] Percent Black 0.001 -0.000 0.003 -0.002*
[0.004] [0.001] [0.007] [0.001] Percent Hispanic 0.005* * -0.000 0.007* -0.001 [0.002] [0.001] [0.003] [0.001] Population Density -0.000 0.000* * * -0.000 0.000* * * [0.000] [0.000] [0.000] [0.000] Crime Rate 0.00* * * -0.000 0.001* * * 0.000
[0.000] [0.000] [0.000] [0.00]
Adj. R-squared 0.003 0.006
R-squared Within 0.004 0.007
Correlation betweenu iandX b -0.776 -0.824
Rho 0.458 0.471
Hansen J statistic 13.552 14.302
Hansen p-value 0.632 0.576
AR(2) test statistic 1.628 1.617
AR(2) p-value 0.104 0.106
Di¤erence-in-Hansen GMM 0.741 0.826
No. of Instruments 38 38
No. of groups 3116 3115 1931 1931
No. of Observations 33948 30872 21200 19271 Standard errors in brackets. All Estimations Include Year Dummies.
Columns 1 and 3 are …xed e¤ects regressions with standard errors clustered by county.
Columns 2 and 4 are two-step system GMM with Windmeijer (2005) corrected standard errors.
The collapsed instruments used in di¤erenced equations of the GMM estimation are: Hate Crime Ratet r
;Crime Ratet
r for r=3,4, ...8 The collapsed instruments used in level equations of the GMM estimation are: Hate Crime Ratet 2; Crime Ratet 2
Signi…cant at 10 , 5 , 1
Table 4: Hate Crime Rate Excluding Anti-White and Hate Crime Rate with White Perpetrator with Non-White Victim
Hate Crime Excluding Anti-White White Perpetrator with Non-White Victim Fixed E¤ects Dynamic Panel System GMM Fixed E¤ects Dynamic Panel System GMM Hate Group Present (Yes=1) 0.025 0.030 0.016 0.014
[0.011] [0.010] [0.009] [0.008] Excluding Anti-White Ratet 1 0.196
[0.140]
White Perpetrator with -0.182
Non-White Victim Ratet 1 [0.234]
Income ($2006) 0.000 0.000 0.000 0.000 [0.000] [0.000] [0.000] [0.000] Unemployment Rate 0.001 -0.001 -0.000 -0.000 [0.0020] [0.002] [0.001] [0.001] Bene…ts per Unemployed ($2006) -0.001 0.005 -0.001 0.004 [0.003] [0.002] [0.002] [0.002] Percent in Poverty -0.002 0.003 -0.001 0.001
[0.002] [0.002] [0.001] [0.001] Percent Black 0.002 -0.001 0.001 -0.001 [0.002] [0.000] [0.001] [0.00] Percent Hispanic 0.004 -0.001 0.001 -0.000 [0.002] [0.000] [0.001] [0.000] Population Density -0.000 0.000 -0.000 0.000
[0.000] [0.000] [0.000] [0.000] Crime Rate (10000) 0.000 0.000 0.000 0.000
[0.000] [0.000] [0.000] [0.000]
Adj. R-squared 0.005 0.003
R-squared Within 0.005 0.003
Correlation between ui and b -0.839 -0.710
Rho 0.557 0.359
Hansen J statistic 16.499 20.251
Hansen p-value 0.419 0.209
AR(2) test statistic 0.964 -0.552
AR(2) p-value 0.335 0.581
Di¤erence-in-Hansen GMM 0.787 0.509
No. of Instruments 38 38
No. of groups 3116 3115 3116 3115
No. of Observations 33948 30872 33948 30872 Standard errors in brackets. All Estimations Include Year Dummies.
Columns 1 and 3 are …xed e¤ects regressions with standard errors clustered by county.
Columns 2 and 4 are two-step system GMM with Windmeijer (2005) corrected standard errors.
The collapsed instruments used in di¤erenced equations of the GMM estimation are: Hate Crime Rate Typet 4,
Hate Crime Rate Typet 5, ...Hate Crime Rate Type1997;Crime Ratet 1,Crime Ratet 2,...Crime Rate1997.
Table 5: Hate Crimes Committed by Non-Whites and Hate Crimes Commotted by Non-Whites Listed as Anti-White
Hate Crimes with Non-White Perpetrators Anti-White Hate Crimes with Non-White Perpetrators Fixed E¤ects Dynamic Panel System GMM Fixed E¤ects Dynamic Panel System GMM Hate Group Present (Yes=1) 0.011 0.017 0.002 0.000
[0.007] [0.009] [0.004] [0.004] Hate Crime Rate with 0.184
Non-White Perpetratort 1 [0.217]
Anti-White Hate Crime Rate 0.237
with Non-White Perpetratort 1 [0.333]
Income ($2006) 0.000 0.000 -0.000 0.000 [0.000] [0.000] [0.000] [0.000] Unemployment Rate 0.001 -0.002 -0.001 -0.001 [0.002] [0.001] [0.001] [0.000] Bene…ts per Unemployed ($2006) 0.000 0.004 -0.000 0.001
[0.003] [0.0020] [0.001] [0.000] Percent in Poverty -0.000 0.003 0.001 0.000
[0.002] [0.001] [0.001] [0.000]
Percent Black 0.002 0.000 0.000 -0.000
[0.003] [0.000] [0.001] [0.000] Percent Hispanic 0.003 -0.000 0.000 -0.000 [0.001] [0.000] [0.001] [0.000] Percent White -0.001 -0.000 -0.000 -0.000 [0.002] [0.000] [0.001] [0.000] Population Density -0.000 0.000 0.000 0.000
[0.000] [0.000] [0.000] [0.000] Percent Male Age 15-44 0.005 0.002 0.002 0.000
[0.004] [0.001] [0.002] [0.000] Crime Rate (10000) 0.000 0.000 0.000 0.000
[0.000] [0.000] [0.000] [0.000]
Adj. R-squared 0.002 0.000
R-squared Within 0.003 0.001
Correlation between ui and b -0.769 -0.207
Rho 0.444 0.195
Hansen J statistic 20.190 18.170
Hansen p-value 0.265 0.378
AR(2) test statistic 0.044 0.082
AR(2) p-value 0.965 0.935
Di¤erence-in-Hansen GMM 0.157 0.776
No. of Instruments 39 39
No. of groups 3116 3115 3116 3115
No. of Observations 33948 30872 33948 30872 Standard errors in brackets. All Estimations Include Year Dummies.
Columns 1 and 3 are …xed e¤ects regressions with standard errors clustered by county.
Columns 2 and 4 are two-step system GMM with Windmeijer (2005) corrected standard errors.
The collapsed instruments used in di¤erenced equations of the GMM estimation are: Hate Crime Rate Typet 3,
Hate Crime Rate Typet 4, ...Hate Crime Rate Type1997;Crime Ratet 1,Crime Ratet 2,...Crime Rate1997.
Table 6: Expected Future Hate Crimes Committed by Non-Whites and Hate Group Activity
Hate Crime Rate by Hate Group Presencet Non-White Perpetratort
Hate Crime Rate by -0.576 0.003 Non-White Perpetratort 1 [0.071] [0.052]
Hate Crime Rate by -0.317 0.037 Non-White Perpetratort 2 [0.067] [0.050]
Hate Group Presencet 1 0.018 -3.456
[0.014] [0.075]
Hate Group Presencet 2 -0.003 -2.455
[0.010] [0.109]
Adj. R-squared 0.284
Psuedo-Rsquared 0.156
No. of Observations 24662 24662
All Estimations include, incomet, unemployment ratet, unemployment rate bene…tst, poverty ratet, percentage blackt,
percentage Hispanict, percentage whitet, population densityt, percentage male 15-44t, crime ratet, and year dummies. Column 1 is ordinary least squares. Column 2 is an ordered logit.
Robust standard errors in brackets. Signi…cant at 10 , 5 , 1 .
Table 7: Expected Future Hate Crimes Committed by Non-Whites Listed as Anti-White and Hate Group Activity
Anti-White Hate Crime Rate Hate Group Presencet by Non-White Perpetratort
Anti-White Hate Crime Rate -0.594 0.083 by Non-White Perpetratort 1 [0.118] [0.126]
Anti-White Hate Crime Rate -0.331 -0.030 by Non-White Perpetratort 2 [0.101] [0.096]
Hate Group Presencet 1 0.010 -3.455
[0.009] [0.075]
Hate Group Presencet 2 -0.001 -2.456
[0.006] [0.109]
Adj. R-squared 0.296
Psuedo-Rsquared 0.156
No. of Observations 24662 24662
All Estimations include, incomet, unemployment ratet, unemployment rate bene…tst, poverty ratet, percentage blackt,
percentage Hispanict, percentage whitet, population densityt, percentage male 15-44t, crime ratet, and year dummies. Column 1 is ordinary least squares. Column 2 is an ordered logit.
Robust standard errors in brackets. Signi…cant at 10 , 5 , 1 .