Munich Personal RePEc Archive
Financial Reforms and Banking
Efficiency: Case of Pakistan
Ahmad, Usman
PIDE
6 March 2011
Online at
https://mpra.ub.uni-muenchen.de/34220/
1
Financial Reforms and Banking Efficiency: Case of Pakistan
Usman Ahmad1
Abstract
This paper attempts to analyze the performance of the banking sector of Pakistan in the
light of second generation reforms on the domestic scheduled banks by using data from 1990 to
2008. For this purpose I used Non Parametric Data Envelopment Analysis (DEA). The analysis
revealed an overall improvement in the efficiency of commercial banks. It implies that financial
sector reforms, particularly the second phase of reforms, improved the efficiency of the
commercial bank in Pakistan. After the reforms, pure technical efficiency increased as compared
to scale efficiency and it was found that the overall efficiency of the industry has increased due
to pure technical efficiency. The study concludes that the reforms were successful in improving
the efficiency of the domestic commercial banks in Pakistan.
1. Introduction
Financial sector plays a formidable role in the economic development. A very close
relationship exists between financial sector growth and economic growth. An efficient financial
sector is necessary for the optimal use of financial resources of the country. Economic
development can be achieved by using existing resources more abundantly without any change
in the production process or by combining already employed resources in a better way (Saeed,
2005).
Pakistan's financial sector consists of commercial banks, foreign banks, development
finance institutions, micro finance companies (leasing companies, investment banks, discount
houses, housing finance companies, venture capital companies, and mutual funds), modarabas,
stock exchanges and insurance companies.
After Nationalization during 70’s the banking sector in Pakistan dominated by government owned institutions which are inefficient (Haque, 1997). The main problems faced by
the sector was: that most of the financial assets was owned by Nationalized Commercial Banks
(NCBs) which suffered from a highly bureaucratic approach, overstaffing, unprofitable branches,
1
2
poor customer services, and a high ratio of non-performing loans. The banking industry faces
high taxes, which affect its profitability and attractiveness for new entrants; and the banks are
typically focused on trade and corporate financing with a narrow range of products. They have
not diversified into consumer and mortgage financing (Haque, 1997 and Limmi, 2001).
Given the state of the banking sector, the Government of Pakistan initiated the
macroeconomic and financial sector restructuring program under the guidance of the
International Monetary Fund (IMF) in 1996. The World Bank and Japanese Government also
co-financed the banking sector adjustment loan (BSAL) to support this effort of the government.
The main goal of the program was to improve the efficiency in financial markets through
separating ownership and management, and strengthening the accountability mechanism.
Following the agreement and guidelines provided by the donors in the program, the
Government of Pakistan and State Bank of Pakistan has taken different steps and initiated a
numerous reforms. The reform program can be divided into two phases. The first phase began in
1997, and reforms in this era were related to the recovery of non-performing loans, retrenchment of
surplus staff, closure of over-extended branches, privatization of banks, the introduction of
international accounting standards, strengthening of prudential regulations, and the establishment
of banking courts. When the reforms slowed down somewhat in 1999, the Government of Pakistan
requested the World Bank in 2000 to help revive its implementation program, focusing on bank
privatization as the next critical step in the process. Therefore, the World Bank continued to
support this structural adjustment program in the banking sector, and approved a US$300 million
credit for the Pakistan Banking Sector Restructuring and Privatization Project.
The second generation banking reforms project focused on reducing the cost structure of
the state-owned banks for the sake of efficiency and to facilitate their sale, complete privatization
of partially privatized banks, liberalizing bank branching policy, reduction in taxes on banks,
facilitating loan collateral foreclosure, integration of national savings schemes to the financial
markets, discontinuing the mandatory placement of foreign currency deposits by the commercial
banks, and strengthening the central bank to play a more effective role as a regulator of the banking
sector.
3
world. For example, Akhigbe and McNulty (2003) investigated the profit efficiency of small US
commercial banks, Dogan and Fausten (2002) analyzed the productivity growth in Malaysian
banking, Sathye (2001) empirically investigated the X-efficiency both technical and allocative
in Australian banks, Batttese et al (2000) studied the effect of the deregulation on the Swedish
banking industry, Avikran (2000) investigated the productivity of four major trading banks and
six regional banks in Australia, Laeven (1999) used DEA to estimate the efficiencies of the
commercial banks in Indonesia, Korea, Malaysia, Philippines and Thailand, Berger and Hannan
(1998) also in part examine the U.S. bank efficiency, Battese, Heshmati and Hjalmarsson (1998)
examine the efficiency of labor utilization in the Swedish banking industry and Berger, Leusner
and Mingo (1997) investigate the branch efficiency of U.S. commercial banks.
However, there are few studies discussing the efficiency and economies of scale in the
banking sector of Pakistan. For example, Akhter (2002) estimated the efficiencies of commercial
banks in Pakistan using cross section data for 1998. Hardy and Patti (2001 and 2003) studied the effects of financial reforms on Pakistan’s banking sector for the period 1981-1997. Rizivi (2001) analyzed the productivity of banking sector in Pakistan for the period 1993-1998. Burki and
Niazi (2003) investigated the impact of policy reforms on performance of commercial banks
with a unique panel data from Pakistan’s banking sector over the period 1991– 2000. Qayyum
(2007) investigated the banking efficiency over the period 991-2005. Ahmad (2009) calculated
the total factor productivity (TFP) of Pakistani banks by using data for the period 1991-2005.
These studies used the data for 2005 and/or earlier years and do not capture the impact of
recent financial reforms on the banking efficiency of Pakistan. Therefore, there is a need for a
comprehensive assessment of the impact of financial sector reforms. We attempt to assess
whether the efficiency of the banking sector improved or not during the period of second
generation reforms by using the data from 1990 to 2008. The study period were divided into
three periods, pre- reform period (1991-1997), First Phase of Reforms (1998-2001) and Second
Phase of Reforms (2002-2005 & 2008). The next section provides an overview of the status of
banking and reforms in Pakistan, Section Three elaborates the methodology and the Fourth
4 2. Banking in Pakistan
Financial sector of Pakistan consists of central bank, commercial banks, specialized
financial institutions, insurance companies, stock exchanges and development finance
institutions. However, commercial banks are most important component and play a crucial role
in the financing of economy.Commercial banks mobilize the savings and thus play a vital role in
enhancing the productive capacity of the economy. Habib Bank, the first Muslim owned bank,
was established in Bombay (Mumbai) in 1941. After independence, on 1st July 1948 the State
Bank of Pakistan (SBP), the central bank, was established. The SBP was jointly owned by the
government and the private sector. In the following years, the government set up a fully state
owned bank, namely the National Bank of Pakistan, to assume commercial banking functions
and to carry out treasury tasks.
In 1990, there were three supervisory/regulatory bodies for the financial sector: (1) The
SBP dispensing its functions under the SBP Act, 1956, (2) The Pakistan Banking Council (PBC),
monitoring the performance of nationalized commercial banks under the Banks (Nationalization)
Act, 1974, and (3) the Corporate Law Authority (CLA), regulating the equity market under the
[image:5.612.80.539.443.619.2]Securities and Exchange Ordinance, 1969.
Table 1: Private and Foreign Scheduled Banks Established In 1991
Metropolitan Bank Limited, Bank AI-Habib Limited Faysal Bank Limited Bank of Punjab
Mehran Bank Limited Union Bank Limited
Askari Commercial Bank Limited Prime Commercial Bank Limited Republic Bank Limited. Capital Bank Limited
Schon Bank Limited, Habib Credit & Exchange Bank Limited Prudential Commercial Bank Limited Platinum Commercial Bank Limited Bank of Khyber Trust Bank Limited
Soneri Bank Limited Bank AI-Falah Limited Indus Bank Limited Oman International Bank Bolan Bank Limited, Gulf Commercial Bank Limited Bank of Ceylon
Source: FSA 1990-2000
In order to encourage private sector participation, enhance efficiency and promote
competition among banks, the Banks (Nationalization) Act, 1974 was amended during 1991,
allowing the private sector to open banking companies. Subsequently, in August 1991, ten new
5
end 1994, a number of commercial banks and non-banking financial companies (NBFCs) were
given authorization/licenses to commence business.
The privatization process started by selling, 26% shares of the Muslim Commercial Bank
(MCB) to the private sector in April 1991. By January 1993, a further 49% of shares of MCB
were disinvested to the transfer of its management and control to the buyer. In September 1991,
26% of the shares of Allied Bank Limited (ABL) were also disinvested under the Employee
Stock Ownership Plan and the management and control of the bank was handed over to the
Employee Management Group. A further 25% of shares of ABL were sold to the private sector
in August 1993. In the same year, the government decided to sell 26% of the shares of United
Bank Limited (UBL) and transfer its management to the private sector. Initial attempts to
privatize UBL failed because of various technical reasons. Privatization of NCBs was a key
element in the government agenda.
In November 1993, the SBP directed banks to set quarterly recovery targets, submit
progress reports, and form strategies to improve their future recovery process. In August 1997,
the SBP revised the disclosure standards and banks were asked to submit their annual accounts
on new formats in line with international accounting practices. At the same time, a system was
put in place whereby the performance of each bank and Nonbank Financial Institutions (NBFI)
was evaluated under CAMELS (C-Capital adequacy, A-Asset quality, M-Management quality,
E-Earnings, L-Liquidity and S - Sensitivity to Market Risk) which involves the analysis of six
indicators which reflects the financial health of financial institutions: Capital Adequacy, Asset
Quality, Management Quality, Earnings, Liquidity and Sensitivity to Market Risk, and Systems
and Controls and CAELS (Capital Adequacy, Asset Quality, Earnings, Liquidity and Sensitivity)
During 1996-97, amendments were made in the Banking Companies Ordinance 1962 and
the State Bank of Pakistan Act 1956. The government continues the program of reforms. These
reforms are: first, the Pakistan Banking Council was abolished and its functions are bounded to
the SBP. The State Bank of Pakistan is now expected to monitor and oversee the workings of the
banking sector in the country. Second, the State Bank of Pakistan Act, 1956 has been amended
whereby full and exclusive authority has been given by the Government of Pakistan to the State
6
on government borrowing from the State Bank. Third, all appointments and removals of Chief
Executives and Board of Nationalized Commercial Banks and Development Financial
Institutions are now required to be made with the approval of the State Bank of Pakistan. Fourth,
The Banking Tribunal Ordinance, 1984 and the Banking Companies (Recovery of Loans)
Ordinance, 1997 were repealed and these were replaced by Banking Companies (Recovery of
Loans and Advances, Credit and Finance) in October 1997.
In 2001, the SBP was divided into three parts: the SBP, as Central Bank, SBP Banking
Services Corporation, and National Institute of Banking and Finance (NIBAF). The Securities
and Exchange Commission of Pakistan (SECP) replaced CLA (Corporate Law Authority) as an
independent regulatory body for the capital market. Implementation of the Basel II regime of
minimum capital adequacy will continue and the regime was introduced at the beginning of 2008
with the obligatory application of the Standardized Approach to credit risk and the Basic
Indicator Approach to operational risk for all commercial banks. This followed a year (2007) in
which all banks had been required to run the new regime in parallel with the old Basel I regime.
Banks already have made major advances in implementing the new framework although many
are still facing challenges in areas like integrated risk management policy and collateral
management.
Deposit base rose to Rs 4.1 trillion and gross advances to Rs 3.3 trillion by September 2008. Supported by the growing financial intermediation process, banks’ aggregate profitability rose from Rs 63.3 billion in 2005 to Rs 73.3 billion by 2007 and Rs 46.0 billion for half year
2008. In September 2008, the 4 largest banks accounting for 58% of all branches but only 47%
of the total deposits generated 78% of all profits in the banking sector Recapitalization and prudent lending has lowered banks’ net non-performing loans (NPLs) to around 2.0 percent. Banks’ capitalization and quality of assets have helped raise the risk weighted capital adequacy ratio to 12.1 percent, well above the regulatory minimum of 8.0 percent. Among different
segments of the financial sector, the banking sector has grown most in relative terms.
Following its privatization, which started in the 1990s, the banking sector has gained
dynamism and financial strength. As of June 30, 2008, the deposit base has risen to Rs. 4.1
trillion and advances (net of provisions) to Rs. 2.9 trillion. Supported by the growing financial
7
first half year 2008), the proportion of non-performing loans gauged according to Net NPL to
Net Loans ratio has been well contained and was 1.1 by December 2007 and 1.3 in June 2008.
The overall assets of the banking sector have also increased from Rs. 3.6 trillion in December
2005 to Rs. 5.5 trillion by June 2008. While some liquidity strain has been witnessed in the
second half of 2008, the sector stands on sound footing with regard to its ability to face market
shocks. The GOP’s Medium Term Development Framework for 2005-10 conservatively
estimates that USD 150 billion (Rs. 12.0 trillion) will be required for such investments over the
period it covers.
The formal sector mainly means different types of banks (and other types of financial
institutions). Only 15% (25 million) of the population of 160 million has bank accounts and less
than 4% (5.5 million) are borrowers; only one quarter of households has a member with a bank
account. Moreover, while two- thirds of the population resides in rural areas, only 25% of total
bank depositors and 17% of total borrowers reside in rural areas; in value terms the shares of
rural customers are even smaller, only 10% and 7% of the total value of deposits and advances,
respectively. Limited access to services is also evidenced by the low level of branch penetration
in rural areas, where there are less than 2,500 branches for a population of 105 million people or
an average of 42,000 inhabitants per branch. SBP projects financial penetration ratios to be
raised through an enabling policy environment and the various outreach programs described
above from a national coverage of 19,000 persons per bank branch in 2007 to 15,000 in 2012 and
12,000 in 2017. The coverage of ATM outlets is projected to increase from 57,000 persons per
ATM in 2007 to 12,000 in 2017.
3. Methodological Framework
Efficiency studies have used parametric and non-parametric approaches. The latter is a
mathematical programming based approach and typically known as the Data Envelopment
Analysis (DEA) approach. It uses the observed values of inputs and outputs and attempts to find
which of the firms in the sample determine an envelopment surface. Firms lying on the surface
are deemed to be efficient and receive a value of unity. Firms that do not fall on the surface
(below the frontier) are deemed to be inefficient and capture a value of less than unity. Hence, all
deviations from the estimated frontier represent inefficiency. Firms under the DEA approach are
8
estimate the output frontier. Distance functions are estimated under Constant Returns to Scale
(CRS) and Variable Returns to Scale (VRS) assumptions.
Modern efficiency measurement begins with Farrell (1957) to define a simple measure of
firm efficiency, which could account for multiple inputs2. He pointed out that the efficiency of a
firm consists of two components: technical efficiency (TE) and allocative efficiency (AE). The
technical efficiency reflects the ability of a firm to obtain maximal output from a given set of
inputs, and allocative efficiency reflects the ability of a firm to use the inputs in optimal
proportions, given their respective prices. By calculating technical and allocative efficiency we
can get a measure of total/ overall/economic efficiency3.The efficiency concepts are explained in
the following subsections by using input/output oriented measures and constant returns to scale
(CRS) / variable returns to scale (VRS) assumptions.
A: Input-Oriented Measures
The input oriented measures of efficiency can be explained using similar framework to
Farrell (1957). For the sack of simplicity let us consider a bank using only two inputs (x1 and x2)
to produce a single output (y), under the assumption of constant returns to scale. The CRS
assumption allows one to represent the technology using unit isoquant and the knowledge of the
unit isoquant of the fully efficient firm permits the measurement of technical efficiency shown
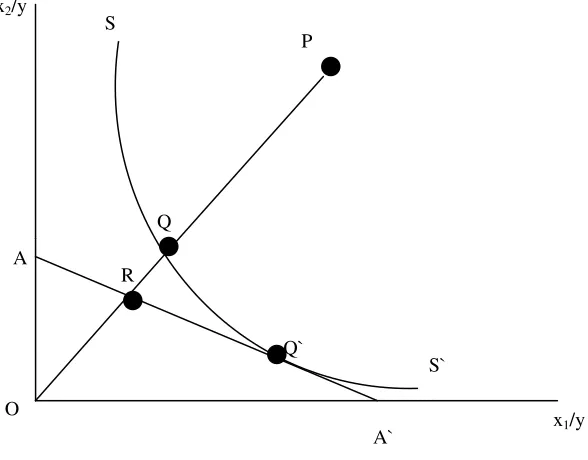
by SS` in Figure 1.1. If a given bank uses quantities of inputs, defined by the point P, to produce
a unit of output, the technical inefficiency of that firm could be represented by the distance QP,
which is the amount by which all inputs could be proportionally reduced without a reduction in
output. Traditionally this is expressed in percentage form by the ratio QP/0P, which represents
the percentage of that inputs that could be reduced. The output oriented technical efficiency
(TEI) of a bank is measured by the ratio
TEI = 0Q/0P (1.1)
Which is equal to one minus QP/0P. It will take a value between zero and one and also
provides an indicator of the degree of technical inefficiency of the banks. A value of one
indicates the firm is fully technically efficient. For example, the point Q is technically efficient
2
A more detailed treatment is provided by Fare, Grosskopf and Lovell (1985, 1994) and Lovell (1993).
3
9
because it lies on the efficient isoquant. The AE can be calculated by input price ratio thus the
allocative efficiency (AE) of the firm operating at P is defined to be the ratio
[image:10.612.150.444.196.426.2]AEI = 0R/0Q (1.2)
Figure 1.1 Technical and Allocative Efficiencies in Input Oriented Measures
Since the distance RQ represents the reduction in production costs that would occur if
production were to occur at the allocatively (and technically) efficient point Q', instead of at the
technically efficient, but allocatively inefficient, point Q.4 The total economic efficiency (EE) is
defined to be the ratio
EEI = 0R/0P (1.3)
Where the distance RP can also be interpreted in terms of a cost reduction. Note that the
product of technical and allocative efficiency provides the overall economic efficiency. The
results of all three measure are not to be less than zero and greater than one.
TEI×AEI = (0Q/0P) × (0R/0Q) = (0R/0P) = EE1 (1.4)
4
One could illustrate this by drawing two isocost lines through Q and Q'. Irrespective of the slope of these two parallel lines (which is determined by the input price ratio) the ratio RQ/0Q would represent the percentage reduction in costs associated with movement from Q to Q'.
x2/y
x1/y
A
O
R
Q` Q
S
S` P
10 B: Output-Oriented Measures
The output-orientated technical efficiency measure explains that how much output
quantities can be proportionally expanded without altering the input quantities used. The
output-orientated measure opposed to the input-oriented measure. The difference between the output-
and input-oriented measures can be illustrated using a simple example involving one input and
one output. This is shown in Figure 1.2(a) where we have decreasing returns to scale technology
represented by f(x), and an inefficient firm operating at the point P. The input-orientated measure
of TE is equal to the ratio AB/AP, while the output-orientated measure of TE is CP/CD. The
output- and input-orientated measures provide equivalent measures of technical efficiency if
constant returns to scale exist and it is unequal when either increasing or decreasing returns to
scale are present (Fare and Lovell 1978). The constant returns to scale case is depicted in Figure
1.2(b) where we observe that AB/AP = CP/CD, for any inefficient point P we care to choose.
Figure 1.2 (a,b) Input and Output Oriented Technical Efficiency Measures and Returns to Scale
(a) DRTS
O
C
C x O
P B
D
A P
B
D
A
y f(x) f(x)
(b) CRTS y
[image:11.612.100.515.392.600.2]11
An output-oriented model implies that the efficiency is estimated by the output of the
firm relative to the best practice level for a given level of inputs. In order to specify the
mathematical formulation of the output oriented, let us assume that we have K decision-making
units (DMU)5 using N inputs to produce M outputs. Inputs are denoted by xjk (j = 1,……..,n) and
the outputs are represented by yik (i=1,…….,m) for each bank k (k=1,…….,K). The efficiency of
DMU can be measured as (Coelli, 1998; Worthington, 1999; Shiu, 2002).
n j jk j is m i iK
u
y
v
x
TE
1
1 (1.5)
Where yik is the quantity of the ith output (i.e. Loan & Advances and Investment)
produced by the kth DMU banks, xjs is the quantity of jth input (i.e. Deposits, Labor and Capital)
used by the sth firm, and ui and vj are the output and input weights respectively. The DMU
maximizes the efficiency ratio, TEk, subject to
1
1 1
n j jk j is m ii
y
v
x
u
Where vj ≥ 1 (1.6)The above equation indicates that efficiency measures of a firm cannot exceed one and the
input and output weights are positive. The weights are selected in such a way that the firm
maximizes its own efficiency. To select optimal weights the following mathematical programming
(output-oriented) is specified (Coelli, 1998; Wrothington, 1999; Shiu, 2002)
Max TEk
Subject to
0
1
w
x
y
u
ir jr mi
i r=1,……,K (1.7)
j k n
j
j j r
j
x
u
x
v
1
ui and vj ≥ 0
5
12
Input oriented linear programming methods are used in order to obtain the minimized
inputs. Therefore the following mathematical programming model is specified (Banker and
Thrall, 1992; Coelli, 1998; Worthington, 1999; Shiu, 2002; Topuz et al, 2005).
Min TEk
Subject to
0
1
w
y
y
u
ir iFm
i
i r=1… K (1.8)
0
1
jk n j j jru
x
x
ui and vj ≥ 0The above model shows constant return to scale (CRS) if w=0 and it changed into variable
return to scale (VRS) if w is used unconstrained (Qayyum and Ahmed, 2006). In the first case it
leads to technical efficiency (TE) and in the second case we estimate pure technical efficiency
(PTE). The TE scores obtained from a CRS DEA into two components, one due to scale
inefficiency and one due to pure technical inefficiency. This may be done by conducting both a
CRS and a VRS DEA upon the same data. If there is a difference in the two TE scores for a
particular DMU, then this indicates that the DMU has scale inefficiency, and that the scale
inefficiency can be calculated from the difference between the VRS TE scores and the CRS TE
score. The CRS assumption is only appropriate when all DMUs are operating at an optimal scale.
Imperfect competition, constraints on finance, etc. may cause a DMU to be not operating at an
optimal scale. Banker, Charens and Cooper (1984) suggested an extension of the CRS DEA model
to account for VRS situations. The use of the VRS specification will permit the calculation of TE
devoid of these SE effects.
13
accommodates multiple-inputs and multiple-outputs of the banks. Fourth, it provides a scalar measure of relative efficiency, and the areas for potential addition in outputs and reduction in inputs. Fifth, in DEA, it is not necessary to provide values for weights associated with input and output factors, although the user may exert influence in the selection of weight values. Sixth, DEA works particularly well with small samples (Evanroff and Israilevich, 1991). On the other
hand, DEA’s major shortcoming is that it assumes data to be free of measurement error, and
could therefore; give unreliable results if the integrity of data is not assured (Avkiran, 1999a).
Input and output variables’ specification is critical to banking efficiency studies (Berg, et al. 1992). The efficiency of banks can be measured by selecting appropriate inputs and outputs.
Input output specification itself depends on how one defines banking activity. Economists look at
a bank from five different angles [see for more details Favero and Papi (1995) and Colwell and
Davis (1992)]. These approaches are the Production Approach (PA), Intermediation Approach
(IA), Asset Approach (AA), User Cost Approach (UCA) and Value Added Approach (VAA).
The former two approaches are commonly used by researchers.
The study used Intermediation Approach (IA) in defining bank inputs and outputs. The
(IA) considers financial institutions as primarily intermediaries, channeling funds between
borrowers and savers as intermediators of financial resources. The most fundamental role of the
financial system remains that of intermediating between savers and investors. Efficient resource
allocation of the available resources of the economy is undertaken (Haque, 1997). Intermediation
approach deposits treated as inputs (Miller and Noulas, 1996). Along with Deposits, Labor and
Capital as Inputs and Loans and Advances and Investment asOutputs.
The annual data used covers the period 1991-2008 for the 19 domestic commercial of
Pakistan. The study period was divided into three periods, pre- reform period (1991-1997), First
Phase of Reforms (1998-2001) and Second Phase of Reforms (2002-2005). The annual data are
collected from various issues of the Banking Statistics of Pakistan by SBP and different annual
reports of scheduled banks.
5. Empirical Findings
Financial Sector Development and Economic Development are inter-related. No
14
functioning and efficient financial sector. Banks in Pakistan account for 95 percent of the
financial sector and hence a sound and healthy banking system is directly related to economic
growth and development of Pakistan. The modern growth theory identifies two main channels
through which the financial sector might affect long-run growth in a country: first, through
catalyzing the capital accumulation (including both human and physical capital) and second by
increasing the rate of technological progress.
Efficiency score of Pakistan banking industry working as intermediates are calculated by
using DEA approach. We also assume VRS by using both input oriented (IO) and output
oriented (OO). The results are presented in the table. As can be seen from the table the average
input oriented technical efficiency (TE), pure technical efficiency (PTE) and scale efficiency
(SE) leveled at 64.9%, 88% and 74.2% during 1991. The average output oriented TE, PTE and
SE are 64.9%, 88.7% and 73.6% respectively during the same year. Scale inefficiency is greater
than pure technical inefficiency in both measures. The performance of commercial banks as a
group in 1991 is not noteworthy because the state owned banks were large in size.
Efficiencies of the domestic banks are presented in Table 2. Efficiency analysis for the pre
reform period (i.e.1991-97) reveals that, the efficiency score of banking improves from 65% in
1991 85% in 1997. The efficiency score jumped at least 20 percentage points. This may be due
to the privatization of main nationalized banks and the induction of new private banks that may
have induced healthy competition in the banking industry.
Comparing the results of pre reform and 1st phase of reforms it can be concluded in
input-oriented the Pure Technical Inefficiency (PTI) in pre-reform period was 8.9 percent and in
first phase it is 5.8 percent. It means that there is a 3.1 percent increase in PTE. But Scale
Inefficiency (SI) in pre-reform period was 14.2 percent and in first phase it is 16.7 percent. It
means that the scale inefficiency increased by 2.5 percent in the 1st phase of reforms. On the
other hand, in output-oriented the Pure Technical Inefficiency (PTI) in pre-reform period was 8.4
percent and in first phase it is 6.4 percent. It means PTE increased 2 percent. In pre-reform
period SE was 14.7 percent and in first phase of reforms it is 15.8 percent, its means that the SE
increased 1.1 percent. Scale Inefficiency is increased in this period it may be due to over
15
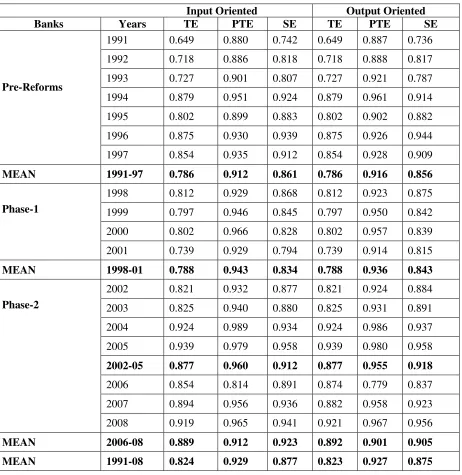
Table 2: Summary of Input and Output Oriented Efficiency Measures of Banking Industry
Input Oriented Output Oriented Banks Years TE PTE SE TE PTE SE
Pre-Reforms
1991 0.649 0.880 0.742 0.649 0.887 0.736
1992 0.718 0.886 0.818 0.718 0.888 0.817
1993 0.727 0.901 0.807 0.727 0.921 0.787
1994 0.879 0.951 0.924 0.879 0.961 0.914
1995 0.802 0.899 0.883 0.802 0.902 0.882
1996 0.875 0.930 0.939 0.875 0.926 0.944
1997 0.854 0.935 0.912 0.854 0.928 0.909
MEAN 1991-97 0.786 0.912 0.861 0.786 0.916 0.856
Phase-1
1998 0.812 0.929 0.868 0.812 0.923 0.875
1999 0.797 0.946 0.845 0.797 0.950 0.842
2000 0.802 0.966 0.828 0.802 0.957 0.839
2001 0.739 0.929 0.794 0.739 0.914 0.815
MEAN 1998-01 0.788 0.943 0.834 0.788 0.936 0.843
Phase-2
2002 0.821 0.932 0.877 0.821 0.924 0.884
2003 0.825 0.940 0.880 0.825 0.931 0.891
2004 0.924 0.989 0.934 0.924 0.986 0.937
2005 0.939 0.979 0.958 0.939 0.980 0.958
2002-05 0.877 0.960 0.912 0.877 0.955 0.918
2006 0.854 0.814 0.891 0.874 0.779 0.837
2007 0.894 0.956 0.936 0.882 0.958 0.923
2008 0.919 0.965 0.941 0.921 0.967 0.956
MEAN 2006-08 0.889 0.912 0.923 0.892 0.901 0.905 MEAN 1991-08 0.824 0.929 0.877 0.823 0.927 0.875
During the first phase of reforms, during the period 1998-01 average input oriented TE,
PTE and SE are 78.8%, 94.3% and 83.4% respectively. Average mean efficiency of output
oriented TE, PTE and SE are 78.8%, 93.6% and 84.3% respectively. A possible reason for the
increasing PTE during the period may be the strengthening of the prudential regulations and
16
Comparing the results of the pre reform period and the first phase of reforms, it can be
concluded in input-oriented Pure Technical Inefficiency (PTI) in the pre-reform period was
8.9% and in first phase it is 5.8%. This means that there is a 3.1% increase in PTE. But Scale
Inefficiency (SI) in the pre-reform period was 14.2% and in the first phase it was 16.7%. Thus
scale inefficiency increased 2.5% in the first phase of reforms. On the other hand, in
output-oriented Pure Technical Inefficiency (PTI) in the pre-reform period was 8.4% and in the first
phase it was 6.4%. Thus PTE increased 2%.
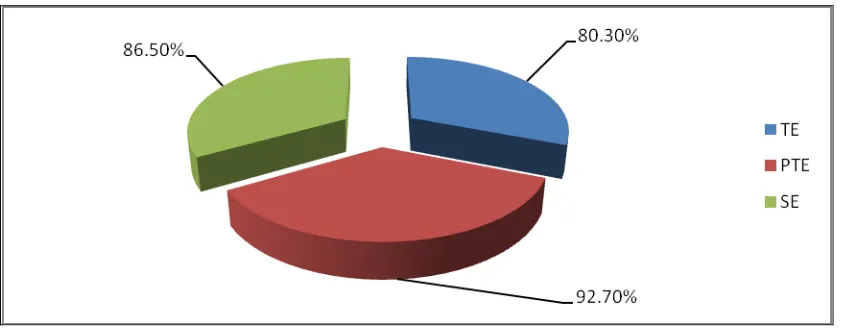
Figure: 1.3 Input Oriented Efficiency Measures of Banking Industry (1991-2008)
In the pre-reform period SE was 14.7% and in first phase of reforms it was 15.8%. SE
increased 1.1%. Scale Inefficiency increased in this period. It may have been due to over
employment in banks, unprofitable branches, and the burden of non-performing loans (NPLs) etc
Annual average efficiencies of the domestic commercial banks are presented in Table 5.1.
Efficiency analysis for the pre reform period (i.e.1991-97) reveals that, .mean of input oriented
TE, PTE and SE was 78.6%, 91.2% and 86.1% respectively. The average output oriented TE,
PTE and SE are 78.6%, 91.6% and 85.6% respectively. As can be seen from the Table, the
efficiency score increased during the period. This may be due to the privatization of public banks
and the entrance of new private commercial banks in the industry which increased competition
17
Figure: 1.4 Output Oriented Efficiency Measures of Banking Industry (1991-2008)
Last spell of financial sector reforms started in 2002 to 2005 with the revival of earlier
reform process by the government of Pakistan with the help of international agencies. Most of
the reforms initiated in the 2nd phase are reduce the cost structure of state owned banks and
facilitate their scale, complete the privatization of banks, liberalize the bank branch policy,
reduce taxes and maintain a more effective role of the central banks, are in the second phase.
Efficiency analysis for the period of the second phase of reforms (i.e.2002-08). For the
year 2002 input oriented TE, PTE and SE was 82.1%, 93.2% and 87.7.2% and output oriented
TE, PTE and SE are 82.1%, 92.4% and 88.4% respectively. The efficiency scores for the period
2008 presented in the Table revealed that input oriented TE, PTE and SE are 91.9, 96.5 and 94.1
percent, and output oriented TE, PTE and SE are 92.1, 96.7 and 95.6 respectively. Efficiency
score increased in 2008 as compare to 2002, the reforms improve the efficiency of banks so the
TE, PTE and SE increased. Overall mean efficiency score (1991-2008) shows that the reforms
improved the efficiency of banks so the PTE and SE increased regularly.
In the pre reform, first phase second phase of reforms and after the second phase mean
efficiencies shows there is a decline in efficiency. From the pre reform period there is a gradual
increase in the efficiencies till 2005, after that table shows a decline in efficiency scores. The
table shows that scale inefficiency is greater than pure technical inefficiency in both measures.
This implies that most of the technical inefficiency of commercial banks is due to scale
inefficiency rather than pure technical inefficiency (Managerial Efficiency). Now the banks are
18
quality and profitability during the year 2004& 2005. These developments clearly reflect the
increased competition among banks and improvement in the efficiency of the banking sector.
The results show that most of the reforms are related to the management side and banks showed
improvements in the management side (i.e. PTE). However, there is a need for proper reforms to
reduce scale inefficiency.
6. Conclusion
The paper attempts to explores the efficiency measures of Pakistani banks by using
bank-wise annual data from 1991 to 2008. The financial sector reforms initiated in early 1990s has
changed the entire banking industry in Pakistan. There was a government monopoly in banking
sector during pre-reform era Reforms have increased both the revenues and costs of banks
whereas profitability not for consumers.
The technological progress, which mainly comprised computerization and automation of
financial transactions, has significantly reduced the cost of banking industry during the sample
period. Thus financial sector reforms particularly the second phase of reforms improved the
efficiency of commercial, public and private banks. After the reforms, PTE increased as
compared to SE. It can be concluded that the overall efficiency of the industry improved because
of an increase in pure technical efficiency.
For each year, efficiency frontier is estimated under each specification to measure the
relative performance of commercial banks. The analysis found that commercial banks could
improve their efficiency by increasing profits, assets, markup interest earnings and non-markup
interest earning and decreasing liabilities, markup interest expenditures and non-markup interest
expenditures among the bank specific variables.
There is an overall improvement in the efficiency of commercial banks. Financial sector
reforms changed the ownership structure of the banking sector during the two decade. Earlier
banking sector was dominated by the state owned banks. Now share of public sector banks has
declined. Improve the efficiency of the banks and after the reform the PTE is increased as
compared to SE (2004-05). It is further concluded that the overall efficiency of the industry
improved because of increase in the pure technical efficiency (PTE).
Overall conclusion of the study is that the reforms are successfully improving the
19
corrective measures in administrative management, optimal diversification of asset portfolio,
technological progress and reducing the amount of nonperforming loans under the guidance of
international agencies.
This study however concentrated on only one aspect of commercial bank that is role as an
intermediary. There are number of other dimensions and aspects needs to be explored, including
efficiency of bank as production unit, economic and allocative efficiency of banks etc.
References
Akhter, M. H., 2002, “X-Efficiency Analysis of Commercial Banks in Pakistan: A Preliminary Investigation”, The Pakistan Development Review, 41:4 Part II (Winter 2002) pp. 567–580.
Altunbas, Y., Goddard, J. and Molyneux, P., 1999, “Technical change in Banking”. Economic Letters Vol. 64, issue 2, pages 215-221.
Aly, H.Y., Grabowski, R., Pasurka, C. and Rangan, N., 1990, “Technical, Scale and Allocative Efficiencies in U.S Banking: An Empirical Investigation” The Review of Economics and Statistics.
Banker, R. D., and Maindiratla, A., 1988, “Nonparametric analysis of technical and allocative efficiencies in production”, Econometrica, Vol. 56, No. 6, pp. 1315-32.
Banker, R. D., Charness, A. and Cooper, W. W., 1984, “Some models for estimating technical and scale inefficiencies in data envelopment analysis”, Management Science, Vol. 30, No. 9, pp. 1078-92.
Berg, Sigbjorn Atle, S. Matti, Hjalmarsson, Lennart and Suominen, 1993, “Banking Efficiency in the Nordic Countries” Journal of Banking and Financ, Vol. 17, issue 2-3, pages 371-388.
Berger, A. A. and Humphery, D. B., 1997, “Efficiency of Financial Institutions: International Survey and Directions for Future Research”. European Journal of Operations Research (especial issue) Vol. 98.
Berger, A. N. and Humphrey, D. B., 1990, “Measurement and efficiency issues in Commercial banking”, Charleston, SC., paper presented at a NBER Conference on Research on Income and Wealth.
Berger, A., Leusner, J., and Mingo J., 1997, “The efficiency of bank branches”. Journal of Monetary Economics.
20
Strengthening Regulation Policy and Practice, Chancellors Conference Centre, University of Manchester, Manchester, UK.
Charnes, A., Cooper, W. Wand, and Rhodels, E., 1978, “Measuring the efficiency of decision making units”, European Journal of Operational Research, Vol. 2, No. 6, pp. 429-44.
Coelli, T., 1996, “A Guide to DEAP Version 2.1 Data Envelopment Analysis (Computer) Program”, CEPA Working Paper 96/08.
Din, Musleh-ud, Ghani, E. and Qureshi, S. K., 1996, “Scale and Scope Economies in Banking: A Case Study of the Agriculture Development Bank (ZTBL) of Pakistan”. The Pakistan Development Review.
Favero, C. A. and Papi, L., 1995, “Technical Efficiency and Scale Efficiency in the Italian Banking Sector: A Non-Parametric Approach”, Journal of Applied Economics, Vol. 27.
Gould, B and Roll, Y., 1989, “An application procedure for data envelopment analysis”,
OMEGA, Vol. 17, No. 3, pp.237-52.
Government of Pakistan, 2005-06 & 2007-08, “Economic Survey”, Ministry of Finance, Economic Advisory Wing, Islamabad.
Haque, Ul Nadeem, 1997, “Financial Market Reforms in Pakistan,” The Pakistan Development Review Part-II, pp: 839-854.
Hardy, D and Patti, E., 2003, “The Effects of Banking System Reforms in Pakistan” IMF Working Paper.
Hardy, Daniel C., and De Patti, Emilia Bonaccorsi, 2001, “Bank Reforms and Bank Efficiency in Pakistan” IMF Working Paper WP/01/138).
Hassan, Y.A., Grabowski, R., Pasurka, C and Rangan, N., 1990, “Technical, Scale and Allocative Efficiencies in U S Banking: Ann Empirical Investigation”, The Review of Economics and Statistics, Vol. 72, No. 2, pp. 211-18.
John C. Topuz, Ali F. Darrat and Shelor, Roger M., 2005, “Technical, Allocative and Scale Efficiencies of REITs: An Empirical Inquiry” Journal of Business, Finance & Accounting Vol. 32, issue 9-10, pages 1961-1994.
Mlima, Hjalmarsson, 2002, “Measurement of Inputs and Outputs in the Banking Industry”
Tanzanet Journal Vol. 3(1).
State Bank of Pakistan (various issues) “Banking Statistics of Pakistan.”