
http://www.scirp.org/journal/gep ISSN Online: 2327-4344 ISSN Print: 2327-4336
An Evaluation Performance of Potential Pollution
of Arsenic, Chromium and Cadmium in the Road
Side Soil of Kirkuk City, Northern Iraq
Hassan A. A. Al-Jumaily
Department of Applied Geology, College of Science, University of Kirkuk, Kirkuk, Iraq
Abstract
The present work is to evaluate and investigate the distribution of heavy metals (As, Cr and Cd) and to assess the road side samples contamination using an Index (SEPI), (CPI), (GAI), (CF) and (PLI). From right and left Khasa in Kirkuk city, road soil samples were collected in order to estimate the probable contamination level of heavy metals (Cd), (As) and (Cr) in the study area. The heavy metal concentrations were determined in the way side samples by using (ICP-MS) technique. The 22 samples have collected in August, 2013. The results of average levels of heavy metals revealed Cr, As and Cd recorded the highest concentration of (178.6 ppm, 10.4 ppm and 0.599 ppm) in right Khasa respectively. These heavy metals are recorded the lowest value (165.8, 8.29 and 0.4 ppm) in left Khasa respectively. However, the concentration of Cr and As was higher than the studied worldwide permissible of contaminated soil. The highest (SEPI) for As in right Khasa and Cr in left in Khasa seems therefore to be that this road side soil is the most polluted in the city of Kirkuk classified mod-erately contamination. The accounted of (CPI) for As, Cd and Cr ranged from 0.82 to 1.30 with average 1.01 and 0.6 to 1.12 with an average 0.78 in right and left Khasa respectively. The highest values in the right Khasa which suggest multi-elements contamination and suggested this area of study area received more heavy metals comes from manmade and industrial activities. The GAI showed a moderate contaminated with Cd in right Khasa of study area, while the other metals are in their uncontami-nated level. The CF results has been showed by a considerable contamination metals (As, Cr and Cd) in of right Khasa, but low to moderate contamination in left Khasa. The results of (PLI) revealed a deterioration of site quality in all samples of Kirkuk city. Thus the evaluation methods revealed that the studied areas especially right Khasa impacted with heavy industrial activity, phosphate fertilizer, emission of gasses from automobile manufacture tire abrasion and workshop causing an increasing in metal concentrations towards the right Khasa.
How to cite this paper: Al-Jumaily, H.A.A. (2016) An Evaluation Performance of Po-tential Pollution of Arsenic, Chromium and Cadmium in the Road Side Soil of Kirkuk City, Northern Iraq. Journal of Geoscience and Environment Protection, 4, 80-94.
http://dx.doi.org/10.4236/gep.2016.49007
Received: August 21, 2016 Accepted: September 18, 2016 Published: September 21, 2016
Copyright © 2016 by author and Scientific Research Publishing Inc. This work is licensed under the Creative Commons Attribution International License (CC BY 4.0).
Keywords
Pollution, Geo Accumulation Index, Contamination Factor, Pollution Load Index, Iraq
1. Introduction
Environmental contamination and exposure to heavy metals is a real growing problem throughout the world. The both natural sources and anthropogenic processes spread heavy metals in to various environmental media. The most important environmental issue which caused by anthropogenic activities such as urban road Construction, agri-culture waste, sewage disposal and automobile workshop is the emission of heavy met-als [1]. The presence of heavy metals has been considered as useful indication for con-tamination in soil of surface, sediment and dust environments [2]. Atmospheric pollu-tion is the fundamentally sources of heavy metal availability in the environment. These sources include vehicular emissions, industrial discharges and other activities [3]. Emis-sions from road traffic have contributed greatly to the level of particulate maters both in developed and developing countries [4]. Urban soil is an important ingredient of the urban ecosystem [5]. This can be considered both as a sink of pollutant and source of pollution with the capacity to ground water, into food chain and into the human body [6][7].
In urban city centers, it is common to see high number of industries and vehicles. Thus making urban centers, a major refuge of resource consumption and chemical emissions may create serious environmental problems if not controlled [8]. Street or urban road side consist of vehicular exhaust particles, household dust, soil dust, con-struction dust aerosols that are carried clearly by air and water [9][10]. Heavy metal may come from abundant different sources to the civilian area such is vehicle emis-sion.
Three main factors known to influence the levels of heavy metal inroad side's sam-ples which have been reported are traffic, industry and particularly house and road dust [11]. The soil road dust in urban area is indicators of heavy metals pollution from at-mospheric precipitation. These metals can accumulate in top soil from atat-mospheric precipitation by sedimentation, impacting and interception. The assemblage of these metals to stay in urban soils for a long period of time may pose serious environmental and health problems in the urban city centers [7]. Exposed to weighty metals in road side can occur by means of inspiration, absorption and skinny contact. The pernicious effects of heavy metals in road soil include nervous system retardation, respiratory sys-tem disorders, and the risk of cancer in the later life [12]. For this study Kirkuk city was the chosen area. This city is a rapidly developing area, and is considered a major work place in the north of Iraq. It contains many work place parts such as, north oil company, north gas company, cement factory, construction materials and a lot of the fuel stations.
and to assess the road side samples contamination using indices Single Element Pollu-tion Index (SEPI), Combined PolluPollu-tion Index (CPI), Geo-AccumulaPollu-tion (GAI), Con-tamination Factor (CF) and Pollution Load Index (PLI).
2. Material and Methods
2.1. The Area of Study
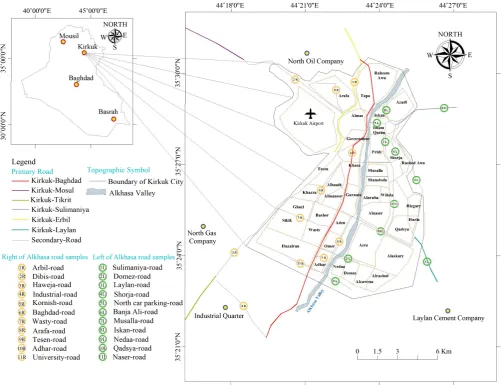
The study area, Kirkuk city the geographical position being (44˚43'00"N - 44˚32'00"N) and (35˚50'00"E - 35˚38'00"E) is located in Northern Iraq (Figure 1). The altitude above sea level is (367 m), the area of Kirkuk government around (9676 Km2) and represent
the ratio about 2.2% of Iraq.
[image:3.595.47.549.301.686.2]It is situated on the quaternary deposits formed mainly form river sediments. The study area is arid to semi-arid climate. Naturally, it receipts a significant particulate matter from the atmosphere, and it typically influences by gas emitted from industrial state and automobile exhausts. Kirkuk city is one of the rich-oil provinces with a more
productive soil. The river was divided Kirkuk city in to tow parts right and left called Khasa. Most of industrial state such as (North oil company, North gas company, indus-trial quarter, Fuel stations mechanical workshop and heavy traffic etc. were located at right part, while in the left part of studied area only cement factory was found in this part with a little industrial state.
2.2. Sample Collection
Road side sample of 22 samples (11 samples for each location) were collected from the site using polyethylene cylindrical containers in 8th 2013. From within two meter of
road side edge these sample ware collected. Using polyethylene brush, dish and con-tainers and were collected in polyethylene concon-tainers. The road side soil samples were taken from (0 - 20 cm) depth. The samples were dried at 105˚C to constant mass, and sieved through a <2 mm stainless-steel sieve.
2.3. Chemical Determinations.
Chemical analyses for the samples of road side soil were performed at the accredited Acme Analytical laboratory of Canada. More specifically, a 0.5 g aliquot of each road side soil was digested with nitric acid (HNO3) and hydrochloric acid (HCl) in a ratio 3:1
at 95C. By coupled plasma, Logistical reasons allowed inductively the geochemical solu-tions to be analyzed-Mass spectrometry (ICP-MS) type (Elmer Elam perken 6000) Technique, for the road side soils collected from Kirkuk city by (ICP-MS) for the ref-erence soils. The concentrations of As, Cr and Cd were determined in the solution of soil. Compound of replicates, reagent blanks and reference materials introduced by the ACME Analytical laboratories supported the excellent precision and accuracy of ana-lytical results.
3. Results and Discussion
3.1. Effect of pH
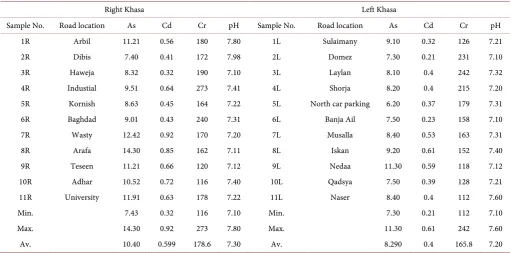
Table 1. Metal concentration in road side soil of right and left khasa in Kirkuk city in ppm.
Right Khasa Left Khasa
Sample No. Road location As Cd Cr pH Sample No. Road location As Cd Cr pH
1R Arbil 11.21 0.56 180 7.80 1L Sulaimany 9.10 0.32 126 7.21
2R Dibis 7.40 0.41 172 7.98 2L Domez 7.30 0.21 231 7.10
3R Haweja 8.32 0.32 190 7.10 3L Laylan 8.10 0.4 242 7.32
4R Industial 9.51 0.64 273 7.41 4L Shorja 8.20 0.4 215 7.20
5R Kornish 8.63 0.45 164 7.22 5L North car parking 6.20 0.37 179 7.31
6R Baghdad 9.01 0.43 240 7.31 6L Banja Ail 7.50 0.23 158 7.10
7R Wasty 12.42 0.92 170 7.20 7L Musalla 8.40 0.53 163 7.31
8R Arafa 14.30 0.85 162 7.11 8L Iskan 9.20 0.61 152 7.40
9R Teseen 11.21 0.66 120 7.12 9L Nedaa 11.30 0.59 118 7.12
10R Adhar 10.52 0.72 116 7.40 10L Qadsya 7.50 0.39 128 7.21
11R University 11.91 0.63 178 7.22 11L Naser 8.40 0.4 112 7.60
Min. 7.43 0.32 116 7.10 Min. 7.30 0.21 112 7.10
Max. 14.30 0.92 273 7.80 Max. 11.30 0.61 242 7.60
Av. 10.40 0.599 178.6 7.30 Av. 8.290 0.4 165.8 7.20
3.2. Heavy Metals
The levels of appearance of the metals specified that Cr has germinated as the prevail-ing metal, while Cd has the lowest concentration in roadside soil. It is observed form the soils right Khasa and left Khasa area that the average values of metals followed the sequence; Cr > As > Cd in both areas, while the mean value in right Khasa is higher concentricity of left Khasa. A comparison of metal average concentration in road side soil indicated that higher concentricity of Cr, As, and Cd (178.1 - 165.8, 10.4 - 8.29, 0.559 - 0.4 ppm respectively) was observed in the right khasa Table 1. This has consi-derable participation for the metal input from the construction works and other anth-ropogenic activities like oil refinery fuel station, vehicle agriculture, house hold dust, soil, dust, aerosols, burning of tire and burning of heavy duty oils which released parti-culates that are subsequently deposited on to the surface soil. This reflects a considera-ble effect of industrial of the environment of this area [17]. A brief discussion about single metals follows.
3.2.1. Cadmium (Cd)
The allowable limit of cadmium in soil, recommended by [18], is 3 ppm Table 2. In the road side soil concentration of cadmium was recorded low the permissible limit. Con-centricity of Cd in road side soil of right and left Khasa ranged between 0.32 ppm to 0.92 ppm with average 0.599 and 0.21 ppm to 0.61 ppm with average 0.4 ppm respec-tively. Generally, Cd in the environment comes from different a ways of natural and manmade pollution.
Table 2. Average concentration of As, Cd and Cr in studied area and compared with the per-missible concentration of heavy metal in soil according to [18].
Heavy metal Right Khasa Left Khasa Permissible
As 10.4 8.29 10
Cd 0.599 0.4 3
Cr 178.6 165.8 100
pollution resource of Cd components are combustion process of coal and oil, refuse in-cineration [20], pigments in plastic and consumed batteries. Road side receives differ-ent inputs of heavy metals from variety of mobile such as vehicular emission, oil com-bustion, waste incineration, construction and destruction activities in addition to re-suspension of surrounding contaminated soil [10].
Cadmium in the road side soil in right Khasa of Kirkuk city was the highest; it ranges between 0.32 - 0.64 ppm with an average of 0.599 ppm Table 1. The lowest value Cd was recorded in the left Khasa in Kirkuk city, it ranges between 0.21 - 0.62 ppm with an average of 0.4 ppm. The high rate of Cd in right Khasa due to anthropogenic and in-dustrial activities. The high concentricity of Cd in road soil in the right Khasa of stu-died area 0.599 ppm could reflect the effect of human activity. As a result of urban in-dustrial and agricultural practice, human activity can contribute to increased Cd levels [21], atmospheric deposition [22] and phosphate fertilizer use had resulted in the emis-sion of significant amounts of Cd to the environment [23].
3.2.2. Chromium (Cr)
The permissible limit of chromium for soil is 100 ppm recommended by [18] in road soil concentration of chromium was above the permissible limit Table 2. Cr is a low mobility element, especially under moderate oxidizing and reducing conditions and near-neutral pH vales. Cr6+ adsorption decreases with increasing pH, and Cr3+
adsorp-tion increases with increasing pH. On the other hand, Cr is toxic for biotical systems [24]. Set of few large scale industrial activities such as dyes, ceramic and tanning are mentioned to contribute Cr [22]. Chromium in the road side soil in studied area was the highest, it ranges between 116 - 273 ppm with an average178.6 ppm Table 1. The lowest value of Cr was recorded in the left Khasa, it was detected to vary from 112 ppm to 242 ppm with an average of 165.8 ppm.
The observed values were the average value from the world literature (84 ppm) [22], and also more than the reported world scale of unpolluted soil (83 ppm) [24].
However, Cr average value in the all study area road side soil samples to be 10 times higher that chromium content in the rural (control) soil (17.33 ppm) suggesting possi-ble sources of Cr in the urban area.
3.2.3. Arsenic (As)
Table 2.
The anthropogenic sources of arsenic include industrial emission, suspended arsenic rich soil, waste materials, coal burning and use of As-rich phosphate fertilizers [25]. The highest concentration of As was observed in the right Khasa (10.4 ppm) can indi-cate the areas with anthropogenic factor such as traffic and urbanization factors. Preci-pitation from atmospheric sources of arsenic can participate significantly to arsenic concentricity in soils. The ratio of atmospheric natural sources such as volcanic activity, to atmospheric anthropogenic sources like fossil fuel combustion, varies regionally but on average their mutual contributions are about equal [22]. Other non-atmospheric anthropogenic sources involve agricultural and industrial applications [26].
3.3. Performance Evaluation of Soil Pollution
There are many indices that used to estimate the rate of contamination by heavy metal. For this purpose and to subtend the aims of this project. To evaluate the pollution level of As, Cd and Cr in road side soil five indices were selected. These indices are Single Element Pollution Index (SEPT), Combined Pollution Index (CPI), Contamination Factor (CF), Pollution Load Index (PLI) and Geo-Accumulation Load Index (Igeo).
3.3.1. Single Pollution Index
An evaluated index is generally applied to measure environmental quality of soil and one simple and well known index is a single element pollution index (SEPI) which was used as assessment methods and to identify single-element contamination resulting in increased such heavy metal toxicity. The equation used to calculate (SEPI) is as follows:
SEPI=metal content in soil permissible level of metal.
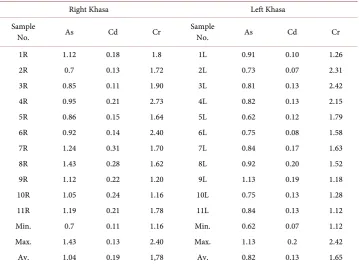
The acceptable levels for soil suggested by [24] and [18] adopted permissible rates and each weighty metal was classified as low contamination (SEPT ≤ 1), moderation con-tamination (1 < SEPI ≤ 3) or high concon-tamination SEPI > 3 [18]. The SEPI value of As in road side soil of right and left Khasa varied from 0. 7 to 1. 43 ppm and 0. 62 ppm to 1. 13 ppm respectively Table 3, which indicated low or moderate contamination level with an average of 1. 04 ppm to 0. 82 ppm respectively most road soil samples in right Khasa area were heavily polluted by As and classified as moderate contamination level. The SEPI value of Cr ranged from 1.2 ppm to 2.73 ppm and 1.18 ppm to 2.42 ppm re-spectively in both areas indicating moderate contamination with Cr. The SEPI value for Cd varied from 0.11 ppm to 0.28 ppm and 0.1 ppm to 0.2 ppm respectively in both areas with an average 0.2 ppm to 0.13 ppm respectively suggesting low contamination with Cd. The highest SEPI for Cr and As in the right Khasa area seems therefore to be that industrial soil, human activities, road dust and tire abrasion are polluted in the study area.
3.3.2. Combined Pollution Index (CPI)
Table 3. Single element pollution index values.
Right Khasa Left Khasa
Sample
No. As Cd Cr Sample No. As Cd Cr
1R 1.12 0.18 1.8 1L 0.91 0.10 1.26
2R 0.7 0.13 1.72 2L 0.73 0.07 2.31
3R 0.85 0.11 1.90 3L 0.81 0.13 2.42
4R 0.95 0.21 2.73 4L 0.82 0.13 2.15
5R 0.86 0.15 1.64 5L 0.62 0.12 1.79
6R 0.92 0.14 2.40 6L 0.75 0.08 1.58
7R 1.24 0.31 1.70 7L 0.84 0.17 1.63
8R 1.43 0.28 1.62 8L 0.92 0.20 1.52
9R 1.12 0.22 1.20 9L 1.13 0.19 1.18
10R 1.05 0.24 1.16 10L 0.75 0.13 1.28
11R 1.19 0.21 1.78 11L 0.84 0.13 1.12
Min. 0.7 0.11 1.16 Min. 0.62 0.07 1.12
Max. 1.43 0.13 2.40 Max. 1.13 0.2 2.42
Av. 1.04 0.19 1,78 Av. 0.82 0.13 1.65
ment contamination resulting in increased over all metal toxicity [28]. The CPI is cal-culated by the average ratio of metal concentration in soil to assumed permissible level and was that classified as low (CPI ≤ 1), middle (1 < CPI ≤ 2) or high (CPI > 2) [18]. The tolerable levels for soil suggested by [18] and [24] were adopted as permissible le-vels and pollution index was calculated as:
(
)
CPI= metal content in soil permissible level of metal number of metals
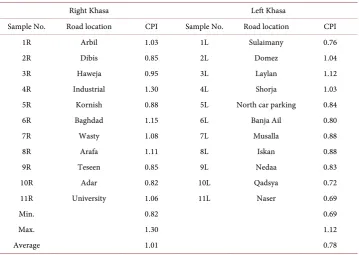
Table 4 shows that the CPI is higher than 1 in most of road side soil samples in right Khasa (with exception of some samples). The range of contamination being more in the samples road side soil in right Khasa than the left road side soil samples in left Khasa area reflecting that road side soil in right Khasa was more polluted by the heavy metal in study area due to anthropogenic sources. Thus, it is very likely that many road side soil in right Khasa of Kirkuk city are moderately polluted with heavy metals. But the CPI of the As, Cd and Cr at left Khasa area was less than 1in most samples which indi-cates that average levels of metals are below the selected standards but does not neces-sarily indicate that there are no anthropogenic resources of enrichment over back-ground level, and suggested single metals contamination [27]. The trend of CPI re-vealed that the right Khasa area greater than the left Khasa area. This trend indicated that the location along the right road side soil in Kirkuk city received more heavy met-als input from anthropogenic induced sources.
3.3.3. Index of Geo Accumulation Index (GAI)
Table 4. Combined pollution index values.
Right Khasa Left Khasa
Sample No. Road location CPI Sample No. Road location CPI
1R Arbil 1.03 1L Sulaimany 0.76
2R Dibis 0.85 2L Domez 1.04
3R Haweja 0.95 3L Laylan 1.12
4R Industrial 1.30 4L Shorja 1.03
5R Kornish 0.88 5L North car parking 0.84
6R Baghdad 1.15 6L Banja Ail 0.80
7R Wasty 1.08 7L Musalla 0.88
8R Arafa 1.11 8L Iskan 0.88
9R Teseen 0.85 9L Nedaa 0.83
10R Adar 0.82 10L Qadsya 0.72
11R University 1.06 11L Naser 0.69
Min. 0.82 0.69
Max. 1.30 1.12
Average 1.01 0.78
heavy metal obtained to a background levels originally used with bottom precipitates (Muller, 1979). It was more used by numerous authors [29] has applied the index of Igeo, to assess of road soil pollution. Geo accumulation index as proposed by [30] and cited by [31] have been widely used to evaluate the degree of heavy metal contamina-tion in wild and aquatic environment as expressed:
(
)
GAI=Ln Cm 1.5 Bm⋅
where Cm is the mean concentration of metal m in soil and Bm is the background con-centration of metal m (crustal abundant) [32], while 1.5 is a factor for possible differ-ence in the background concentricity due to lithological differdiffer-ences. GAI is classified into descriptive seven classes as follows: class 0 (GAI < 0) practically uncontaminated; class 1 (GAI 0 - 1) uncontaminated to moderately contaminated; class 2 (GAI 1 -2 ) moderately contaminated; class 3 (GAI 2 - 3) moderately to strongly contaminated; class 4 (GAI 3 - 4) strongly contaminated; clas 5 (GAI 4 - 5) strongly to extreme conta-minated and class 6 (GAI > 5) extremely contaconta-minated [30].
Table 5. Result of Geo Accumulation Index (GAI) compared with the average crustal abundant (background value) in uncontaminated soil, adopted from [32].
Right khasa Left khasa
Sample No. As Cd Cr Sample No. As Cd Cr
1R 0.39 0.91 −0.01 1L 0.19 0.35 −0.37
2R −0.01 0.60 −0.06 2L −0.03 −0.07 0.23
3R 0.10 0.35 0.04 3L 0.08 0.57 0.27
4R 0.23 1.05 0.39 4L 0.09 0.57 0.16
5R 0.13 0.69 −0.11 5L −0.19 0.49 −0.02
6R 0.20 0.64 0.27 6L 0.00 0.02 −0.14
7R 0.50 1.41 −0.07 7L 0.11 0.86 −0.11
8R 0.64 1.33 −0.12 8L 0.20 0.99 −0.18
9R 0.40 1.07 −0.42 9L 0.41 0.96 −0.43
10R 0.33 1.16 −0.45 10L 0.00 0.55 −0.35
11R 0.46 1.03 −0.03 11L 0.11 0.57 −0.49
Min. −0.05 0.35 −.45 Min. 0.00 −0.07 −0.43
Max. 0.64 1,41 0.39 Max. 0.41 0.99 0.27
Av. 0.32 0.98 −0.02 Av. 0.10 0.57 −0.09
Background
value 5 0.15 122 Background value 5 0.15 122
Khasa the Cd shows a positive index for all sample (except sample 2L) indicating prac-tically un polluted Table 3.
3.3.4. Contamination Factor (CF)
The grade of contamination by metals was determined by applying the contamination factor (CF) that can be calculated as:
CF=Cm sample Bm background
where Cm and Bm are defined above where the contamination factor CF < 1 indicates low contamination; 1 ≤ C F< 3 refers to moderate contamination, 3 ≤ CF < 6 means considerable contamination and CF > 6 indicates very high contamination factor. The contamination factor for As, Cr and Cd was calculated in the study areas and the results which have indicated in Table 6.
Table 6. Results of As, Cd, Cr and their Contamination Factor (CF) and Pollution Load Index (PLI) compared with the average crustal abundance (background value) in un contaminated soil adopted from [32].
Right Khasa Left Khasa
Sample No. CF PLI Sample No. CF PLI
As Cd Cr As Cd Cr
1R 2.24 3.73 1.47 2.30 1L 1.82 2.13 1.03 1.58
2R 1.48 2.73 1.40 1.78 2L 1.46 1.4 1.89 1.56
3R 1.66 2.13 1.55 1.76 3L 1.62 2.66 1.98 2.04
4R 1.9 4.26 2.33 2.65 4L 1.64 2.66 1.76 1.97
5R 1.72 3.0 1.34 1.90 5L 1.24 2.46 1.46 1.64
6R 1.84 2.86 1.96 2.17 6L 1.5 1.53 1.29 1.43
7R 2.48 5.13 1.39 2.76 7L 1.68 3.53 1.33 1.99
8R 2.86 5.66 1.32 2.77 8L 1.84 4.06 1.24 2.1
9R 2.24 4.4 0.98 2.12 9L 2.26 3.9 0.96 2.03
10R 2.1 4.8 0.95 2.12 10L 1.5 2.6 1.04 1.59
11R 2.38 4.2 1.46 2.44 11L 1.68 2.66 0.91 1.60
Min. 1.48 2.73 0.95 1.76 Min. 1.46 1.4 0.91 1.43
Max. 2.86 5.13 2.33 2.76 Max. 2.26 4.06 1.98 2.1
Av. 2.08 3.99 1.46 2.29 Av. 1.65 2.66 1.36 1.81
Background
value 1.0 1.0 1.0 Background value 1.0 1.0 1.0
study especially in the right Khasa. The heavy metals have been added in to urban soil through urban wastes [33] and most importantly through vehicle emission [34]. Con-tamination factor for As and Cr in the studied area are classified as class 2 and represent moderate contamination in all samples (Table 6). As, for examples is known to come from the utilize of industrial emission, coal burning and phosphate fertilizers [25], whereas Cd from tire abrasion, industrial and incinerator emission [35]. The source of Cr in road soil is known to come from the use of paints manufacture, leather tanning industries, metal plating, ceramic manufacture are reported to contribute Cr in the environment [22].
3.3.5. Pollution Load Index (PLI)
Pollution Load Index (PLI) has been suggested by [36] for evaluating particular site. This index expressed as:
(
)
PLI= CF1 CF2 CF3× × × × CFn n
ranges from 1.43 ppm to 2.1 ppm with an average 1.81 ppm. All samples in studied areas have PLI more than 1 indicates a deterioration of site quality. All samples in Kir-kuk city (Right and left Khasa) are more that base line level (1.0).
4. Conclusion
The results of the present study revealed significant presence of As, Cr, and Cd in the road side soil in Kirkuk city. The results appeared the following trend in road side soil: Cr > As > Cd, but the average concentrations of this metal in Khasa area of Kirkuk city showed abundant in right area more than the left area. The main concentration of As 10.4 ppm and 8.29 ppm respectively, Cr was 178.9 ppm and 165.8 ppm, while Cd was 0.59 ppm and 0.4 ppm respectively. It is clear that the pollutant affected the right Khasa more that the left Khasa road side because of the predominant industrial activities such as (oil and gas company) and in an increasing the pollutants. The result of SEPI values indicated moderate contamination with As and Cr, while SEPI values of Cd suggesting low contamination with this element in right Khasa. The CPI values indicated moderate contamination with As, Cr and Cd in most of the samples in right Khasa and this speci-fied that the right area received more heavy metals input from anthropogencally stimu-lated sources. The contamination factor in study area was moderately to considerable contamination with Cd in most samples especially in the right Khasa, slightly contami-nation with As and presently moderate contaminated with Crin both studied area. The result of Igeo in the most samples in right Khasa showed unpolluted to moderately polluted with cadmium.
5. Recommendations
It was recommended from the present study that:
1) Increasing green areas and implantation more trees because trees help in cleaning soil, protecting its fertility and in reducing the level of pollutants.
2) Continuous monitoring of concentrations of heavy metals, especially Cd and As to avoid being beat permissible limit.
3) The severe laws should be activated to prevent hazardous pollutants to the envi-ronment and increase envienvi-ronmental knowing among the people.
Acknowledgements
The author wish to thank Mr. Marwan Al-Jobory and Qayssar M. Ajaj, the maps de-signer of the search and, Mr. Ali Al-Saleh, the linguist. Thanks must also go to the ACME laboratory in Canada for helping me with the analyses of heavy metals.
References
[1] Abah, J., Mashebe, P. and Onjefu, S.A. (2014) Survey of the Levels of Some Heavy Metals in Roadside Dusts along Katima Mulilo Urban Road Construction, Namibia American. Jour-nal of Environmental Protection, 3, 19-27.
Con-tamination of Street Dust in the Industrial and High Traffic Density Areas of Jos Metropo-lis. Journal of Biodiversity and Environmental Sciences, 3, 13-21.
[3] Li, X., Poon, C.-S. and Liu, P.S. (2001) Heavy Metal Contamination of Urban Soils and Street Dusts in Hong Kong. Applied Geochemistry, 16, 1361-1368.
http://dx.doi.org/10.1016/S0883-2927(01)00045-2
[4] Charron, A., Harrison, R.M. and Quincey, P. (2007) What Are the Sources and Conditions Responsible for Accidences of the 24 h PM Limit Value (50 10 μg/m3) at a Heavily Traf-ficked London Site? Atmospheric Environment, 41, 1960-1975.
http://dx.doi.org/10.1016/j.atmosenv.2006.10.041
[5] Li, X. and Huang, C. (2007) Environment Impact of Heavy Metals on Urban Soil in the Vi-cinity of Industrial Area of Baoji City P.R. China. Environmental Geology, 52, 1631-1637.
http://dx.doi.org/10.1007/s00254-006-0608-3
[6] Paterson, E., Sanka, M. and Clark, L. (1996) Urban Soils as Pol-Lutant Sinks: A Case Study from Aberdeen, Scotland. Applied Geochemistry, 11, 129-131.
http://dx.doi.org/10.1016/0883-2927(95)00081-X
[7] Wang, X.S., Qin, Y. and Sun, S.X. (2005) Accumulation and Sources of Heavy Metals in Urban Topsoil: A Case Study from the City of Xuzhou, China. Environmental Geology, 48, 101-107. http://dx.doi.org/10.1007/s00254-005-1270-x
[8] Davydova, S. (2005) Heavy Metals as Toxicants in Big Cities. Microchemical Journal, 79, 133-136. http://dx.doi.org/10.1016/j.microc.2004.06.010
[9] Meza-Figueroa, D, De La O-Villanueva, M. and De La Parra, M.L. (2006) Heavy Metal Dis-tribution in Dust from Elementary Schools in Hermosillo, Sonora, Mexico. Atmospheric Environment, 41, 276-288. http://dx.doi.org/10.1016/j.atmosenv.2006.08.034
[10] Al-Khashman, O.A. (2004) Heavy Metal Distribution in Dust, Street Dust and Soils from the Work Place in Karak Industrial Estate, Jordan. Atmospheric Environment, 38, 6803- 6812. http://dx.doi.org/10.1016/j.atmosenv.2004.09.011
[11] Arslan, H. (2001) Heavy Metals in Street dust in Bursa, Turkey. Journal of Trace and Mi-croprobe Techniques, 19, 439-445. http://dx.doi.org/10.1081/TMA-100105058
[12] Ferreira-Baptista, L. and De Miguel, E. (2005) Geochemistry and Risk Assessment of Street Dust in Luanda, Angola: A Tropical Urban Environment. Atmospheric Environment, 39, 4501-4512. http://dx.doi.org/10.1016/j.atmosenv.2005.03.026
[13] Naim, S., Ozcan, H.K., Demir, G., Nemlioglu, S. and Bayat, C. (2003) Determination of Heavy Metal Concentrations in Street Dusts in Istanbul E-5 High Way. Environmental In-ternational, 29, 979-985.
[14] Lu, S.G. and Bai, S.Q. (2010) Contamination and Potential Mobility Assessment of Heavy Metals in Urban Soil of Hougzhou, China. Relationship with Different Land Uses. Envi-ronmental Earth Sciences, 60, 1481-1490. http://dx.doi.org/10.1007/s12665-009-0283-2
[15] Kim, K.W., Myung, J.K., Ahn, J.S. and Chon, H.T. (1998) Heavy Metal Contamination in Dust and Stream Sediment in the Taejon Area, Korea. Journal of Geochemical Exploration, 64, 409-419. http://dx.doi.org/10.1016/S0375-6742(98)00045-4
[16] Skrbic, B. and Miljevic, N. (2002) An Evaluation of Residues at an Oil Refinery Site Follow-ing Fires. Journal of Environmental Science and Health, 37, 1029-1039.
http://dx.doi.org/10.1081/ESE-120004520
[17] Thornton, I. (1991) Metal Contamination of Soils in Urban Areas. In: Bullock, P. and Gre-gory, P.J., Eds., Soils in the Urban Environment, Blackwell, Oxford, 47-75.
http://dx.doi.org/10.1002/9781444310603.ch4
and Tian, Q.Z. (2005) Assessment of Heavy Metal Pollution in Surface Soils of Urban Parks in Beijing, China. Chemosphere, 60, 542-551.
http://dx.doi.org/10.1016/j.chemosphere.2004.12.072
[19] Bennett, C.A. and Franklin, N.L. (1963) Statistical Analysis in Chemistry and the Chemical Industry. John Wiley and Sons, New York, Section 3, 44.
[20] Laskus, L., Bake, D., König, R., van der Meulen, A. and van Elzakker, B.G. (1989) Mea-surement of Particle Size Distribution and Dust Concentration. Staub, Reinhaltung der Luft, 49, 395-400.
[21] Adriano, D.C (2001) Trace Elements in Terrestrial Environments: Biogeochemistry, Bio-availability and Risks of Metals. 2nd Edition, Springer, New York, 867.
http://dx.doi.org/10.1007/978-0-387-21510-5
[22] Alloway, B.J. (1995) Heavy Metals in Soils. Blackie Academic and Professional, London. [23] Kisku, G.C., Barman S.C. and Bhrgava, S.K. (2000) Contamination of Soils and Plants with
Potentially Toxic Elements Irrigated with Mixed Industrial Effluent and Its Impact on the Environment. Water, Air & Soil Pollution, 120, 121-137.
http://dx.doi.org/10.1023/A:1005202304584
[24] Kabata-Pendias, A. and Pendias, H. (2001) Trace Element in Soils and Plants. CRC Press, London.
[25] Kabata-Pendias, A. and Piotrowska, M. (1999) Impact of Zn and Pb Smelter Flue-Dust on Cd, Zn and Pb Speciation in Soil and Their Availability to Spring Barley. Bulletin de l’Academie Serbe des Sciences et des Arts, 119, 77-82.
[26] Smith, A.H., Goycolea, M., Haque, R. and Biggs, M.L. (1998) Marked Increase in Bladder and Lung Cancer Mortality in a Region of Northern Chile Due to Arsenic in Drinking Wa-ter. American Journal of Epidemiology, 147, 660-669.
http://dx.doi.org/10.1093/oxfordjournals.aje.a009507
[27] Jung, M.C. (2001) Heavy Metal Contamination of Soils and Waters in and Around the Im-cheon Au-Ag Mine, Korea. Applied Geochemistry, 16, 1369-1375.
http://dx.doi.org/10.1016/S0883-2927(01)00040-3
[28] Li, X., Lee, S., Wong, S., Shi, W. and Thornton, I. (2004) The Study of Metal Contamination in Urban Soils of Hong Kong Using a GIS-Based Approach. Environmental Pollution, 129, 113-124. http://dx.doi.org/10.1016/j.envpol.2003.09.030
[29] Gowd, S.S., Reddy, M.R. and Govil, P.K. (2010) Assessment of Heavy Metal Contamination in Soils at Jajmau (Kanpur) and Unnao Industrial Areas of the Ganga Plain, Uttar Pradesh, India. Journal of Hazardous Materials, 174, 113-121.
http://dx.doi.org/10.1016/j.jhazmat.2009.09.024
[30] Muller, G. (1969) Index of Geoaccumulation in Sediments of the Rhine River. Journal of Geology, 2, 108-118.
[31] Lokeshwari, H. and Chandrappa, G.T. (2006) Heavy Metals Content in Water, Water Hya-cinth and Sediments of Laibagh Tank, Bangalore (India). Journal of Environmental Engi-neering and Science, 48, 183-188.
[32] Dineley, D., Hawkes, D., Hancock, P. and Williams, B. (1976) Earth Resources—A Dictio-nary of Terms and Concepts. Arrow Books Ltd., London, 205.
[33] Wei, C., Wang, C. and Yang, L. (2009) Characterizing Spatial Distribution and Sources of Heavy Metals in the Soils from Miningsmelting Activities in Shuikoushan, Hunan Province, China. Journal of Environmental Sciences, 21, 1230-1236.
http://dx.doi.org/10.1016/S1001-0742(08)62409-2
Types of Land Use in Beijing, China. Journal of Hazardous Materials, 186, 2043-2050.
http://dx.doi.org/10.1016/j.jhazmat.2010.12.104
[35] Thorpe, A. and Harrison, R.M. (2008) Sources and Properties of Non-Exhaust Particulate Matter from Road Traffic: A Review. Science of the Total Environment, 400, 270-282.
http://dx.doi.org/10.1016/j.scitotenv.2008.06.007
[36] Thomilson, D.C., Wilson, D.J., Harris, C.R. and Jeffrey, D.W. (1980) Problem in Heavy Metals in Estuaries and the Formation of Pollution Index. Helgoländer Meeresuntersu-chungen, 33, 566-575. http://dx.doi.org/10.1007/BF02414780
Submit or recommend next manuscript to SCIRP and we will provide best service for you:
Accepting pre-submission inquiries through Email, Facebook, LinkedIn, Twitter, etc. A wide selection of journals (inclusive of 9 subjects, more than 200 journals)
Providing 24-hour high-quality service User-friendly online submission system Fair and swift peer-review system
Efficient typesetting and proofreading procedure
Display of the result of downloads and visits, as well as the number of cited articles Maximum dissemination of your research work
![Table 2. Average concentration of As, Cd and Cr in studied area and compared with the per-missible concentration of heavy metal in soil according to [18]](https://thumb-us.123doks.com/thumbv2/123dok_us/7855101.736149/6.595.194.554.101.165/table-average-concentration-studied-compared-missible-concentration-according.webp)
![Table 5. Result of Geo Accumulation Index (GAI) compared with the average crustal abundant (background value) in uncontaminated soil, adopted from [32]](https://thumb-us.123doks.com/thumbv2/123dok_us/7855101.736149/10.595.192.553.100.380/result-accumulation-compared-average-crustal-abundant-background-uncontaminated.webp)
![Table 6. Results of As, Cd, Cr and their Contamination Factor (CF) and Pollution Load Index (PLI) compared with the average crustal abundance (background value) in un contaminated soil adopted from [32]](https://thumb-us.123doks.com/thumbv2/123dok_us/7855101.736149/11.595.192.553.114.413/results-contamination-pollution-compared-abundance-background-contaminated-adopted.webp)
