Munich Personal RePEc Archive
Impact of Credit Disbursement, Area
under Cultivation, Fertilizer
Consumption and Water Availability on
Rice Production in Pakistan (1988-2010)
Hussain, Anwar Hussain
Pakistan Instittute of Development Economics Islamabad Pakistan
2012
Online at
https://mpra.ub.uni-muenchen.de/41963/
IMPACT OF CREDIT DISBURSEMENT, AREA UNDER CULTIVATION,
FERTILIZER CONSUMPTION AND WATER AVAILABILITY ON RICE
PRODUCTION IN PAKISTAN (1988-2010)
ANWAR HUSSAIN
Pakistan Institute of Development Economics (PIDE), Islamabad – Pakistan.
ABSTRACT
This study estimates the impact of major agriculture inputs (credit disbursement, area under cultivation, fertilizer consumption and water availability) on total rice production in Pakistan using a time series ranging from 1988 to 2010. The study uses a log-linear Cobb-Douglas production function to estimate the impact and importance of these inputs. It finds that area under cultivation and water availability had a positive and statistically significant impact on rice production and the other two inputs had a positive but statistically insignificant impact. Estimation reveals that a 1% increase in area under rice cultivation brought a 1.64% increase in total rice production and a 1% increased in water availability increased total rice production by 0.87%. The insignificance of credit disbursement and fertilizer consumption indicates the presence of inefficiencies which begs for some policy attention.
Key Words: Credit disbursement, cultivated area, rice production, Cobb-Douglas
Citation: Hussain, A. 2012. Impact of credit disbursement, area under cultivation, fertilizer consumption and water availability on rice production in Pakistan (1988-2010). Sarhad J. Agric. 28(1): 95-101
INTRODUCTION
At present, rice is the staple food for more people than wheat — 2.7 billion people, almost half the world population and 90 per cent of total rice production is grown and consumed in Asia (Said et al. 2003). Rice also plays a pivotal role in the agriculture economy of Pakistan. Traditionally, rice cultivation in Pakistan has been concentrated in the central Punjab and north- western districts of Sindh, where both surface and sub-soil irrigation systems were well developed. In N.W.F.P, now known as KPK, most of the area under rice cultivation is situated in the high altitude mountainous valleys of Malakand and Hazara divisions, Malakand and Kurrum agencies and the attached tribal areas. It is the staple food of the local population in these hilly areas who largely depend on rice production and related activities.
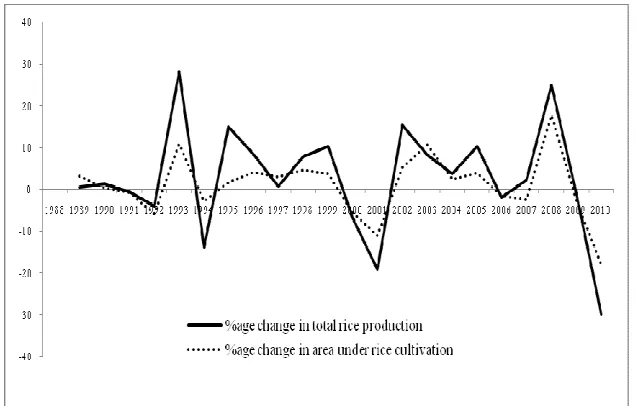
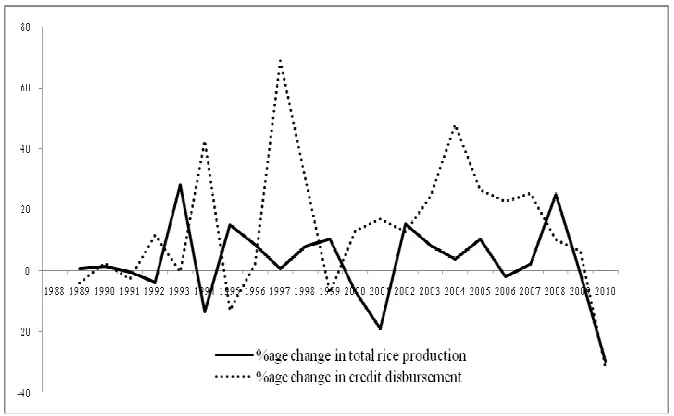
There existed ups and downs in area under cultivation, production and yield of rice in Pakistan. Figure 1 to 4 plot the time series of percentage changes in rice production together with percentage changes in area under rice cultivation, total credit disbursement, fertilizer consumption, and water availability. Fluctuations in area under rice cultivation seem to closely match fluctuations in total rice production relative to other inputs.
[image:2.612.148.466.496.699.2]Anwar Hussain. Impact of credit under cultivation, fertilizer and water on rice production in Pakistan … 96
Fig. 2. Percentage change in total rice production and credit disbursement in Pakistan
Fig. 3. Percentage change in total rice production and fertilizer consumption for rice in Pakistan
[image:3.612.130.478.253.684.2]Different studies about the different aspects rice crop have conducted in various areas. Bashir and Mehmood (2010) showed the impact of institutional credit on rice productivity in Lahore, Pakistan. They used primary data collected on the basis of stratified random sampling technique. They estimated the Cobb Douglas production function to determine the impact of credit on rice productivity. The explanatory variable (institutional credit) was found positive and statistically significant.
Prajneshu (2008) explored the usage of expected-value parameters in finding out the coefficients of Cobb-Douglas production function. He used this methodology for wheat yield based on time series data in Punjab, Pakistan. Haq et al., (2002) used Cobb-Douglas type of production function technique to find out the contribution of each input towards output. He investigated the relationship of farm size and input use and its effect on production and gross and net incomes of potato. Labour, Seed farmyard manure, nitrophos and labors were the factors significantly contributed towards output.
Iqbal et al., (2001) assessed the determinants of higher wheat productivity in irrigated areas of Pakistan, using primary data collected from irrigated areas of the country. To this end, they used modified Cobb-Douglas type production function. The major determinants found were number of common cultivations per acre, seed rate, number of irrigations total fertilizer nutrients applied, proportion of wheat acreage affected with lodging, proportion of wheat acreage weeded through chemical control, tenancy and institutional credit. Dipeolu and Kazeem (1997) used three functional forms, the linear, semi-logarithmic, and the double logarithmic (Cobb-Douglas production function), revealed that the farmers lacked adequate experience in the improved farming technologies. Further, average productivity of 0.994 t ha-1, which was low, compared to potential rice yields of 2-3 t ha-1.
Yao (1996) estimated Cobb-Douglas type production function to find out the impacts of various farm inputs on cereal crop production of the peasant farm sector in Ethiopia. He used major food crops including teff, wheat, maize, barley and sorghum for estimation. His findings revealed that about 90% changes in crop production were explained by land and labour. One percent increase in chemical fertilizers changed the total output by 10%. Kono (1996) used Cobb-Douglas production function to identify factors, which influence rice productivity in Taiwan. It was concluded that pump irrigation had enhanced economic performance among farmers who had adopted it as a supplementary irrigation instrument.
Dev and Hossain (1995) studied that under heterogeneous human resources and technological conditions, farm specific technical efficiency could be assessed either through incorporation of farmers' education and technology directly into the production function or through a two stage analysis, estimating farm specific technical efficiencies first and then regressing the technical efficiencies on different explanatory variables including farmers' education and the technology index.
Sreeja and Chandrabhanu (1995) used a Cobweb model to examine the way in which rice farmers respond to output with movements in prices. Results showed that the slope of the demand curve was greater than the slope of the supply curve of paddy; the price structure of paddy in Kerala followed a convergent Cobweb starting above the equilibrium. Projected values based on the model showed that the instability of supply behavior to adjust to changes in price should be changed to reduce the time lag in achieving equilibrium price and output. The production technology of the farmers was represented by the translogarithmic cost function. The own and cross price elasticities of factor demand were all inelastic indicating that farmers' response to changes in the price of inputs was small in magnitude. Rice production technology in Bangladesh appeared to be both labour and capital intensive. Guise (1969) used a Cobb-Douglas wheat yield function for New Zealand (1917-67). He assessed the impact of various factor mainly soil type, virus incidence, relative fertiliser price, acreage, livestock, a time-trend, temperatures and rainfall. The present study is different from the above studies conducted in the sense that here attempt has been made to show the impact of major agriculture inputs in general and particularly the credit disbursement and area under cultivation on rice production in Pakistan during 1988-2010.
MATERIALS AND METHODS
This paper studies the impact of major agriculture inputs in particular credit disbursement and area under cultivation on rice production in Pakistan. It uses annual data ranging from 1988 to 2010, obtained from the Economic Survey of Pakistan (various issues) and National Fertilizer Development Centre (2010). It checks the data for stationarity using Phillips Perron (PP) which is appropriate for such finite sample (Malik and Chaudhry, 2001).
Anwar Hussain. Impact of credit under cultivation, fertilizer and water on rice production in Pakistan … 98
To show the impact of major agriculture inputs (explanatory variables) on total rice production (dependent variable), the following model is estimated:
ln(TRP) = bo + b1 ln (AUC) + b2ln(CD) + b3ln (FC) + b4ln (WA) + εt (1)
Where
TRP = Total rice production (000, tonnes) in Pakistan
AUC = Area under rice cultivation (000, hectares) in Pakistan CD = Credit disbursement (Rs. in million) for agriculture in Pakistan FC = Fertilizer consumption for rice (000, nutrient tones) in Pakistan WA = Water availability (in million acre feet) in Pakistan
εt = Error term, absorbing the effect of all those variables which are not included in the model.
The included explanatory variables are logical and expected to have an impact on the dependent variable. The same type of model has been used by various researchers. Shehu, Mshelia and Tashikalma (2007); Prajneshu (2008); Srinivas and Ramanathan (2005); Hodges (1969); Wu (1975); Herath and Jayasuriya (1996) and Iqbal, Khan and Ahmad (2001).
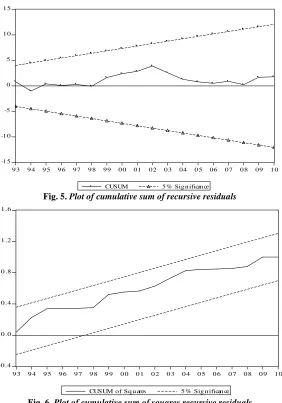
Furthermore, there may be the possibility of instability in parameters of the estimated model, for which the cumulative sum (CUSUM) and cumulative sum of square (CUSUMSQ) was employed. Plots of CUSUM and CUSUMSQ staying within the critical bonds of 5% level of significance implies that all the coefficients of the regression model estimated are stable and the null hypothesis cannot be rejected. The idea was proposed by Brown,
et al., (1975). To check for the structural breaks, these techniques were applied by various researchers including Ahmad and Qayyum (2008), Hasan and Nasir (2008) and Ploberger and Kr¨amer (1992).
A statistical package review is used for deriving the results.
RESULTS AND DISCUSSION
Table I and II report Phillips Perron test results. In (Table I) the stationarity of the data has been checked including intercept but not the trend while both intercept and trend were included in Table II. Variables which were not stationary at level were made stationary after taking the first difference denoted by I(1) and then the second difference i.e. I(2) if needed. According to Table I, lnTRP, lnAUC, lnCD, lnFC and lnWA are not stationary at level, these are therefore made stationary after taking the first difference. The results of stationarity are given in Table II, when both intercept and trend are included. The variables lnTRP, lnAUC, lnCD, lnFC and lnWA are made stationary after taking the first difference.
Table I Phillips Perron test results for stationarity (including intercept but not trend)
I(0) I(1)
Variable
Test Statistic Critical value Test Statistic Critical value Results
lnTRP -1.5934[0] -3.8 -4.2565[0] -3.8 I(1) lnAUC -1.8722[2] -3.8 -3.2525[2] -3.1 I(1) lnCD -0.2817[1] -3.8 -3.2403[1] -3.0 I(1) ln FC -2.1579[1] -3.8 -5.0481[0] -3.8 I(1) lnWA -2.4183[1] -3.8 -6.6400[1] -3.8 I(1)
Figures in square brackets besides each statistics represent optimum lags, selected using the minimum AIC value
Table II Phillips Perron test results for stationarity (including both intercept and trend)
I(0) I(1)
Variable
Test Statistic Critical value Test Statistic Critical value Results
lnTRP -3.3606[0] -4.4 -4.2594[0] -3.6 I(1) lnAUC -3.1064[0] -4.4 -3.4547[0] -3.3 I(1) lnCD -2.4440[0] -4.4 -3.7402[0] -3.6 I(1) lnFC -2.1435[0] -4.4 -4.9218[0] -4.6 I(1) lnWA -3.2978[0] -4.4 -6.9834[0] -3.6 I(1)
Figures in square brackets besides each statistics represent optimum lags, selected using the minimum AIC value
5% significance level (Table IV). In both the cases, the likelihood ratios exceed their corresponding critical values, indicating a long term relationship among the variables included.
Table III Cointegration test results including intercept no trend
Series: ln(TRP) ln(AUC) ln(CD) ln(FC) ln(WA) Lags interval: 1 to 1
Eigen value Likelihood Ratio 5 Percent Critical Value 1 Percent Critical Value Hypothesized No. of CE(s)
0.903036 122.4712 68.52 76.07 None ** 0.824577 73.46958 47.21 54.46 At most 1 ** 0.592489 36.91796 29.68 35.65 At most 2 ** 0.501253 18.06651 15.41 20.04 At most 3 * 0.151813 3.457733 3.76 6.65 At most 4 *(**) denotes rejection of the hypothesis at 5%(1%) significance level
L.R. test indicates 4 cointegrating equation(s) at 5% significance level
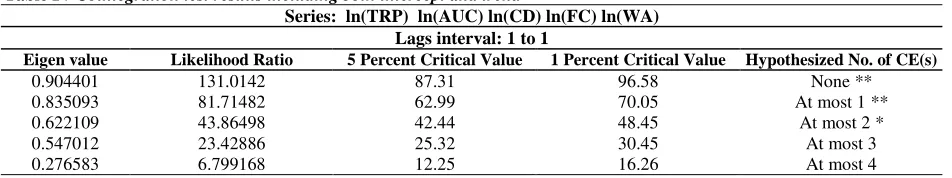
Table IV Cointegration test results including both intercept and trend
Series: ln(TRP) ln(AUC) ln(CD) ln(FC) ln(WA) Lags interval: 1 to 1
Eigen value Likelihood Ratio 5 Percent Critical Value 1 Percent Critical Value Hypothesized No. of CE(s)
0.904401 131.0142 87.31 96.58 None ** 0.835093 81.71482 62.99 70.05 At most 1 ** 0.622109 43.86498 42.44 48.45 At most 2 * 0.547012 23.42886 25.32 30.45 At most 3 0.276583 6.799168 12.25 16.26 At most 4 *(**) denotes rejection of the hypothesis at 5%(1%) significance level
L.R. test indicates 3 cointegrating equation(s) at 5% significance level
Regression results including the four independent variables (AUC, CD, FC and WA) are given in (Table V). The results indicate that 1% increase in area under rice cultivation brings 1.64% increase in total rice production. The result further indicates that 1% increase in credit disbursement for agriculture in Pakistan leads to an increase in total rice production by 0.017%. Similarly, 1% increase in the fertilizer consumption for rice leads to an increase in total rice production by 0.0009%. The total rice production increases by 0.87% when there is 1% change in the water availability. All the coefficients of the explanatory variables have positive signs, consistent with our a priori expectations. The coefficient of the area under cultivation and water availability are statistically significant at both 1% and 5% level of significance. Credit disbursement and fertilizer had a positive but insignificant impact on rice production. Overall model fitting is good as indicated by the F statistics. The value of Durbin-Watson statistic (2.05) is closer to 2, suggesting no autocorrelation problem in the model.
Table V Regression results including the variables TRP, AUC, CD, FC and WA Dependent Variable: ln(TRP)
Method: Least Squares
Sample: 1988 2010 Included observations: 23
Variable Coefficient Std. Error t-Statistic Prob.
C -8.719177 1.633792 -5.336774 0.0000 ln (AUC) 1.636305 0.172004 9.513168 0.0000 ln (CD) 0.017059 0.021616 0.789207 0.4403 ln (FC) 0.000874 0.050083 0.017452 0.9863 ln (WA) 0.868715 0.271372 3.201202 0.0049 R-squared 0.972330 Adjusted R-squared 0.966181
Durbin-Watson stat 2.051154
F-statistic 158.1320 Prob(F-statistic) 0.000000
What is interesting to note is that the sum of these coefficients is greater than 1, indicating increasing return to scale. In fact, the coefficient on area under cultivation is greater than 1, which implies increasing marginal product as oppose to diminishing marginal product to area under cultivation in Pakistan. One the one hand, this might sound counter intuitive, but on the other this points towards the possibility of inefficient use of area under cultivation at lower levels.
[image:6.612.70.546.235.324.2]Anwar Hussain. Impact of credit under cultivation, fertilizer and water on rice production in Pakistan … 100
plot of cumulative sum of recursive residuals and cumulative sum of squares recursive residuals are given in Figure 5 and 6, respectively.
-1 5 -1 0 -5 0 5 1 0 1 5
9 3 9 4 9 5 9 6 97 9 8 99 0 0 0 1 02 0 3 04 0 5 06 0 7 0 8 09 1 0
[image:7.612.166.448.96.499.2]CUSUM 5% Sign ificance
Fig. 5. Plot of cumulative sum of recursive residuals
-0 .4 0 .0 0 .4 0 .8 1 .2 1 .6
9 3 9 4 9 5 9 6 9 7 9 8 9 9 0 0 0 1 0 2 0 3 0 4 0 5 0 6 0 7 0 8 0 9 1 0
CUSUM o f Sq u ares 5 % Sig n ifican ce
Fig. 6. Plot of cumulative sum of squares recursive residuals
CONCLUSION AND RECOMMENDATIONS
Consistent with our a priori intuition this study finds a positive and statistically significant relationship between rice production and area under cultivation and water availability. It however find no significant, although of expected sign, relationship between rice production and credit disbursement and fertilizer consumption. In particular, a 1% increase in area under rice cultivation brings 1.64% increase in total rice production and a 1% increase in water availability increases rice production by 0.87%. These results send some policy alerts related to the ineffectiveness of credit disbursement and fertilizer consumption which are worth investigating.
REFERENCES
Ahmad, I. and A. Qayyum. 2008. Dynamic modeling of private investment in agriculture sector of Pakistan. The Pak. Dev. Rev. 47(4): 517-530.
Bashir, M.K. and Y. Mehmood. 2010. Institutional credit and rice productivity: a case study of District Lahore, Pakistan. China Agric. Econ. Rev. 2(4): 412 – 419.
Dev, U.K. and M. Hossain. 1995. Farmers' education, modern technology and technical efficiency of rice growers. Bangladesh J. Agric. Econ. 18(2): 1-13.
Dipeolu, A. and M.A. Kazeem. 1997. Economics of lowland rice production: A case study of the Itoikin irrigation project, lagos, Nigeria. Int’l. J. Tropic. Agric. 15(1/4): 31-35.
Food & Agric. Policy Res. Instt. 2010. http://www.fapri.iastate.edu/, Iowa State Univ. Ames, Iowa.
Fuss, M., D. McFadden and Y. Mundlak. 1978. A survey of functional forms in the economic analysis of production, in Melvyn, F. and McFadden, D. (eds), Production Econ. : A dual approach to theory and applications, 1, The Theory of Production, North-Holland Publish. Co. New York.
GoP. 2008-09. Pakistan Economic Survey. Govt. of Pakistan. Finance Div. Econ. advisor’s Wing, Islamabad, Pakistan.
Guise, J.W.B. 1969. Factors associated with the aggregate average yield of New Zealand wheat. Amer. J. Agric. Econ. 51: 866-81.
Hasan, A. and Z.M. Nasir. 2008. Macroeconomic factors and equity prices: an empirical investigation by using ARDL approach. The Pak. Dev. Rev. 47(4): 501-513.
Haq, Z.A., M. Khan and M. Ahmad. 2002. Role of farm size in input use and productivity of potato in Shigar Valley of Baltistan Area: an econometric analysis Sarhad J. Agric. 18(2): 245.
Herath, G. and S. Jayasuriya. 1996. Adoption of HYV technology in Asian countries: The role of concessionary credit revisited. Asian Survey. 36(12): 1184-1200.
Hodges, D.J. 1969. A note on Estimation of Cobb-Douglas and CES production function models. Econometrica. 37(4):721-725.
Iqbal, M., M.A. Khan and M. Ahmad. 2001. Determinants of higher wheat productivity in irrigated Pakistan. The Pak. Dev. Rev. 40(4): 753–766.
Kono, H. 1996. Economic analysis of Thai farmers' adoption of pumping irrigation method for ensuring profit in rice production. Res. Bullet. of Obihiro Univ. Natural Sci.19 (4): 45-51.
Mallik, G. and A. Chowdhury. 2001. Inflation and economic growth: evidence from four south Asian countries. Asia-Pacific Dev. J. 8(1): 123-135.
National Fertilizer Dev. Centre. 2010. Crop usage of fertilizer in Pakistan. Retrieved from http://www.nfdc.gov.pk/ on Oct. 3, 2011.
GoP. 2006-07. Pakistan Economic Survey. Govt. of Pakistan. Finance Div. Econ. Advisor’s Wing, Islamabad, Pakistan.
Ploberger, W. and W. Kr¨amer. 1992. The CUSUM test with OLS residuals. Econometrica. 60(2): 271–285.
Prajneshu. 2008. Fitting of Cobb-Douglas production functions: revisited. Agric. Econ. Res. Rev. 21: 289-292.
Said, A., A. Zada and M. Tahir. 2000. Improved cultural practices for profitable rice production in North West Frontier Province. TASRAN Computer Associate, Mingora, Swat, Pakistan.
Shehu, J.F., S.I. Mshelia and A.K. Tashikalma. 2007. Analysis of technical efficiency of small-scale rain-fed upland rice farmers in North-west agricultural zone of Adamawa State, Nigeria. J. Agric. & Social Sci. 3(4): 133–136.
Sreeja, S. and P. Chandrabhanu. 1995. Cobweb theory approach: An application to rice production in Kerala. J. Tropic. Agric. 33(1): 66-69.
Srinivas, T. and S. Ramanathan. 2005. A study on economic analysis of elephant foot yam production in India. Agric. Econ. Res. Rev. 18: 241-52.
Wu, D.M. 1975. Estimation of the Cobb-Douglas production function. Econometrica. 43(4): 739-744.