Munich Personal RePEc Archive
Explaining the Housing Bubble
Levitin, Adam and Wachter, Susan
12 April 2012
Online at
https://mpra.ub.uni-muenchen.de/41920/
RUNNING HEADER:EXPLAINING THE HOUSING BUBBLE
Explaining the Housing Bubble
ADAM J.LEVITIN &SUSAN M.WACHTER*
There is little consensus as to the cause of the housing bubble that
precipitated the financial crisis of 2008. Numerous explanations exist: misguided monetary policy; a global savings surplus; government policies encouraging affordable homeownership; irrational consumer expectations of rising housing prices; inelastic housing supply. None of these explanations, however, is capable of fully explaining the housing bubble.
This Article posits a new explanation for the housing bubble. First, it demonstrates that the bubble was a supply-side phenomenon, attributable to an excess of mispriced mortgage finance: mortgage-finance spreads declined and volume increased, even as risk increased—a confluence attributable only to an oversupply of mortgage finance.
Second, it explains the mortgage-finance supply glut as resulting from the failure of markets to price risk correctly due to the complexity, opacity, and heterogeneity of the unregulated private-label mortgage-backed securities (PLS) that began to dominate the market in 2004. The rise of PLS exacerbated
informational asymmetries between the financial institutions that intermediate mortgage finance and PLS investors. These intermediation agents exploited informational asymmetries to encourage overinvestment in PLS that boosted the financial intermediaries’ volume-based profits and enabled borrowers to bid up housing prices.
This Article proposes the standardization of PLS as an information-forcing device. Reducing the complexity and heterogeneity of PLS would facilitate accurate risk pricing, which is necessary to rebuild a sustainable, stable housing-finance market.
TABLE OF CONTENTS
*
Professor of Law, Georgetown University Law Center, and Richard B. Worley Professor of Financial
Management, Professor of Real Estate and Finance, The Wharton School, University of Pennsylvania, respectively. © 2012, Adam J. Levitin & Susan M. Wachter. The authors would like to thank Tom Adams, William Bratton, Greg Klass, Mike Konczal, Sarah Levitin, Susan Webber, and Robin West, for their comments and encouragement; Manuel Adelino, for sharing proprietary data; and Arthur Acoca-Pidolle, Igor Kleyman, Crystal Lu, Grant
INTRODUCTION ... 2
I. THE U.S.HOUSING-FINANCE MARKET ... 9
A. AGENCY SECURITIZATION ... 9
B. PRIVATE-LABEL SECURITIZATION ... 11
C. A TALE OF TWO BOOMS ... 14
D. FUELING THE PLS BOOM: THE RISE OF NONTRADITIONAL MORTGAGES ... 17
II. ASUPPLY-SIDE EXPLANATION OF THE HOUSING BUBBLE ... 22
A. EVIDENCE FROM PLS-YIELD SPREADS ... 22
B. TIMING THE BUBBLE ... 25
1. 1997–2000 ... 26
2. 2001–2003 ... 27
3. 2004–2006 ... 28
III. ALTERNATIVE THEORIES OF THE HOUSING BUBBLE ... 29
A. DEMAND-SIDE THEORIES ... 30
1. Mass Psychology and Irrational Exuberance ... 30
2. Fundamentals of Housing Supply ... 31
B. SUPPLY-SIDE THEORIES ... 32
1. Government Fair-Lending and Affordable-Housing Policy ... 32
2. Monetary Policy and the Global Supply of Credit ... 39
3. Market Relaxation of Underwriting Standards ... 43
IV. EXPLAINING THE OVERSUPPLY OF UNDERPRICED MORTGAGE CREDIT ... 44
A. ECONOMIC AGENTS EXPLOITING INFORMATION ASYMMETRIES ... 44
B. FAILURE OF NORMAL MARKET CONSTRAINTS ... 48
1. Credit Ratings ... 48
2. Subordinated-Debt Investors... 51
V. STANDARDIZATION AS AN INFORMATIONAL PROXY ... 64
INTRODUCTION
This Article explains the historic U.S. housing bubble. From 1997 to 2006, nominal U.S. housing prices rose 188%.1 By mid-2009, however, housing prices had fallen by 33% from peak.2 As the United States attempts to rebuild its housing-finance system, it is of paramount
importance to understand what caused the housing bubble. Until we understand how and why the housing bubble occurred, we cannot be certain that a reconstructed housing-finance system will not again produce such a devastating bubble.
There is little consensus about what caused the bubble,3 or even what part of the
housing-price appreciation between 1997 and 2006 was in fact a bubble.4 Some explanations, based on
1See S&P/Case–Schiller Housing Price Indices
, STANDARD & POORS,
http://www.standardandpoors.com/indices/sp-case-shiller-home-price-indices/en/us/?indexId=spusa-cashpidff--p-us---- (download file in the “Home Price Index Levels” row, “Seasonally Adjusted” column; view the “Composite-10 CSXR-SA” column in the spreadsheet) (last visited Jan. 9, 2012). When adjusted for inflation, the increase in housing prices was still an astounding 135%.
2
See id. On an inflation-adjusted basis, the peak-to-trough price decline was 38%.
3
macroeconomics, posit that the bubble was caused by excessively easy monetary policy. Thus, some scholars have argued that the bubble was the result of the Federal Reserve holding interest rates too low for too long, resulting in artificially cheap mortgage credit and stoked housing demand.5 Other scholars have pointed to the global savings glut that pushed down interest rates.6
Several commentators have fingered federal-government fair-lending and affordable-housing policies as encouraging mortgage lending to less creditworthy consumers.7 Other scholars have
emphasized the sharp deterioration in lending standards as contributing to the rise in housing prices,8 as well as the importance of changes to the mortgage-market institutional structure.9
4
See infra section II.B; cf. FIN. CRISIS INQUIRY COMM’N, THE FINANCIAL CRISIS INQUIRY REPORT:FINAL REPORT OF THE NATIONAL COMMISSION ON THE CAUSES OF THE FINANCIAL AND ECONOMIC CRISIS IN THE UNITED STATES 124–25 (2011) [hereinafter FIN. CRISIS INQUIRY COMM’N FINAL REPORT], available at
http://www.gpo.gov/fdsys/pkg/GPO-FCIC/content-detail.html (never expressing an official view of when the bubble began but implying that it started after the Federal Reserve lowered interest rates in 2001); id. at 417–18, 424 (Keith Hennessey, Douglas Holtz-Eakin & Bill Thomas, dissenting) (arguing the bubble began in the late 1990s); id. at 445 (Peter J. Wallison, dissenting) (identifying the housing bubble as occurring between 1997 and 2007).
5
See JOHN B. TAYLOR, GETTING OFF TRACK: HOW GOVERNMENT ACTIONS AND INTERVENTIONS CAUSED, PROLONGED, AND WORSENED THE FINANCIAL CRISIS1–6 (2009).
6See
Ricardo J. Caballero & Arvind Krishnamurthy, Global Imbalances and Financial Fragility, 99 AM. ECON. REV. 584, 584 (2009); Ben S. Bernanke et al., International Capital Flows and the Returns to Safe Assets in the United States, 2003–2007, at 1–3 (Bd. of Governors of the Fed. Reserve Sys., Int’l Fin. Discussion Papers No. 1014, 2011) [hereinafter Bernanke, International Capital Flows], available at
http://www.federalreserve.gov/pubs/ifdp/2011/1014/ifdp1014.htm; Steven Dunaway, Global Imbalances and the Financial Crisis, Council on Foreign Relations, Council Special Report No. 44 (2009); Ben S. Bernanke, Chairman, Fed. Reserve Sys., Bundesbank Lecture: Global Imbalances: Recent Developments and Prospects (Sept. 11, 2007) [hereinafter Bernanke, Global Imbalances], available at
http://www.federalreserve.gov/newsevents/speech/bernanke20070911a.htm; Ben S. Bernanke, Chairman, Fed. Reserve Sys., Sandridge Lecture at the Virginia Association of Economists: The Global Saving Glut and the U.S. Current Account Deficit (Mar. 10, 2005) [hereinafter Bernanke, Global Saving Glut], available at
http://www.federalreserve.gov/boarddocs/speeches/2005/200503102/;
7See, e.g.
, THOMAS SOWELL, THE HOUSING BOOM AND BUST 30–56 (2009); FIN. CRISIS INQUIRY COMM’N FINAL REPORT, supra note 4, at 444 (Peter J. Wallison, dissenting) (“[T]he sine qua non of the financial crisis was U.S. government housing policy, which led to the creation of 27 million subprime and other risky loans—half of all mortgages in the United States—which were ready to default as soon as the massive 1997–2007 housing bubble began to deflate. If the U.S. government had not chosen this policy path—fostering the growth of a bubble of unprecedented size and an equally unprecedented number of weak and high risk residential mortgages—the great financial crisis of 2008 would never have occurred.”); PETER J. WALLISON, AM. ENTER. INST., CAUSE AND EFFECT: GOVERNMENT POLICIES AND THE FINANCIAL CRISIS 2 (2008),
http://www.aei.org/files/2008/11/25/20081203_1123724NovFSOg.pdf; Edward Pinto, Op-Ed., Acorn and the Housing Bubble,WALL ST. J. (Nov. 12, 2009, 7:10 PM),
http://online.wsj.com/article/SB10001424052748703298004574459763052141456.html (“The flood of CRA and affordable-housing loans with loosened underwriting standards, combined with declining mortgage interest rates . . . resulted in a massive increase in borrowing capacity and fueled a house price bubble of unprecedented magnitude over the period 1997–2006.”);Peter J. Wallison, The True Origins of This Financial Crisis, AM. SPECTATOR, Feb. 2009, available at http://spectator.org/archives/2009/02/06/the-true-origins-of-this-finan/print.
8
See Yuliya Demyanyk & Otto Van Hemert, Understanding the Subprime Mortgage Crisis, 24 REV. FIN. STUDIES 1848, 1852 (2011); Kurt Eggert, The Great Collapse: How Securitization Caused the Subprime Meltdown, 41 CONN. L. REV. 1257, 1257 (2009) (arguing that securitization encouraged market participants to weaken underwriting standards); Patricia A. McCoy, Andrey D. Pavlov & Susan M. Wachter, Systemic Risk Through Securitization: The Result of Deregulation and Regulatory Failure, 41 CONN. L. REV. 1327, 1366–67 (2009) (arguing the ability to pass off risk allowed lenders who lowered standards to gain market share and crowd out competing lenders who did not weaken credit standards); Giovanni Dell’Ariccia, Deniz Igan & Luc Laeven, Credit Booms and Lending Standards: Evidence from the Subprime Mortgage Market 1 (Int’l Monetary Fund, Working Paper No. WP/08/106, 2008),
Other explanations of the bubble have been demand-side explanations, meaning that the bubble was caused by excessive consumer demand for housing. One leading explanation argues that the bubble was the result of irrational demand encouraged by a belief that housing prices could only move upwards.10 Other research points to the fundamentals of housing markets,
particularly population growth, placing upward pressures on housing prices in markets with inelastic housing supply, thereby explaining some of the geographic variation in the housing bubble.11
In this Article, we challenge the existing explanations of the housing bubble as, at best, incomplete. While we recognize the bubble as multicausal, we set forth a new and, we believe, more convincing explanation of what was the primary driver of the bubble. We argue that the bubble was, in fact, primarily a supply-side phenomenon, meaning that it was caused by excessive supply of housing finance. The supply glut was not due to monetary policy or
government affordable-housing policy, although the former did play a role in the development of the bubble. Instead, the supply glut was the result of a fundamental shift in the structure of the mortgage-finance market from regulated to unregulated securitization.
The unregulated, private securitization market is rife with information asymmetries between financial institutions and investors. These asymmetries were exploited by financial institutions at the expense of investors (which often included other units of the same institutions), who
underpriced for risk and thus oversupplied mortgage credit, while the financial institutions siphoned away profit on every transaction. The primary cause of the housing bubble was the shift from regulated, government-sponsored securitization to unregulated, private securitization as the principal method of funding mortgage loans.
We do not claim that the shift in the securitization market was the sole cause of the housing bubble; other factors undoubtedly contributed in important ways. We do claim, however, that this market shift from a regulated to an unregulated financing market was the leading cause of the bubble, and that without it there would not have been a bubble. In other words, the
areas with higher mortgage securitization rates”); cf. Christopher L. Peterson, Predatory Structured Finance,28 CARDOZO L. REV. 2185, 2188–90 (2007) (describing how securitization facilitated predatory lending).
9
See Benjamin J. Keys et al., Did Securitization Lead to Lax Screening? Evidence from Subprime Loans, 125 Q.J. ECON. 307, 307–310 (2010) [hereinafter Keys et al., Did Securitization Lead to Lax Screening?]; Benjamin J. Keys et al., Financial Regulation and Securitization: Evidence from Subprime Loans, 56 J. MONETARY ECON. 700, 702 (2009) [hereinafter Keys et al., Financial Regulation and Securitization]; Atif Mian & Amir Sufi, The Consequences of Mortgage Credit Expansion: Evidence from the U.S. Mortgage Default Crisis,124 Q.J. ECON. 1449, 1449–50 (2009) [hereinafter Mian & Sufi, The Consequences of Mortgage Credit Expansion] (finding correlation, unassociated with income growth, between an increase in mortgage securitization and the expansion of mortgage credit in subprime ZIP codes); Atif R. Mian & Amir Sufi, Household Leverage and the Recession of 2007 to 2009, at 6–7(Nat’l Bureau of Econ. Research, Working Paper No. 15896, 2010) [hereinafter Mian & Sufi, Household Leverage and the Recession of 2007 to 2009] (finding that home-equity borrowing was responsible for a large share of the rise in household leverage during the bubble, as well as for a large portion of the defaults).
10
See generally ROBERT J. SHILLER, IRRATIONAL EXUBERANCE (2d ed. 2005) (arguing this thesis). An alternative demand-side theory looks to behavioral economics and suggests that consumers’ cognitive failure to disentangle real and nominal interest rates results in an overestimation of the value of real estate in times of falling inflation. See
Markus K. Brunnermeier & Christian Julliard, Money Illusion and Housing Frenzies, 21 REV. FIN. STUD. 135, 135– 36 (2008) (arguing that consumers cannot disentangle real and nominal changes in interest rates and rents, which results in their failing to recognize that when expected inflation falls, future price and rent appreciation—and not just nominal interest rates—also fall).
11
explanation we present of the housing bubble is deregulation of housing finance. This was not primarily deregulation through legislation.12 Instead, the critical deregulation was the failure to
ensure that existing regulatory schemes applied to the mortgage products irrespective of their financing channel.
From 1997, when housing prices began to rise, through 2003, the appreciation in the housing market can be explained by fundamental economic values—the cost of purchasing a home relative to renting and interest rates. These fundamentals suggest that house prices were not overvalued. After 2003 and 2004, however, fundamentals cease to explain housing prices. The market shifted from financing mortgages with regulated securitization to using unregulated securitization. The unregulated securitization market featured complex, opaque, and
heterogeneous products with serious informational asymmetries between financial intermediaries and investors. Because of the nature of these products, investors underpriced risk, overvalued securities, and oversupplied mortgage finance. The oversupply of mortgage credit enabled borrowers to bid up housing prices, thereby fueling a bubble as higher housing prices enabled a greater supply of credit for refinanced mortgages by increasing the apparent value of the collateral. This cycle of higher home prices and refinancing boosted financial intermediaries’ volume-based profits, which encouraged them to continue the cycle.
Securitization—the pooling of loans and the issuance of securities backed by the cash flow from those loans—provides the financing for the vast majority of mortgages in the United States. Mortgage securitization involves a chain of financial institutions intermediating between two parties: capital markets, which supply mortgage credit, and borrowers, who consume mortgage credit. The financial institutions that originate and securitize loans serve as economic (but not legal) agents for the end borrowers and lenders. In their intermediation role, these financial institutions do not hold more than a temporary interest in the mortgages they facilitate, so they have incentives different from (and often adverse to) borrowers and investors, the economic principals in mortgage transactions.
Prior to 2003 and 2004, most mortgage-backed securities (MBS) were issued by regulated government-sponsored entities13 (GSEs) Fannie Mae14 and Freddie Mac15 and the federal agency
Ginnie Mae16 (collectively the Agencies). In 2003 and 2004, the market shifted radically toward
MBS issued by unregulated “private-label” securitization conduits, typically operated by investment banks. The shift from regulated Agency to unregulated private-label securitization
12
See FIN. CRISIS INQUIRY COMM’N FINAL REPORT, supra note 4, at 74–80. Deregulatory legislation, such as the Commodities Futures Modernization Act of 2000, Pub. L. No. 106-554, app. E, § 407, 114 Stat. 365, 2763A-461 (codified in scattered sections of 7 U.S.C.) (excluding covered-bank swap agreements from Commodity Futures Trading Commission jurisdiction) and the Bankruptcy Abuse Prevention and Consumer Protection Act of 2005, Pub. L. No. 109-8, §§ 901–07, 119 Stat. 23, 146–83 (codified in scattered sections of11 U.S.C.) (broadening financial-contract safe harbors in bankruptcy) did contribute to the housing bubble, as did the failure of the Federal Reserve to act on its existing authority under the Home Owners Equity Protection Act (HOEPA) to rein in predatory lending. See also Donald P. Morgan, Benjamin Iverson & Matthew Botsch, Subprime Foreclosures and the 2005 Bankruptcy Reform, FRBNY ECON. POL’Y REV., forthcoming, available at
http://www.newyorkfed.org/research/epr/forthcoming/1102morg.pdf (arguing that the Bankruptcy Abuse Prevention and Consumer Protection Act of 2005 made it more difficult for debtors to free up income to pay their mortgages by discharging unsecured debt, thereby contributing to subprime-mortgage foreclosures).
13
Historically, the GSEs were federal agencies. Since 1968, they have been privately owned but chartered by the federal government and subject to federal regulation.
14
Fannie Mae is a portmanteau for Federal National Mortgage Association.
15
Freddie Mac is a portmanteau for the Federal Home Loan Mortgage Corporation.
16
created a “shadow-GSE” sector, just as the highly regulated banking sector was displaced by an unregulated “shadow-banking” sector.17
The shift in securitization channels occurred as financial institutions sought to maintain earnings levels that had been elevated between 2001 and 2003, when historically low interest rates created an unprecedented refinancing boom. Earnings depended on volume, so maintaining elevated earnings levels necessitated expanding the borrower pool by using lower underwriting standards and new products that the Agencies would not (initially) securitize. Thus, the shift from Agency securitization to private-label securitization also corresponded with a shift in mortgage product—from traditional, amortizing, fixed-rate mortgages (FRMs) to nontraditional, structurally riskier, nonamortizing, adjustable-rate mortgages (ARMs)—and with the start of a sharp deterioration in mortgage-underwriting standards.
The growth of private-label securitization resulted in the oversupply of underpriced housing finance. As we demonstrate empirically, starting in 2003 and 2004, risk premiums for housing finance fell, and the market expanded even as market risk was rapidly rising. This set of circumstances—a decrease in risk-adjusted price coupled with an increase in quantity—can occur only because of an increase in the supply of housing finance that outpaces any increase in demand. In other words, demand-side factors like irrational consumer demand and inelastic housing supply may have played a role in the bubble, but their total effect on increased consumer demand was less than the increase in the supply of housing finance.
Private-label mortgage-backed securities (PLS) facilitated overinvestment because they are informationally opaque.18 PLS and the nontraditional mortgages they finance are heterogeneous,
complex products.19 The structure of these products made it very difficult to gauge accurately,
and hence price, their risk. The heterogeneity of the PLS made PLS illiquid and prevented price discovery through market trades. In the presence of such informational opacity, informational asymmetries between the financial-institution sellers of PLS and PLS investors abounded.
Financial institutions exploited these informational asymmetries to boost
mortgage-origination and securitization volume and thus their profits, which are derived from fees taken at every stage of the origination and securitization process. In this fee-driven business model,
17Cf.
ZOLTAN POZSAR ET AL., FED. RESERVE BANK OF N.Y., SHADOW BANKING 1–4 (2010), available at
http://www.ny.frb.org/research/staff_reports/sr458.pdf (describing shadow banking as a financing system relying on short-term debt obligations other than insured deposits).
18
Cf. Steven L. Schwarcz, Rethinking the Disclosure Paradigm in a World of Complexity, 2004 U. ILL. L. REV. 1, 19 (arguing that many securities transactions are “so complex that less than a critical mass of investors can understand them in a reasonable time period . . . [so that] the market will not reach a fully informed price equilibrium, and hence will not be efficient”).
19
increased volume meant increased profit, so financial institutions were incentivized to make and securitize as many mortgages as possible.
Increasing the total value of mortgages for securitization necessitated expanding the pool of mortgage borrowers. This required lowering underwriting standards and promoting
nontraditional mortgage products with initially affordable payments. The easy-mortgage credit that resulted from the growth of PLS enabled housing prices to be bid up, thereby creating a bubble that collapsed, like a pyramid scheme, once the market could no longer be expanded.
Correcting the informational failures in housing finance is critical for preventing future bubbles. Real estate is an area that is uniquely prone to bubbles because of the lack of short pressure. For either markets or regulators to prevent bubbles, real-time information about the cost of credit is required because asset bubbles are built on the shoulders of leverage. The cost of credit is determined by the interest rate and the risk premium. The former is easily observable but the latter—which includes underwriting standards—cannot be observed in real time. For markets and regulators to prevent bubbles, they must be able to observe the credit risks in financing.
Greater disclosure is insufficient by itself to reveal the character of credit in the housing-finance market because of the difficulties in modeling credit risk for heterogeneous, complex products that have only a short track record. Correcting the informational failures in housing finance requires not only better disclosure about the mortgage loans backing MBS, but also substantive regulation—including standardization of mortgage-underwriting practices, mortgage forms, and MBS credit structures—in order to make disclosures effective. Put differently, disclosure-based regulation in the housing-finance market can only be effective when it is coupled with regulation of substantive terms in order to make risks salient and therefore
priceable. Product standardization makes risks salient by focusing analysis on narrow parameters for variation.
Standardization of MBS would not mean that financial institutions could not offer nontraditional mortgages, only that they could not sell them into capital markets. There are appropriate niches for nontraditional products, but the informational asymmetries and principal– agent problems endemic to securitization counsel for restricting these exotic products to banks’ books. Instead, secondary-market standardization facilitates the transparency of the character of credit and therefore is critical to preventing future real-estate bubbles and ensuring a stable and sustainable housing-finance system.
It bears emphasis that we are not propounding a monocausal explanation of the bubble; the bubble was the product of numerous factors. Rather, our claim is that the bubble was primarily a supply-side phenomenon and the supply-side glut was driven first and foremost by information failures resulting from the proliferation of PLS. Our explanation is consistent with arguments that there was an increase for demand in housing. We claim only that the supply grew faster than the demand and that this supply growth was fueled by the change in the financing channel. Moreover, explaining the oversupply of mortgage credit as being primarily a result of
information failures does not deny the role of agency problems or even affordable-housing policy. Without the shift in the securitization market and the resulting oversupply of housing finance, however, there would never have been a bubble of anything close to the magnitude of the bubble between 2004 and 2007.
Part II of the Article presents a new explanation of the housing bubble. It demonstrates that the bubble was a supply-side phenomenon that began in 2003 and 2004 and that it corresponded with a shift in the mortgage-securitization market from Agency securitization of traditional FRMs to private-label securitization of nontraditional ARMs. Section II.A presents new data on PLS pricing that shows that risk-adjusted spreads on PLS over Treasuries declined during the bubble even as PLS volume rose. In other words, the price of mortgage finance decreased while the quantity was increasing. This phenomenon is only consistent with an outward (rightward) shift in the housing-finance supply curve that outstripped any shift in the demand curve.
Section II.B turns to the timing of the bubble, a matter of some controversy, and a critical shibboleth for any theory of the bubble. We argue that the best evidence points to the bubble as a short-lived phenomenon that began in 2003 and 2004 and ended by 2007. The combination of the supply-side nature of the bubble and the timing of the bubble aligns with the timing of the growth and expansion of private-label securitization.
Part III turns to a consideration of theories of the housing bubble: irrational exuberance; inability of consumers to distinguish real and nominal interest rates, resulting in excess consumer demand; housing-supply inelasticity; affordable-housing policies; and monetary policy and global savings imbalances. It shows that they are, at best, incomplete and, at worst, contrary to all evidence.
Part IV explains why the oversupply of mispriced mortgage finance was the result of the shift to unregulated private-label securitization. A shift in financing channels does not itself make a bubble, but the shift to private-label securitization enabled the financial institutions involved in PLS to exploit informational asymmetries between securitizers and investors. The result was investors mispricing risk and oversupplying mortgage capital, thereby boosting the profits of financial-institution intermediaries and encouraging further expansion of the PLS market.
Part IV also shows how, in the PLS market, the normal market constraints on declining mortgage quality and MBS underwriting quality—credit ratings, debt-market discipline
(including limited risk appetite from savvy, subordinated-debt investors), and short pressures— all failed, thereby enabling a bubble.
Part V concludes with a call for standardization of MBS as an information-forcing device, and a proposal for restricting securitization to a limited set of proven, traditional mortgage products.
Our Article makes five novel contributions to the literature on the housing bubble and the financial crisis. First, we present new empirical evidence that proves the bubble was a supply-side, rather than a demand-supply-side, phenomenon. Pinpointing the cause of the housing bubble is critical for evaluating whether and how future asset bubbles, particularly in housing, can be prevented.
Second, we present a failure-to-regulate theory of the housing bubble that explains the oversupply of underpriced mortgage credit. The bubble grew because housing finance was permitted to shift from a regulated to an unregulated space, where financial institutions were able and incentivized to exploit informational asymmetries. The bubble was not the result of
regulation, but of a lack of regulation. Our theory explains why normal market constraints on excessive risk failed, why the bubble grew when it did, and why it collapsed when it did. Existing theories of the housing bubble have thus far been incapable of explaining the timing of the bubble or of accounting for the dramatic shift in the mortgage market’s structure.
about this market, even though mortgage-related securities are the largest single asset class in the United States economy. What limited literature there is focuses on the regulation of certain segments of the market; we know of no prior work that addresses larger questions of institutional and market structure and the place for regulation.
Our focus on a lack of regulation is, in some ways, a departure from the general mien of legal scholarship, which focuses on an analysis of regulation, not the absence thereof. Lack of
regulation, however, is itself a regulatory choice, making the study of the lack of regulation squarely within the purview of legal analysis. In essence, then, our argument emphasizes the need for law throughout the secondary housing-finance market. In our conclusion, we argue for regulation of the housing-finance market and explain how we think such regulation should proceed.
Fourth, our Article is the first to present a systematic analysis of the housing bubble that evaluates the competing theories and presents a coherent, empirically driven narrative of the bubble’s development and collapse. The existing literature is comprised of expositions of various theories that largely ignore competing theories,20 arguments that debunk theories but do
not propound alternative theories,21 or empirical studies that attempt to establish micropoints but
do not attempt to present a larger theory of the housing bubble.22
Finally, our Article presents a clear prescription for ensuring future stability in housing finance, which has profound implications for the restructuring of the housing-finance market and the fate of the government-sponsored entities Fannie Mae and Freddie Mac.
I. THE U.S.HOUSING-FINANCE MARKET
A. AGENCY SECURITIZATION
Most U.S. mortgages are financed through securitization.23 Mortgage securitization involves
the pooling of numerous mortgage loans, which are then sold to a special-purpose vehicle, typically a trust. The trust pays for the loans by issuing debt securities. The debt service on these securities is paid for by the cash flow from the mortgages. Thus, the securities are called mortgage-backed securities (MBS).24
Securitization, in its modern form, had been used since before 1971 for housing finance.25 In
the early 1990s, the secondary market at the time consisted primarily of the GSEs, Fannie Mae
20See, e.g.
,FIN. CRISIS INQUIRY COMM’N FINAL REPORT, supra note 4, at 444 (Peter J. Wallison, dissenting); TAYLOR, supra note 5; WALLISON, supra note 7; Pinto, supra note 7.
21
See, e.g.,Ben S. Bernanke, Chairman, Fed. Reserve Sys., Speech at the Annual Meeting of the American Economic Association: Monetary Policy and the Housing Bubble (Jan. 3, 2010), available at
http://www.federalreserve.gov/newsevents/speech/bernanke20100103a.htm; Glaeser et al., supra note 3, at 1–2.
22
See, e.g.,Keys et al., Did Securitization Lead to Lax Screening?, supra note 9; Mian & Sufi, The Consequences of Mortgage Credit Expansion, supra note 9; Atif Mian & Amir Sufi, The Great Recession: Lessons from
Microeconomic Data, 100 AM. ECON. REV: PAPERS & PROCEEDINGS 1, 2 (2010).
23See
INSIDE MORTG. FIN., 2010 MORTGAGE MARKET STATISTICAL ANNUAL (2010) (Microsoft Excel supplemental files). About 60% of outstanding mortgages, by dollar amount, are securitized, but the securitization rate in recent years has been around or above 90%. Id.
24
For a more detailed explanation of mortgage securitization, see Anna Gelpern & Adam J. Levitin, Rewriting Frankenstein Contracts: Workout Prohibitions in Residential Mortgage-Backed Securities, 82 S. CAL. L. REV. 1075, 1080–87 (2009).
25
and Freddie Mac, and Ginnie Mae. The GSEs are privately owned corporations, chartered and regulated by the federal government.26 Fannie and Freddie were regulated entities and would
purchase (until the bubble years) only mortgages that conformed to their underwriting standards, which generally required prime, amortizing mortgages. Ginnie Mae is a U.S.-government agency involved in the securitization of mortgages insured by the Federal Housing
Administration (FHA) or guaranteed by the Veterans Administration (VA).27 Moreover, statutes
limited the GSEs’ exposure on any particular loan to the conforming-loan limit and restricted the GSEs to purchasing only loans with loan-to-value (LTV) ratios—the ratio of the loan amount to the property’s value—under 80%, absent private mortgage insurance or seller risk retention.28
Further, the GSEs were expected (although not mandated) to operate nationally, creating geographic diversification in their underwriting. Likewise, the FHA and VA mortgages that went into Ginnie Mae pools were required to conform to FHA and VA underwriting standards and were geographically diverse.
The GSEs securitize most of the mortgages they purchase, meaning that they sell the mortgages to legally separate, specially created trusts, which pay for the mortgages by issuing MBS. The GSEs and Ginnie Mae guarantee timely payment of principal and interest to investors.29 Fannie, Freddie, and Ginnie MBS (Agency MBS) thus link mortgage borrowers
with capital-market investors.
For Agency MBS, investors assumed the interest-rate risk on the underlying mortgages, while the GSEs or U.S. government assumed the mortgages’ credit risk. Investors in Agency MBS did incur credit risk—that of the GSEs or of the U.S. government, for Ginnie Mae MBS. For GSE MBS, investors also indirectly assumed the credit risk on the mortgages, because the GSEs’ financial strength was heavily dependent upon the performance of the mortgages.
Because the GSEs were perceived as having an implicit guarantee from the federal government,30
however, investors were generally unconcerned about the credit risk of the GSEs, and hence of their MBS.31 This meant that investors did not need to worry about the quality of the GSE
CENTURY 261, 261–64 (Michael D. Bordo & Richard Sylla eds., 1995). See generally William N. Goetzmann & Frank Newman, Securitization in the 1920’s (Nat’l Bureau of Econ. Research, Working Paper No. 15650, 2010) (discussing mortgage securitization in the 1920s).
26
The GSEs originated as part of the federal government but were privatized in 1968.
27
In addition to Fannie Mae and Freddie Mac, there were twelve Federal Home Loan Banks, which comprised a smaller GSE system. See Mark J. Flannery & W. Scott Frame, The Federal Home Loan Bank System: The “Other” Housing GSE, ECON. REV., Third Quarter 2006, at 33, 33 (examining the structure, activities, and risks of the Federal Home Loan Bank system).
28
See 12 U.S.C. §§ 1454(a)(2), 1717(b)(2) (2006).
29
FHA and VA guarantee repayment of principal and accrued interest but not necessarily in a timely fashion. FHA and VA only pay out after foreclosure, which can mean that the insurance payments are considerably delayed.
30See
Brent W. Ambrose & Arthur Warga, Measuring Potential GSE Funding Advantages, 25 J. REAL EST. FIN. & ECON. 129, 146 (2002) (finding the GSE-to-Treasuries spread was 25–29 basis points less than AA-rated banking-sector bonds); Frank E. Nothaft, James E. Pearce & Stevan Stevanovic, Debt Spreads Between GSEs and Other Corporations, 25 J. REAL EST. FIN. & ECON. 151, 151 (2002) (finding that GSEs had a funding advantage of 22–30 basis points relative to AA-rated bonds). The GSEs are now in federal conservatorship, and their obligations carry an “effective guarantee” from the federal government but do not enjoy a “full faith and credit” backing. See Dawn Kopecki, Fannie, Freddie Have ‘Effective’ Guarantee, FHFA Says, BLOOMBERG (Oct. 23, 2008, 14:06 EDT), http://www.bloomberg.com/apps/news?pid=20601087&sid=aO5XSFgElSZA&refer=home (referencing the director of the Federal Housing Finance Agency as saying that GSEs have an “effective” federal guarantee); 12 U.S.C. § 1719(e) (2006) (explicitly stating that GSE debts are not government debts). The difference, if any, between “full faith and credit” and an “effective guarantee” is unclear.
31
underwriting. Therefore, investors did not need information about the default risk on the mortgages; what they cared about was information that could help them anticipate prepayment speeds so they could gauge the MBS’ convexity risk—the risk of losses resulting from adverse changes in MBS’ market price relative to their yield.32 This information was fairly easy to
obtain, particularly on standardized mortgage products, and modeling and pricing the interest-rate risk was a far simpler task than modeling the credit risk and the interest-interest-rate risk.
Historically, because the GSEs bore the credit risk on the mortgages, they were incentivized to insist on careful underwriting.33 Moreover, the GSEs were subject to regulatory oversight and
statutory constraints on underwriting. By statute, the GSEs were limited to purchasing only loans with less than 80% LTV ratios unless there was private mortgage insurance on the loan.34 The
competition for market share was primarily between GSEs, and consistently applied regulatory standards ensured that neither could increase market share by lowering underwriting standards. Thus, as long as GSE securitization dominated the mortgage market, credit risk was kept in check through underwriting standards, and there was not much of a market for nonprime, nonconforming, conventional loans.
B. PRIVATE-LABEL SECURITIZATION
Beginning in the 1990s, a new, unregulated form of securitization began to displace GSE securitization. This was private-label securitization (PLS), which was supported by a new class of specialized mortgage lenders and securitization sponsors.35
Whereas the GSEs would only purchase loans that conformed to their underwriting
guidelines, there were no such guidelines for the investment banks that served as PLS conduits. The only constraint was whether a buyer could profitably be found. Thus, PLS created a market for nonprime, nonconforming conventional loans.36
32
Admittedly, defaults affect prepayment speed, but, in GSE securitized pools, the GSEs replace defaulted loans with performing ones so prepayment speed should be largely unaffected.
33
The possibility of a federal bailout by virtue of being too big to fail raised moral-hazard problems for the GSEs and could have undermined their underwriting quality. The GSEs only invested in highly rated tranches of subprime and alt-A MBS, and these tranches were vulnerable to ratings downgrades. As AAA-subprime MBS were
downgraded, the GSEs were forced to recognize large losses in their trading portfolios. Because the GSEs were highly leveraged, these losses ate heavily into the GSEs’ capital, which undermined their MBS guarantee business (the GSEs’ guarantee is only valuable to the extent that the GSEs are solvent).
34
See 12 U.S.C. §§ 1454(a)(2), 1717(b)(2).
35
We use the term PLS here to refer to residential mortgage-backed securities (RMBS) that lack a guarantee from the federal government or the GSEs. Although PLS can trace their pedigree back to a 1977 deal by Bank of America,see Bank of Am. Nat’l Trust & Sav. Assoc., SEC No-Action Letter, 1977 SEC No-Act. LEXIS 1343 (May 19, 1977), they remained a niche market for years because of their unproven risk profile. Gretchen Morgenson and Joshua Rosner cite a 1993 United Companies Financial securitization as the first securitization of nonprime mortgages. GRETCHEN MORGENSON & JOSHUA ROSNER, RECKLESS ENDANGERMENT: HOW OUTSIZED AMBITION, GREED, AND CORRUPTION LED TO ECONOMIC ARMAGEDDON 48–50 (2011). The nonprime securitization market, however, predates this deal. See, e.g.,ANTHONY LEMBKE & PETER DIMARTINO, “B” AND “C” BORROWERS: A NEW FRONTIER IN THE NONAGENCY MARKET 8 (1994), available at
http://www.greeradvisors.com/Research_files/B_and_C_Borrowers_-_A_New_Frontier_in_the_Nonagency_Market.pdf (citing 1992 deals).
36
As with GSE securitization, PLS involved the pooling of thousands of mortgage loans that were then sold to specially created trusts that would issue MBS to pay for the mortgage loans. Unlike the GSEs, however, the PLS sponsors did not guarantee timely payment of interest and principal on the PLS. PLS investors, therefore, assumed both credit and interest-rate risk on the MBS, in contrast to GSE MBS, for which investors assumed only interest-rate risk.
Investors in PLS were familiar with interest-rate risk on mortgages, but not with credit risk. Thus, the PLS market initially developed with low credit-risk products, particularly jumbo mortgages—loans that were larger than the GSEs’ conforming-loan limit. Jumbos were
essentially prime, conventional mortgages for larger amounts than conforming loans. Although PLS investors did face credit risk on jumbos, it was low, in part because only high-quality jumbos were securitized because credit-rating agencies initially insisted that jumbo
securitizations follow GSE underwriting guidelines in order to be rated.37 Loss rates on jumbos
since 1992 have been less than 0.5%.38
Credit risk for jumbos was mitigated on both the loan level—through high down payments (low LTVs) and private mortgage insurance—and at the MBS level—through credit
enhancements, particularly credit tranching in a senior–subordinate structure. Jumbo PLS settled on a largely standardized form—the “six-pack” structure, in which six subordinated tranches supported a senior, AAA-rated tranche that comprised well over 90% of the MBS by dollar amount.39 Indeed, jumbo PLS became sufficiently standardized to trade in the
To-Be-Announced (TBA) market, in which mortgages are sold even before they are actually originated because it is sufficiently easy to find a mortgage that meets the sale delivery requirements.40
This is only possible when there is a liquid secondary market for the mortgages with sufficient mortgage standardization.
The success of PLS depended heavily on the ability to achieve high investment-grade ratings for most securities because fixed-income investor demand is highest for high investment-grade
agencies expanded the scope of federal preemption of state regulations again without substituting federal regulation.
See Adam J. Levitin, Hydraulic Regulation: Regulating Credit Markets Upstream, 26 YALE J. ON REG. 143, 154 (2009). The Federal Reserve also failed to act on its regulatory authority under the Home Ownership and Equity Protection Act (HOEPA) to regulate high-cost mortgages. See McCoy et al., supra note 8, at 1334.
37
See DAVID MURPHY, UNRAVELLING THE CREDIT CRUNCH 133 (2009) (“[T]he first private label MBS deals were backed by very high quality mortgages: it took some years for investors to become comfortable with lower quality pools.”).
38
See MBS Basics, NOMURA FIXED INCOME RES. (Nomura, New York, N.Y.), Mar. 31, 2006, at 22 exhibit 12, http://www.securitization.net/pdf/Nomura/MBSBasics_31Mar06.pdf.
39
See id. at 22–23.
40
In the TBA market, a mortgage originator enters into a forward contract with a GSE or Ginnie Mae in which the originator promises to deliver, in the future, a package of loans meeting the GSE’s or Ginnie Mae’s requirements in exchange for GSE or Ginnie Mae MBS being identified in the future. See OFFICE OF FED. HOUS. ENTER.
products.41 For jumbos, it was relatively easy to achieve AAA ratings because of the solid
underlying collateral.42 As the PLS market later moved into nonprime mortgages, however,
greater credit enhancements and structural creativity were necessary to obtain the credit ratings that made the securities sufficiently marketable. For example, the mean number of tranches in nonprime PLS in 2003 was approximatelyten, compared with seven for jumbo six-packs. By 2007, the mean number of tranches for PLS had increased to over fourteen.43 Other types of
internal and external credit enhancements were also much more common in nonprime PLS: overcollateralization,44 excess spread,45 shifting interest,46 reserve accounts,47 and pool and bond
insurance.48 Nonprime PLS thus involved inevitably more complex and heterogeneous deal
structures to compensate for the weaker quality of the underlying assets.49
41
See Ricardo J. Caballero, The “Other” Imbalance and the Financial Crisis 13–14 (Nat’l Bureau of Econ. Research, Working Paper No. 15636, 2010), http://www.nber.org/papers/w1536.
42
For example, for the Wells Fargo Mortgage Backed Securities 2003-2 Trust, a jumbo deal consisting mainly of prime or near-prime (alt-A) jumbos, 98.7% of the securities, by dollar amount, were rated AAA. See Wells Fargo Asset Sec. Corp., Mortgage Pass-Through Certificates, Series 2003-2 (Form 424(b)(5)) (Feb. 27, 2003), available at
http://www.secinfo.com/dsVsn.2h2.htm.
43
Manuel Adelino, Do Investors Rely Only on Ratings? The Case of Mortgage-Backed Securities 42 (Nov. 24, 2009) (unpublished manuscript),
http://citeseerx.ist.psu.edu/viewdoc/download?doi=10.1.1.156.989&rep=rep1&type=pdf.
44
Overcollateralization means that the initial principal balance of the mortgages supporting the MBS is greater than the principal balance on the MBS. See Richard J. Rosen, The Role of Securitization in Mortgage Lending, CHI. FED LETTER (Fed. Reserve Bank of Chi., Chi., Ill.), Nov. 2007 (noting that 61% of private-label PLS issued in 2006 were overcollateralized). The cash flows generated by a larger pool balance are available to absorb losses from mortgage defaults. Overcollateralization is an expensive form of credit enhancement because it ties up collateral that could otherwise be used for other deals, so PLS indentures sometimes provide for the periodic release of collateral if performance thresholds are met. Note that pool overcollateralization is in addition to the overcollateralization of mortgages with <100% LTV ratio.
45
Excess spread is the difference between the income of the SPV in a given period and its payment obligations on the MBS in that period—essentially the SPV’s periodic profit. Excess spread is accumulated to supplement future shortfalls in the SPV’s cash flow but is periodically released to the residual tranche holder. Excess spread generally cannot be released if certain triggers are tripped, such as a decline in the amount of excess spread trapped during a specified period.
46
Shifting interest involves the reallocation of subordinate tranches’ share of prepayments (both voluntary prepayments and the proceeds of involuntary liquidations) to senior tranches. Shifting-interest arrangements are often stepped down over time, with a decreasing percentage of prepayments shifted. See Sunil Gangwani, MBS Structuring: Concepts and Techniques, SECURITIZATION CONDUIT, Autumn 1998, at 26, 33. The effect is to make senior tranches’ share of a securitization larger at the beginning of the deal and smaller thereafter. See Manus J. Clancy & Michael Constantino, III, Understanding Shifting Interest Subordination, in THE HANDBOOK OF NONAGENCY MORTGAGE-BACKED SECURITIES 39, 42 exhibit 4 (Frank J. Fabozzi et al. eds., 2d ed. 2000).
47
A reserve account is a segregated trust account, typically invested in highly liquid, investment-grade investments (for example, commercial paper). It provides a cushion for losses caused by defaults on the underlying mortgage loans. Reserve accounts come in two types: prefunded cash reserves and excess spread. Prefunded reserve accounts are funded in full at the closing of the deal; the arranger of the deal typically funds the account with a share of the deal proceeds. The reserve account thus is a holdback or discount on the SPV’s purchase price of the loans. This type of prefunded reserve account is known as a cash collateral account. Reserve accounts either are required to be maintained at a specified level regardless of losses or are permitted to be drained in accordance with losses. In the former case, the credit enhancement of the reserve account actually increases as the principal and interest due on the PLS decreases.
48
Pool-level insurance either covers losses or provides cash-flow maintenance up to specified levels for the entire pool owned by the SPV. Pool-level insurance is typically provided by private mortgage-insurance companies. Bond-level insurance involves a monoline bond insurer guaranteeing the timely payment of principal and interest on a tranche of bonds. See Gangwani, supra note 46, at 35.
49
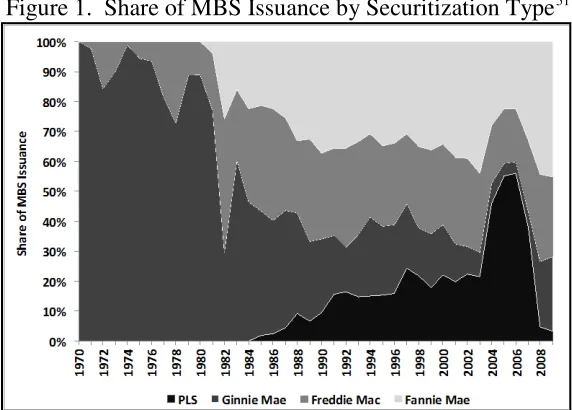
C. A TALE OF TWO BOOMS
[image:15.612.162.448.227.432.2]Nonprime PLS remained a small share of the mortgage-finance market from their origins in 1977 through the 1990s. As of 2003, nonprime first-lien loans were only 10% of all mortgage originations and subprime–Alt-A PLS were only 10% of all MBS issuance.50 Nonprime PLS did not take off until 2004, at which point they grew rapidly until the bursting of the housing bubble (see Figures 1 and 2). The inflection point came with the introduction and spiraling growth of nonprime mortgages in 2003 and 2004, as PLS jumped from being 22% of MBS issued by dollar volume in 2003 to 46% in 2004 (see Figures 1 and 2).
Figure 1. Share of MBS Issuance by Securitization Type51
[image:15.612.113.465.227.655.2]
Figure 2. Annual Market Share and Volume of Subprime/Alt-A MBS Issuance52
50
See INSIDE MORTG. FIN., supra note 23.
51
See id.
52
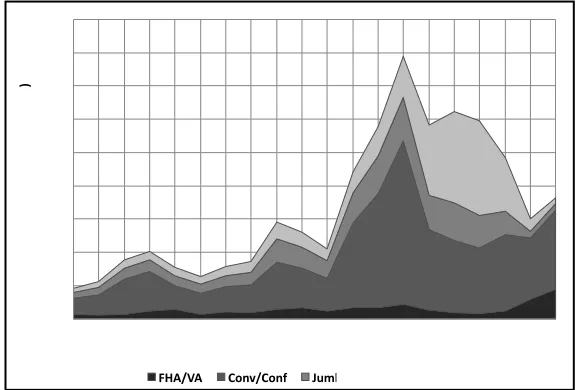
The nonprime-mortgage market (and nonprime PLS market) boomed as a consequence of the tapering off of a preceding prime refinancing boom. From 2001 to 2003, historically low interest rates brought on an orgy of refinancing. In 2003, mortgage originations peaked with 72% of originations (by dollar volume) as refinancings (see Figure 3).53 Virtually all of the refinancing
activity from 2001 to 2003 was in prime, fixed-rate mortgages (see Figure 3).54 The prime
refinancing boom meant that mortgage originators and securitizers had several years of increased earnings.
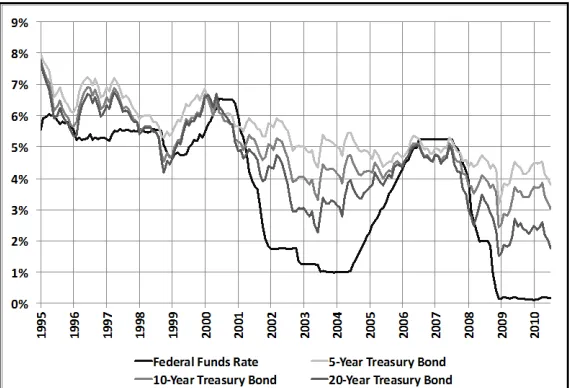
By 2003, however, long-term interest rates had started to rise (short-term rates moved up starting in 2004) (see Figure 4), and the prime refinancing boom ended. This meant that the mortgage industry was hard pressed to maintain its 2001–2003 earnings levels.55 The solution
post-2003 was to find more product to move in order to maintain origination volumes and hence earnings. What followed was a second mortgage boom, but it was qualitatively different in terms of loan underwriting and products than the 2001-2003 boom. Because the prime
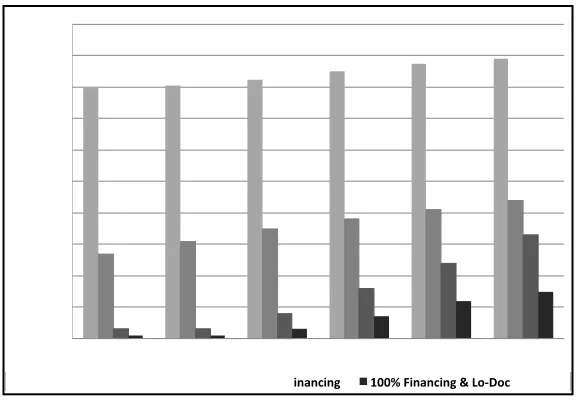
borrowing pool was exhausted, it was necessary to lower underwriting standards and look more to marginal borrowers to support origination volume levels. This meant a growth in subprime and alt-A (limited documentation) mortgages, as well as in second mortgages (home-equity loans and lines of credit) (see Figures 3 and 5). As a result, loan-to-value ratios increased and
[image:16.612.161.450.362.557.2]borrowers’ income was more poorly documented, if at all (see Figure 6).
Figure 3. Origination Volume by Mortgage Type, 1990–200956
53
See id.
54See id. 55
See William W. Bratton & Michael L. Wachter, The Case Against Shareholder Empowerment, 158 U. PA. L. REV. 653, 719 n.198 (2010).
56
Figure 4. Selected Interest Rates, 1995–201057
Figure 5. Origination Volume by Mortgage Type, 1990–200958
Figure 6. Erosion of Residential Mortgage Underwriting59
57
Federal Reserve Statistical Release H.15, available at
http://www.federalreserve.gov/releases/h15/data.htm..
58See
INSIDE MORTG. FIN., supra note 23.
59
See T2 PARTNERS LLC. These figures reflect all mortgages, not just subprime. The LTVs are arguably
[image:17.612.164.449.99.293.2]D. FUELING THE PLS BOOM: THE RISE OF NONTRADITIONAL MORTGAGES
[image:18.612.162.452.70.270.2]The decline in underwriting standards was also reflected in a shift in mortgage products. Nontraditional mortgage products are generally structured for initial affordability; the costs are backloaded, either with balloon payments or increasing interest rates. Table 1, below, illustrates the relative initial affordability of various mortgage products. It shows that adjustable-rate-mortgage (ARM) products, particularly nontraditional ARMs with balloon payments due to limited or extended amortization, could drastically reduce initial monthly payments for borrowers.
Table 1. Relative Affordability of Mortgage Products60
Mortgage Product
Initial Monthly Payment
Payment as Percentage of Fixed-Rate-Mortgage (FRM) Payment
FRM $1,079.19 100%
ARM $903.50 83.7%
Extended-Amortization ARM $799.98 74.1%
Interest-Only ARM $663.00 61.4%
60
Negative-Amortization ARM $150.00 13.9%
Payment-Option ARM <$150.00 <13.9%
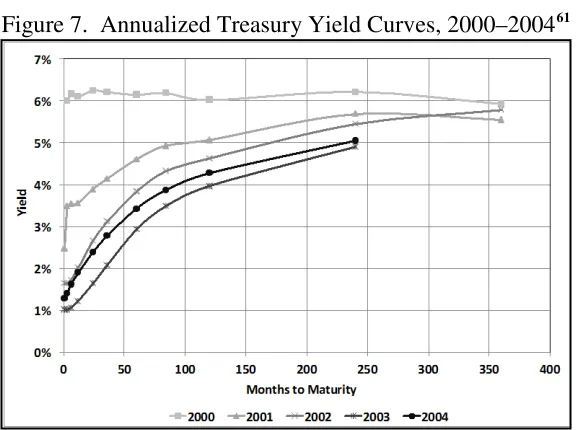
[image:19.612.95.520.71.156.2]During this same time in 2004 and 2005, the yield curve—the relationship between interest rates and loan maturities—was flattening. When the yield curve is upward sloping—meaning that the cost of long-term borrowing is greater than the cost of short-term borrowing, as reflected by initial rates—ARMs are rationally chosen by borrowers because it costs more to borrow with a fixed-rate-mortgage (FRM). As Figure 7 shows, in 2000, the yield curve was flat and shifted to an upward slope from 2001 to 2003. As Figures 7 and 8 show, the yield curve began to flatten out in 2004 and 2005 and was flat in 2006 and 2007.
Figure 7. Annualized Treasury Yield Curves, 2000–200461
Figure 8. Annualized Treasury Yield Curves, 2005–200762
61
Curves were calculated by taking the average daily yield over each year for each duration.
62
[image:19.612.163.451.274.489.2]Prior to 2005, borrowers have shifted from ARMs to FRMs at every point in recent history when yield curves flattened in order to lock in lower long-term rates.63 Despite the flat yield
curve during the peak of the housing bubble, borrowers increasingly chose ARMs.
The explanation for the shift to ARMs cannot be found in the cost charged over the full term of the mortgage; rationally, borrowers considering the full-term cost would have gravitated to FRMs. Instead, the explanation lies in the relatively low initial payments of the ARMs.
This means that there were two possible, nonexclusive reasons for the expansion of ARM market share. First, ARM market-share growth could be explained by a drop in the price of the implicit put option on nonrecourse mortgages. The implicit put option refers to homeowners’ ability to walk away from a nonrecourse (or functionally nonrecourse) mortgage without
personal liability by surrendering the house. If the cost of the put option—included in the cost of mortgage finance—was getting cheaper relative to renting, it would mean that consumers were more willing to speculate on rising housing prices with nonrecourse mortgages.64 Thus, cheaper
mortgage credit made it easier to gamble on housing. Second, ARM share growth could be because ARMs were affordability products, into which financial institutions were able to underwrite weaker borrowers.
There is reason to believe that both explanations are correct. The phenomenon of house flipping—treating houses as pure (or primarily) investments, rather than mixed investment and consumption assets—became pronounced during the bubble. A cheaper put option due to underpriced mortgages would have encouraged this sort of investment.
There is also reason to believe that the growth in ARMs reflected their role as an
affordability product that enabled market expansion, both in terms of the number of borrowers and the size of loans. Deterioration of underwriting standards and the shift in mortgage products had the same effect as falling interest rates—all of these factors reduced the initial cost of
mortgage credit, thereby increasing the quantity of mortgage credit consumed.65 The annual
63
See Michael Tucker, Adjustable-Rate and Fixed-Rate Mortgage Choice: A Logit Analysis, 4 J. REAL EST. RES. 81, 86 (1989) (“Higher T-bill rates are associated with a decrease in the probability of borrowers selecting ARMs.”).
64See
Andrey Pavlov & Susan Wachter, Mortgage Put Options and Real Estate Markets, 38 J. REAL EST. FIN. & ECON. 89, 92 (2009).
65
price of housing finance has two components: a cost of funds and a risk premium. The cost of funds is a function of long-term interest rates, whereas the risk premium is a function of underwriting (including product type). A decline in either component reduces the cost of housing finance and thus allows borrowers to borrow more and bid up home prices.66
Much of the growth in mortgages was in nontraditional products67 such as interest-only
mortgages;68 payment-option mortgages;69 40-year, extended-amortization balloon mortgages;70
and hybrid ARMs71 (see Figure 9). Borrowers were generally approved based on their ability to
pay the initial below-market teaser rate, rather than their ability to pay for the product through its full term.
Figure 9. Growth of Nontraditional Mortgage Products72
Reserve could observe rates in real time, neither it nor anyone else could observe, in real time, the decline in underwriting and the shift in product mix. The deterioration in lending standards also left the housing-finance system vulnerable to correlated shocks; any decline in housing prices would inevitably result in a market crash because of an increased reliance in the credit model on housing-price appreciation.
66
Although housing economists have noted that interest-rate changes do not explain the bubble, they neglect to fully explore the impact of the decline in underwriting standards. See, e.g.,Glaeser et al., supra note 3, at 2–3. Glaeser et al. examine underwriting in a very cursory fashion; their finding that loan approval rates were constant during the bubble ignores the dramatic rise in loan-application volume. See id. at 6, 26. This problem can also be seen in Charles Himmelberg et al., Assessing High House Prices: Bubbles, Fundamentals and Misperceptions, J. ECON. PERSP., Fall 2005, at 67, 68, which argues that, as of 2004, there was no housing bubble. Although Himmelberg et al.note that housing prices are not the same as the annual cost of owning a house, id., they neglect to consider whether the shift in mortgage-product mix was reducing the (initial) affordability of housing.
67Cf.
Christopher Mayer et al., The Rise in Mortgage Defaults, J. ECON. PERSP., Winter 2009, at 27, 36 (noting that three nontraditional mortgage products “might be responsible for at least part of the delinquency rise”).
68
Interest-only mortgages have nonamortized periods during which the borrower pays only interest; the principal balance is not reduced. The interest-only period can range from a few years to the full term of the loan. Once the interest-only period expires, the principal is then amortized over the remaining (shorter) period, meaning that monthly mortgage payments increase substantially upon the expiration of the interest-only period, including the possibility of a “bullet” payment of the entire principal balance at the end of the mortgage term.
69
Payment-option mortgages permit borrowers to choose among monthly payment options. Typically, the choices are payments based on fifteen-year and thirty-year amortizations of the mortgage, a nonamortizing interest-only payment, and a negative-amortization payment that does not even cover the interest accrued in the past period. Because of the negative-amortization option, the balance owed on a payment-option mortgage can actually increase. Payment-option mortgages generally have a negative-amortization limit; once too much negative amortization has accrued, the loan resets to being fully amortized over the remaining term. Likewise, the pick-a-pay-period option is often restricted to a limited number of years, after which the loan resets to being fully amortized over the remaining term. Both types of resets can result in significant increases in monthly payments.
70
A forty-year balloon mortgage, or “40/30,” is a thirty-year loan that is amortized over forty years, meaning there is a balloon payment due at the end of the thirtieth year. The mismatch between the term and amortization periods reduces monthly payments before the balloon payment.
71
A hybrid ARM has an initial fixed-rate period, usually at a teaser rate that is lower than those available on standard FRMs. After the expiration of the fixed-rate teaser period, the loan resets to an adjustable rate. Typically, these loans were structured as 2/28s or 3/27s, with two- or three-year fixed-rate periods and eight- or twenty-seven-year adjustable-rate periods. The new rate after the expiration of the teaser can result in substantial increases in monthly payments.
72
For banks, nontraditional mortgages were gifts that kept giving. The back-loaded cost structure of these mortgages created an incentive for borrowers to refinance when monthly payments increased, thereby generating future refinancing origination business. In essence, then, the exotic products that marked the housing bubble were just the reincarnation of pre-New Deal bullet loans—nonamortizing products designed to be refinanced frequently.
Nontraditional products also fueled their own proliferation as part of a homebuyers’ arms race. The expansion of the borrower base and borrower capacity because of loosened
underwriting standards also increased demand for housing supply and drove real-estate prices upwards. As housing prices rose, nontraditional affordability products became increasingly attractive to borrowers who saw their purchasing power diminish. Thus, nontraditional mortgage products generated additional origination business. The growth of nontraditional products suggests the shift to ARMs was driven by their use as initial affordability for market expansion.
Private-label securitization was the dominant funding mechanism for nontraditional mortgages.73 PLS made the expansion in the nontraditional mortgage market possible, and
nontraditional mortgages made the expansion of the PLS market possible. Without PLS, most nontraditional mortgages would not have been originated because banks would simply have been unwilling to carry the risks from nontraditional mortgages on their balance sheets. Similarly, without nontraditional mortgages, PLS would have remained a market of under $300 billion in issuance per year, rather than one that grew to nearly $1.2 trillion. The GSEs’ economies of scale and implicit government guarantee gave them operating efficiencies that PLS could not match for traditional, conventional conforming loans; but for the growth of nontraditional mortgages, the only market left for PLS would have been in financing conventional jumbo mortgages.74
Ultimately, the expansion of PLS and nontraditional mortgages was its own undoing. PLS based on nontraditional mortgages enabled more mortgage credit, which bid up housing prices, and those increased housing prices then became part of the underwriting that enabled further expansion of mortgage credit. During the bubble, however, housing-price appreciation depended on the continued expansion of the borrower base, much like a pyramid scheme. Not all
73
Some nontraditional mortgages, especially payment-option ARMs, stayed on balance sheets.
74
consumers were looking to purchase homes, and the increase in house prices eventually priced out other potential homeowners, even with loosened (or fraudulent) underwriting standards.75
The inability to keep expanding the borrower base made price increases unsustainable. Without home-price appreciation, homeowners could not refinance their way out of highly leveraged, nontraditional mortgages when payment shocks—large increases in monthly mortgage payments upon the expiration of teaser interest rates—occurred. Moreover, without the continued, expected price appreciation, prices did not just level off but collapsed because part of the high prices was due to the expected future increase in prices.76 The recognition that this was so may also have
played a part in the bubble’s collapse because mortgage credit tightened, becoming a self-fulfilling prophecy. The result was a cycle of declining housing prices and foreclosures: the bubble had burst.
II. ASUPPLY-SIDE EXPLANATION OF THE HOUSING BUBBLE
What caused the bubble? In this Part, we demonstrate two critical facts any explanation of the bubble must address. First, in section II.A, we show that the bubble was primarily a supply-side event, meaning that it was driven by an oversupply of housing finance rather than an excess of demand for housing. Second, in section II.B, we examine the timing of the bubble. We argue that the bubble was limited in duration and that it began in 2003 and 2004. Taken together, the supply-side explanation and the timing of the bubble are the key evidence that points to the change in housing financing from GSE securitization to private-label securitization as the crucial event in the creation of the bubble.
A. EVIDENCE FROM PLS-YIELD SPREADS
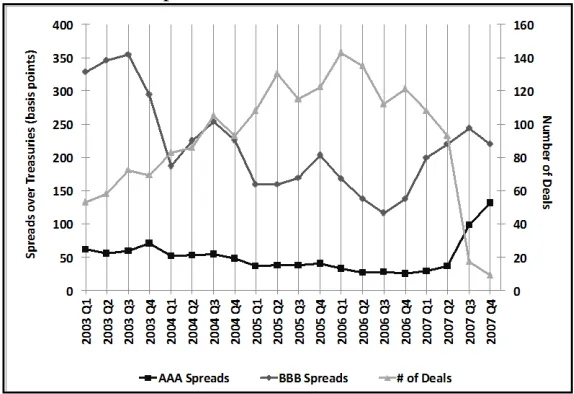
We believe that the cause of the bubble is to be found in the changes in the structure of the housing-finance market in 2003 and 2004, as the market moved from agency securitization of traditional FRMs to private-label securitization of nontraditional ARMs. It is unquestioned that securitization was the funding mechanism for the housing bubble, but no previous work has examined the pricing of PLS in relation to the bubble. We examined the pricing of PLS deals from 2003 to 2007. Our data reveals a remarkable trend: even as mortgage risk and PLS
issuance volume increased, the spread on PLS over maturity-matched Treasuries that represents their additional risk premium decreased (see Figures 10 and 11).
Figures 10 and 11 only show the nominal spreads between PLS and Treasuries; they do not show the increase in risk on PLS. If one were to adjust for changes in credit risk for PLS, the risk-adjusted yield on PLS would have had to increase substantially. The movement in spreads is generally opposite that which one would have expected in a perfect market.
Figure 10. PLS Issuance and Weighted Average Spreads, 2003–200777
75
This may be the reason that homeownership actually peaked early in the bubble, in 2004. See Paul S. Calem et al., Implications of the Housing Market Bubble for Sustainable Homeownership, in THE AMERICAN MORTGAGE SYSTEM: CRISIS AND REFORM 87, 87 (Susan M. Wachter & Marvin M. Smith eds., 2011).
76See
Himmelberg et al., supra note 66, at 74.
77
Figure 11. PLS Issuance and Spreads for AAA- and BBB-Rated Tranches, 2003–200778
Normally, when the risk of an asset class increases, the yield on the asset class increases as well. Therefore, as mortgage-underwriting standards deteriorated, the yield on PLS should have increased and thus the spread between PLS and Treasury yields should have increased. Instead, the spread decreased. Put differently, declining PLS spreads meant that investors were willing to accept more risk for lower returns. Housing finance was becoming relatively cheaper and more abundant, even as it became riskier. This is strong evidence that PLS were being mispriced by the market between 2004 and 2007.
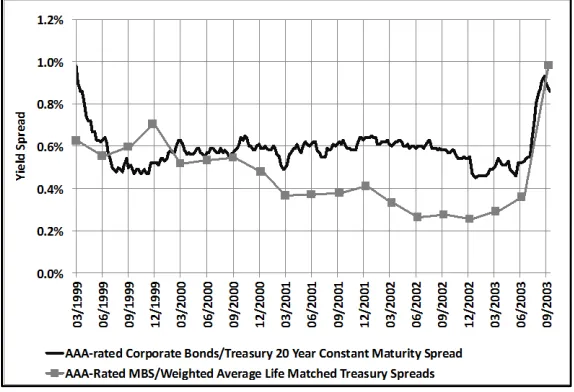
Figure 12 shows an even more remarkable market development. Figure 12 compares spreads over Treasuries for AAA-rated PLS and AAA-rated corporate bonds. This comparison lets us test whether movement in PLS spreads was unique to PLS or whether it merely reflected market-wide trends.
78
[image:24.612.162.449.295.492.2]