Munich Personal RePEc Archive
Can Corporate Diversification Promote
Firm Value? A Survey
Dey, Tania and Banerjee, Rajabrata
Monash University, University of South Australia
February 2011
1
C
AN
C
ORPORATE
D
IVERSIFICATION
P
ROMOTE
F
IRM
V
ALUE
?
A
S
URVEY
Tania Dey
Monash University, Australia
Rajabrata Banerjee*
University of South Australia, Australia
This version: 15th February, 2011
Abstract: This paper performs a rigorous survey of existing measures of diversification and
fills a number of missing gaps between the theoretical and empirical literature surveyed by
previous authors. In addition, the study outlines the areas where future work is possible and
in which direction researchers may advance their thoughts. A detailed discussion on the
various methodologies employed by earlier researchers and their findings are presented. This
survey indicates that there is further scope for development of new theories and the empirical
literature suggests that there is scope for development of new measures of diversification.
Keywords: corporate diversification, firm valuation, discount, premium
JEL Classifications: G30, G34.
*
2
1.
Introduction
Does corporate diversification increase the value of a firm? US experience has shown
evidence both in favour of and against firm diversification in the twentieth century. During
1950s and 1960s, diversification was a common trend for many US corporations. This trend
continued until the 1980s and then it reversed dramatically when corporations started
specialising (Leibeskind and Opler, 1993; Comment and Jarrell, 1995). While this positive
trend towards diversification in 1960s shows gains in firm value out of diversification
(resulting in diversification premium), the reverse trend during 1980s indicates a loss for
others (resulting in diversification discount). 1
The literature of corporate diversification and the puzzle surrounding whether
diversification gives rise to discount or premium, was previously surveyed by three
prominent articles: Martin and Sayrak (2003), Stein (2003) and Maksimovic and Phillips
(2007). Martin and Sayrak (2003) survey the literature on corporate diversification through
two separate channels: cross sectional studies of the link between corporate diversification
and firm value on one hand and longitudinal studies in patterns of corporate diversification
through time on the other. Their survey suggests that diversification discount may not be the
result of corporate diversification after all. In contrast, diversification discount may result
from measurement issues or simply because of sample bias. Stein (2003) studies the strand of
literature which questions the efficiency of corporate investment in the presence of
asymmetric information and agency problems. His focus was mainly on the literature, which
addresses the issue of efficient capital allocation across firms through external capital markets
and within firm allocation of capital through its internal capital market.
Lastly, Maksimovic and Phillips (2007) survey the various theoretical aspects of
diversification. Their findings suggest that although earlier literature claimed that the
diversification discount is a result of inefficient capital allocation in internal capital market,
more recent empirical literature shows that diversification discount can be explained through
self-selection of firms with different investment opportunities. Further their survey indicates
that diversification discount may not be the result of conglomerate diversification, however
can arise due to capital budgeting process of profit maximising firms.
These surveys, even though comprehensive, have number of shortcomings: Firstly,
they focus on isolated issues related to corporate diversification and do not provide a detailed
3
empirical findings in recent times. Secondly, although previous studies have indicated the
need for developing better measures of diversification, they have not suggested any possible
solution. Thirdly, it is apparent from the previous surveys that agency theory and internal
capital market play a very important role towards diversification discount/premium.
However, the studies fail to point out the possible relation that may exist between CEO and
division manager remuneration and diversification discount/premium. Finally, they fail to
point out any importance of corporate reforms on firm value.
This paper performs a rigorous survey of existing measures of diversification and
suggests some additional measures, which may succeed in solving the measurement issues
related to diversification. The paper shows how corporate reforms may be taken into account
as a factor of firm performance. In addition, the study outlines the areas where future work is
possible and in which direction researchers may advance their thoughts. Overall, the paper
fills a number of missing gaps among the earlier surveys and shows the link between the
theoretical and empirical literature. Section 2 provides a detailed discussion on the evolution
of the theories that were put forward to justify either diversification discount or premium.
Examples are provided wherever applicable to provide evidence in support of the theories.
Section 3 surveys the empirical literature, which tests whether diversification discount or
premium exists in firms. In particular, focus is placed on the data and methodology used by
different authors in explaining diversification discount or premium. Section 4 discusses
further scope of research in the literature and Section 5 concludes the discussion on the value
effect of diversification.
2.
Theoretical Background
Diversification discount or premium is explained by various costs and benefits arising
from corporate diversification. The costs arising from corporate diversification are
theoretically justified by agency arguments (Amihud and Lev, 1981; Jensen, 1986; Shleifer
and Vishny, 1989; Jensen and Murphy, 1990), inefficient investment due to rent-seeking
activities (Scharfstein, 1998; Scharfstein and Stein, 2000; Rajan et al. , 2000; Choe and Yin,
2009), and by more recent theories that suggest the existence of a discount is consistent with
the value maximising behaviour of the firm (Fluck and Lynch, 1999; Zuckerman, 1999;
Burch et al., 2000; Matsusaka, 2001; Gomes and Livdan, 2004). Similarly the benefits of
corporate diversification, which give rise to diversification premium, can originate from the
4
et al., 1994; Stein, 1997), debt coinsurance (Lewellen, 1971; Shleifer and Vishny, 1992),
economies of scope (Teece, 1980; Teece, 1982) and market power (Scott, 1982; Tirole, 1995;
Villalonga, 2000).
2.1. Costs of Conglomerate Diversification: Diversification Discount
This section provides a detailed discussion of the theoretical literature which supports
the argument that corporate diversification leads to diversification discount. The various
arguments are as follows:
2.1.1. Agency Theory
The most widely discussed theory is the „Agency theory‟ that views diversification
discount as the product of agency problems between managers and shareholders. Managers
often undertake activities to increase their own welfare at the cost of shareholders. Jensen
(1986) argues that managers have a tendency to acquire and manage resources which are
suboptimal in size. This is because managing such oversized resources gives them private
benefits of control. These private benefits are increased power and prestige of the manager.
Jensen (1986) provides evidence from the US oil industry in 1970s and early 1980s to show
that managers indeed undertook such activities which ultimately led to value loss of
diversification. Furthermore, managers have a tendency to „entrench‟ themselves, i.e. to make
themselves valuable to the shareholders or make themselves so indispensable to the firm that
it becomes very costly to replace them.
Shleifer and Vishny (1989) build a formal model for managerial entrenchment and
show that managers have a tendency to invest valuable firm resources or shareholder wealth
into manager specific assets even if such investments are not value maximising for the firm
or its owners. Shleifer and Vishny (1989) provide an example of managerial entrenchment
through investment in railroad by a CEO. They show that the CEO of a railroad with large
free cash flow is faced with the choice of either to invest in upgrading the railroad or to
raising dividends. If the CEO commits to the former then he is able to extract resources in the
form of wages and perks. This would be much larger compared to the resources he can
extract if he raised dividends. Thus the CEO invests in the railroad and makes himself more
firmly entrenched even if it is not a value-maximizing strategy. Shleifer and Vishny (1989)
measure the degree of entrenchment by observing how specific the assets are to the existing
5
activities. They further argue that managerial entrenchment is not always value maximising
for the firms and provide evidence of managerial resistance to takeovers, wealth-decreasing
investments in oil exploration and wealth decreasing acquisitions by managers with low
ownership stakes.
2.1.2. Inefficient Internal Capital Market
Another way to explain diversification discount is through inefficiencies arising in
corporate organisations owing to rent-seeking activities or influence activities by division
managers.2 Other than influence activities, expressions for rent-seeking activities are
safeguarding activities (Williamson, 1985) and power-seeking activities (Rajan and Zingales,
2000). Wulf (1999), Rajan et al. (2000) and Scharfstein and Stein (2000) formalise this idea
that the division managers undertake wasteful rent-seeking activities in an internal capital
market3 to influence the CEO or headquarters to give them more funds or internal capitalthan
is optimal. This in turn leads to inefficient allocation of resources, which destroys firm value.
Wulf (1999) uses a basic moral hazard model to show that influence activities in the
form of signal jamming4 lead to inefficient capital allocation across divisions. In her model
the chief duty of the headquarters is to allocate capital across divisions in order to maximise
the value of the firm. There are two types of divisions within the firm. One is a smaller less
established division of unknown returns under the supervision of a manager with limited
tenure within the firm. This division can be thought of to represent newer businesses of the
firm. The manager of the smaller division cannot influence the distribution of capital by
headquarters. The other division is a large established division with known returns. It could
be thought of as the core business of the firm. The problem arises due to the varied objectives
of the headquarters and the division managers. The Headquarters‟ objective is to maximise
the value of the firm whereas division managers prefer a larger budget. The manager of the
larger division has more power to influence the decision making process within the firm. The
headquarters relies on the information given by the division manager of the larger established
division (private signals) and the observable characteristics about the small division (public
signal) to decide how much capital to allocate to the smaller division. Influence activity by
the larger division manager also involves a cost on the part of the headquarters. The problem
that originates between the headquarters and the division managers can be characterised as a
standard moral hazard problem. The headquarters cannot observe whether the large division
manager chooses to influence the private signal or not but it can design contracts, which can
6
Scharfstein and Stein (2000) explain the inefficient cross-subsidisation of resources in
internal capital market with the help of a two-tiered agency model. Inefficient
cross-subsidisation occurs when more than the optimal amounts of resources are allocated to some
divisions of a conglomerate whilst less than required are provided to others. In their model
the CEO of a multi-divisional firm is an agent of outside investors. His job is to hire and
retain division managers. He also possesses the authority to re-allocate internal funds and
resources across various divisions of the firm. The division managers on the other hand not
only participate in productive activity but also engage in wasteful rent-seeking activity5 to
increase their bargaining power with the CEO for obtaining higher compensation. In addition,
the manager of the weaker division does more rent-seeking since his opportunity cost of time
is lower than the manager of the stronger division. The outside investors would prefer the
CEO to use the cash flows generated by different divisions of a conglomerate as extra
compensation that has to be paid out to the division managers. However the CEO derives
private benefits from the cash flows generated by the firm and prefers to pay the division
managers with capital budget.
Inefficient cross-subsidisation occurs in internal capital market in two ways. Firstly the
outside investors have no means to enforce the CEO to pay the extra compensation to
division managers in the form of cash and hence investment can get distorted. Secondly,
since the manager of the weaker division engages more in rent-seeking activity, the CEO
diverts more capital budget towards the weaker division and less towards the stronger
division, which would subsequently generate lower value for the conglomerate. McNeil and
Smythe (2009) find evidence that managers with more lobbying power represented by tenure,
seniority and board membership always manage to get more capital even if they are in charge
of a weaker division. This is consistent with the theory proposed by Scharfstein and Stein
(2000). 6
Rajan et al. (2000) develop a new theory, which describes the rent-seeking activity as
forms of power struggle7 within a company. Further they propose that the driving force
behind inefficient allocation in a diversified conglomerate is the diversity of investment
opportunities and resources among the divisions of the firm. Unlike Scharfstein and Stein
(2000), here headquarters is the principal who has the power to transfer resources ex ante
across divisions but has no power to distribute the surplus that is generated by the divisions
ex post. The division managers on the other hand have the ability to distribute the ex post
surplus through negotiations. They affect the amount of surplus they receive through their
7
which is the optimal investment and defensive investment, which returns lower value but
protects a division from being preyed upon by other divisions. The rules of the game are such
that the surplus generated by a particular division has to be shared by the other divisions. If
the divisions are similar in resources and opportunities then surpluses generated by them will
not differ much. In that case self interested division managers will have no incentive to
deviate from choosing efficient levels of investment since the amount shared by the divisions
would not be very different.
Inefficiencies arise in this model when the divisions are diverse in resources and
opportunities. The division managers know that if the divisions are diverse in resources and
opportunities then they will generate uneven surpluses. At least one division manager who
generates a higher surplus will not be willing to share his surplus and hence he would
undertake defensive investment. The headquarters cannot enforce the sharing rules on the
division managers but it can make transfers to the division with poor opportunities in an
attempt to make it less diverse so that the manager of the division with better opportunities
will choose efficient levels of investment. Thus inefficient cross subsidisation of resources
takes place in an attempt to prevent larger inefficiencies which can arise if defensive
investment is chosen.
More recently, Choe and Yin (2009) provide a theoretical framework by analysing the
investment decisions in a multidivisional firm. In their model they show that if conglomerates
are successful in breaking the budget constraint of their divisions then efficiency of a
conglomerate increases through its internal capital market. The CEO in their model has the
authority to pool and reallocate resources across divisions but cannot do so independently.
Their decision to allocate resources to a particular division depends on the information
provided by the division manager about the state of that division. The division managers on
the other hand derive private benefits from their own divisions. These private benefits are an
increasing function of the revenues generated by that division. Higher investments in a
division would mean higher revenues and higher private benefits for the division managers.
Hence the division managers have no incentive to reveal the true state of their division.
Choe and Yin (2009) propose that the only way to extract truthful information from the
division managers is to reward them for truthful revelation in the form of information rents.
Thus there exists a trade-off between the benefits of internal capital markets such as pooling
resources and reallocating them to best net present value projects and costs of operating
internal capital markets in conglomerates, such as information rents which appear in the form
8
than in single segment firms. Finally they argue that when the costs outweigh the benefits of
internal capital markets then conglomerate firms trade at a discount and vice versa. The
notable feature of their model is that here diversification discount is not the product of
misallocation of resources in internal capital markets but due to information rents paid out to
division managers.8
2.1.3. Does Diversification Destroy Firm Value?
Another school of thought argue that conglomerate discount may not destroy the value
of a firm. Fluck and Lynch (1999) argue that often standalone firms have marginally
profitable positive net present value projects which cannot be financed in the external capital
market due to agency problems. They suggest that conglomerate merger is a technology
which helps these kinds of projects to survive by funding them in an internal capital market.
These positive net present value projects enhance the value of the conglomerates by sending
positive signals to shareholders about the ability of the manager to identify a potentially
profitable project. However at the same time since these projects are marginally profitable
they create less value than a comparable portfolio of single-segment firms. Once the acquired
firms overcome their distress period and become profitable so that they can be financed in an
external capital market, the acquiring firm chooses to divest the acquired firm if there is
coordination costs involved in being a conglomerate.
From an industry perspective, Burch et al. (2000) show that diversification does not
destroy value of the firm even though it trades at a discount. They argue that firms which
belong to non-innovative industries are less adaptable to industry shocks or incorporation of
new opportunities as compared to firms which belong to innovative industries. Hence it is
best for non-innovative firms to diversify and form conglomerates in order to survive. Once
these firms form into conglomerates then they can get funding through internal capital
markets and survive industry shocks. The remaining firms which stay as single segment firms
face less competition once conglomeration of more sensitive firms take place and hence they
become more profitable. Single segment firms comprise of both innovative and
non-innovative firms whereas conglomerates comprise of non-non-innovative firms only. The value of
a non-innovative firm is lower than the value of an innovative firm in the industry. Hence
conglomerates are valued at a discount compared to more focused firms. They use panel data
for fifty prominent industries from 1978 to 1997 and found evidence in support of their
9
heavily discounted conglomerates whereas, investment opportunities for single segment firms
in the same industry are lower.
Diversification can enhance firm value through rise in stock prices on announcement of
corporate diversification. 9 On the other hand empirical literature on diversification, discussed
in the next section, shows that diversified firms trade at a discount compared to
single-segment firms in the same industry. Matsusaka (2001) defines diversification as a
„search/match‟ process and tries to explain this puzzling phenomenon with the combination
of organisational theory and historical evidence. Firms that have organisational capabilities,
such as marketing, distribution skills and knowledge of senior and top management, can be
transferred to other products and industries. When firms perform poorly and incur lower
sales, then instead of liquidating the „assets/resources‟ completely, firms try to find other
firms which are more suitable for their organisational capabilities. Matsusaka (2001)
describes this process of identifying and observing the outcome resulting from such a
„search/match‟ process as diversification. He argues that diversification discount occurs
because diversified firms do not find a good match for their organisational abilities rather
than due to diversification itself.
Gomes and Livdan (2004) explains diversification discount with the help of the
neo-classical theory of profit maximisation by firms. They put forward two arguments behind a
firm‟s decision to diversify. Firstly diversification allows firms to reap the benefits of
economies of scope by lowering the cost of production and by eliminating unnecessary
activities in various divisions. Secondly when a firm is mature, its growth slows down. In that
case firms diversify to reap the benefits of new productive opportunities. They characterise
production as subject to diminishing returns to scale. Hence with higher production the firms
experience diminishing returns which motivate the firms to search for other new productive
opportunities. Firstly, they found that diversified firms have a lower value of Tobin‟s q as
compared to single segment firms despite the fact that diversification was an optimal strategy
for a firm and inefficiencies were absent from their models. They put forward the argument
that the diversified firms trade at a discount, since only those firms which are less productive
in their current activity diversify in search of better productive opportunities. Secondly, their
theory also predicts that firms undergoing diversification also experience loss in productivity.
Their theoretical predictions are supportive of the empirical findings by Lang and Stulz
10
2.2.
Benefits of Conglomerate Diversification: Diversification Premium2.2.1. Efficient Internal Capital Market
External capital markets are often imperfect and costly to operate in and that is why
many firms choose to operate in an internal capital market. Williamson (1970, 1975) suggests
that firms diversify to prevail over the imperfections that exist in external capital markets by
gathering and channelling resources efficiently across their divisions through an internal
capital market. The external and internal capital markets also differ with respect to the
residual control rights10over the respective firm‟s assets. The external financier (e.g. a bank)
does not own the firm to which it is lending capital but the internal financier (i.e. the
headquarters) owns the firm in the sense that it has residual control rights over the use of the
firm‟s assets.
Gertner et al. (1994) show that this difference in control rights between an external
financier and an internal financier has three very important consequences for the firm in
question: (a) increased monitoring incentives, (b) decreased entrepreneurial incentives, (c)
better asset redeployability. Unlike banks, headquarters have a stronger incentive to monitor
the activities of the firm and its managers since better monitoring will ensure a higher return
for the latter, owing to its control rights. The downside of the residual control rights of
headquarters is that it lowers the incentives of the managers to work harder. Since the
managers do not have control rights over the firm‟s assets they cannot appropriate all the
rents pertaining to their managerial ability and are also exposed to opportunistic behaviour
from the headquarters. Another weakness of internal financing is influence activities by the
managers which might create less value for the company. In an internal capital market there
is a higher chance of interaction between managers and headquarters where the former might
try to influence the latter with regards to investment decisions. The third consequence leads
to better use of corporate assets. If a particular business unit performs poorly then its assets
can be transferred to another unit where those assets can be used more efficiently. On the
contrary if a single segment firm performs poorly it is often left with no other choice but to
liquidate its assets at a lower value.
The „winner-picking‟ theory of Stein (1997) also supports the argument that diversified firms can create value. In his model the headquarters has the control rights to resources and it
derives private benefit generated by projects that are under its control. The headquarters will
receive a larger share of private benefit generated by a more profitable project. Hence the
11
private benefits. Owing to its control rights the headquarters can take the resources from one
division and divert it to the most deserving division where the returns are higher or it can use
one division‟s assets as collateral to raise finance and then divert it to a more profitable
division.
2.2.2. Debt Coinsurance
Debt capacity adds value to the firm and diversification increases firm value by
increasing overall debt capacity. Lewellen (1971) argues that diversified firms can have
higher debt capacity because diversification reduces their variability in earnings and thus the
creditors have greater confidence in the total cash-flow of all the divisions of a
multi-divisional firm compared to a focused firm. Their argument is based on „lender diversification‟ and „borrower diversification‟. When a lender diversifies he spreads the risk by lending parts of his total portfolio to different organisations and thus ensures that his
portfolio cannot all go bad at the same time. But he cannot ensure that a borrower will not
default on his loan through this diversification. On the other hand when borrowing firms
diversify by merging then the chances of loan repayment increases because if one of the
merging partners is performing poorly the other merging partner can support him with his
excess cash flow. The chance of defaulting on a loan decreases in the case of diversification
by mergers. This in turn boosts the confidence of lenders, which leads to higher debt capacity
for the diversified conglomerate.
Shleifer and Vishny (1992) argue that besides higher cash flows conglomerates have
advantage in terms of liquidity of assets. Redeployable assets like commercial property can
be more easily liquidated than growth assets such as high technology firms and cyclical assets
like steel and chemical firms. A conglomerate can sell its assets to several different
industries. As long as conglomerates have sufficient assets in the liquid industry, they can
avoid selling their assets to industries which are illiquid in terms of assets. A conglomerate
also has the option of liquidating its assets in parts so that the value of the liquidated asset
remains unaffected. Thus if a focused firm needs to sell its assets during a financial crisis it
may find it difficult to do so since its industry peers are also facing the same crisis. On the
other hand a diversified firm has the option of selling its assets to those industries which are
least affected by the crisis. Thus diversified firms are more insured against market risk and
12
2.2.3. Economies of Scope
Economies of scope often originate from the common use of proprietary knowhow or
the common and recurrent use of some specialised and indivisible assets. Such economies of
scope are often hard to generate in an external market owing to market imperfections, high
costs of transfer and incomplete rules of transaction. Teece (1980) proposes that a diversified
firm can reap the benefits of such economies of scope owing to its organisational form. A
multi-divisional firm can transfer knowhow across its divisions and thus reap the benefits of
economies of scope which in turn increases its value. Similarly assets which can be used to
produce many related end products can be used more efficiently if they are owned by a single
company. Teece (1982) argues that firms diversify in order to reduce the transaction cost
involved in obtaining various assets and services from different markets. Both papers argue
that firms that can use similar knowhow and assets can reap various benefits owing to their
organisational form and economies of scope can create value for a diversifying firm.
2.2.4. Market Power
Villalonga (2000) argues that firms diversify to acquire more market power. Her study
offers three different anti-competitive motives for diversification. First of all, firms diversify
so that they can use the profits generated by one division to support aggressive pricing in
another division. The second reason is the mutual forbearance hypothesis of multi-market
competition11. The third reason is that firms often diversify to engage in reciprocal buying
with other large firms in order to drive small competitors out of business. This also supports
the view of Scott (1982), who argues that when firms have high seller concentration and high
multimarket contact, it leads to higher profitability for the diversified firm.
3.
Empirical evidence and measurement Issues
This section provides an extensive review of the empirical literature on diversification
and supplies international evidence on both diversification discount and premium. In
addition, various data and methodologies used in this literature are discussed along with their
findings.
3.1. Empirical Evidence
13
Table 1: International evidence on diversification discount/premium
Author Period of
Study
Country of Study
Database Findings on
Discount/Premium
Lang and Stulz (1994)
1978-1990 US Business Information file of Compustat
Discount
Berger and Ofek (1995)
1986-91 US Compustat Industry Segment database Discount
Servaes (1996) 1961-1976 US Compustat, Dun & Bradstreet‟s Million Dollar Directory
Large discount for the 1960s. No discount for the 1970s. Lins and Servaes
(1999)
1994 and 1996
Germany, Japan, UK
Worldscope database No discount in Germany. Discount in Japan and UK Khanna and
Palepu (2000)
1993 India Centre for Monitoring the Indian Economy and Bombay Stock Exchange
Premium
Bernardo et al.
(2000)
1980-1998 US Compustat, CRSP Discount
Anderson et al.
(2000)
1985-1994 US Compustat Industry segment database Discount
Lins and Servaes (2002)
1995 East Asian countries
Worldscope database Discount
Graham et al.
(2002)
1978-1995 US Compustat Industry segment files, Securities Data Corporation Mergers and Acquisition database
Discount
Campa and Kedia (2002)
1978-1996 US Compustat Industry segment database Discount initially and Premium later Schoar (2002) 1987 US Longitudinal Research
Database(LRD) at the U.S. Bureau of Census
Premium using profitability measure and Discount using excess value measure Mansi and Reeb
(2002)
1988-1999 US Disclosure Worldscope database, Lehman Brothers Fixed Income Database
Discount initially but it vanishes later
Fleming et al.
(2003)
1988-1998 Australia AGSM annual report files, Connect 4 databases, Datastream
Discount initially but it vanishes later
Villalonga (2004)
1989-1996 US Business Information Tracking Series, Compustat
Premium using BITS. Discount using Compustat Lee et al. (2008) 1984-1996 South Korea KFTC, KSE, Bank of Korea,
Financial Supervisory Service
Premium initially but turns into discount over time He (2009) 1992-1997,
1998-2004
14
Studies conducted on U.S. firms clearly provide mixed evidence. Lang and Stulz
(1994), Berger and Ofek (1995), Bernardo et al. (2000), Anderson et al. (2000) and Graham
et al. (2002) find that diversified firms in the U.S. were traded at a discount. They cover the
period from 1978 to 1998 and use data from COMPUSTAT. Servaes (1996) studies 1961 to
1976 and finds a discount for the 1960s which vanished in the 1970s. Campa and Kedia
(2002) and Mansi and Reeb (2002) also find a discount at the beginning of their period of
study which either vanished eventually or turned into a premium. Schoar (2002) finds both
discount and premium for two different measures using data from Longitudinal Research
Database (LRD) at the U.S. Bureau of Census. Villalonga (2004) finds a premium using
Business Information Tracking System but a discount using data from COMPUSTAT for
1989 to 1996. He (2009) uses COMPUSTAT and finds a discount using pre 1997 data and a
premium using post 1997 data. These studies are inconclusive as to whether diversified
American firms traded at a discount or a premium. The discrepancies in the results could
stem either from methodological issues or from using different data sources.
International studies too show that discount exists in some countries whereas others
have premium. Lins and Servaes (1999, 2002) find that discount existed in Japan, United
Kingdom, Hong Kong, India, Indonesia, Malaysia, Singapore, South Korea, and Thailand
whereas no discount is found in Germany. While Khanna and Palepu (2000) find that
diversified firms traded at a premium in India, Lins and Servaes (2002) find a discount for
Indian firms using a different data source. Fleming et al. (2003) find that Australian firms
traded at a discount between 1988 and 1998, but the discount vanished when low performing
firms are excluded from the sample. Lee et al. (2008) conducts a study on South Korean
firms between 1984 and 1996 and find that diversified firms traded at a premium initially but
this premium is converted to diversification discount over time. The international evidence
suggests that the existence of discount or premium could result from institutional differences
across countries, methodological issues, and use of different data sources or sample selection
bias. The following section provides a detailed discussion of methodologies, various
measures and controls used by the above authors.
3.2. Methodology used in Measuring Discount/Premium
Tobin‟s q became the most common measure of firm performance after Lang and Stulz (1994). They use three different measures of diversification to compare the q ratio of single
15
measures are Herfindahl indices12 constructed from sales and assets. The third measure is the
number of segments in the firm since more diversified firms have more segments. Lang and
Stulz (1994) use cross-sectional regressions for each year from 1978 to 1990. They use a
dummy variable to estimate the statistical contribution to q of diversification. However, they
argue that since this method does not take into account the industry effects, a firm belonging
to an industry with low-q will automatically have lower q irrespective of diversification. This
short coming is corrected for by using industry-adjusted measures of discount. 13
Berger and Ofek (1995) use asset and sales multiplier14instead of Tobin‟s q in order to
measure the value effect of diversification. In order to show the possible association between
value loss and diversification they estimate pooled regressions using multi-segment dummy
and control for firm size, profitability and growth opportunity of the firm.
Khanna and Palepu (2000) use Tobin‟s q and rate of return on assets (ROA) as a measure of firm performance. Four different diversification measures are used in their
analysis: (a) INDCNT: a count of industries represented in a group, (b) ENTROPY: sum of
entropy index of related diversification and an entropy index of unrelated diversification, (c)
CONCENTRIC: a weighted average of each firm‟s share of group sales and (d)
HERFIDAHL: sum of squares of each industry‟s sales as a proportion of total group sales.
Both Univariate comparisons and Multivariate regression analysis are performed using
Tobin‟s q and ROA.
Graham et al. (2002) argue that if diversification discount is calculated using the Berger
and Ofek (1995) methodology then that might not provide an accurate value due to sample
selection bias. The single segment firms which are used as a benchmark for calculating the
imputed value of the diversified firm may not be a true representative of a segment in a
diversified firm. A diversifying firm may acquire a single segment firm which was already
trading at a discount. Hence any single segment firm belonging to the same industry cannot
be a true representative of the acquired business which is already trading at a discount. If this
is taken into account then diversification discount appears in diversifying firms due to
acquiring businesses which are already trading at a discount but not due to the act of
diversification itself.
They used two types of samples of firms to find out whether sample selection bias is
responsible for diversification discount. The first sample consists of firms which are involved
in mergers and acquisitions and for which the market value of the target and the acquirer can
be identified prior to acquisition. The second sample comprises of firms that begin as
16
the second sample increase their segments via acquisitions and one-third of the firms increase
their segments because of internal expansion or reporting changes. The excess value measure
is calculated using the methodology used in Berger and Ofek (1995).
Campa and Kedia (2002) use instrumental variables and also control for the
self-selection of firms that diversify by using Heckman‟s (1979) two stage procedure. They
follow Berger and Ofek (1995) excess value and diversification measures to account for
diversification discount. They use both industry specific and firm specific instruments.
Besides the instrumental variables they control for firm size and profitability like Berger and
Ofek (1995). They estimate different models, which include Berger and Ofek (1995) model,
the extended Berger and Ofek (1995) model, regression with firm-fixed effects and
year-fixed effects, model with instrumental variable and model with self-selection. They use Probit
estimation to calculate the probability of diversifying using the instrumental variables and the
control variables. Finally these estimation results are used in the models with instrumental
variable and self-selection.
Schoar (2002) adopts a different methodology to address the issue of whether
diversification destroys value or not. He uses micro level data for manufacturing firms from
the Longitudinal Research Database from the U.S. Bureau of the Census. Instead of using
market valuation measures such as excess value of the firm he uses productivity measures of
firm performance like total factor productivity (TFP). TFP measures of firm performance are
obtained at the plant level by estimating a log-linear Cobb-Douglas production function for
each industry and year. Number of segments and Herfindahl index are used as measures of
diversification. He also controls for firm size and segment size in his regressions. Schoar
(2002) tests several different hypotheses in his paper and uses different dummies to do so.
Lins and Servaes (2002) use the Berger and Ofek (1995) methodology to estimate their
model. However they also use excess profitability along with excess value measure of Berger
and Ofek (1995). Geographic diversification is controlled for since international
diversification might reduce firm value.
Villalonga (2004) points out three criticisms of using segment level data from
COMPUSTAT. She argues that diversification discount could be the manufactured product of
segment data that is reported in COMPUSTAT. COMPUSTAT provides disaggregated
financial information for business segments that represent at least 10% of a firm‟s sales,
assets or profits and also determines diversified and non-diversified firms and the industries
17
will be affected, since the aggregation of imputed values of each segment will not represent
the true market value of the firm.
The use of segment data from COMPUSTAT poses certain problems. First of all,
according to the Financial Accounting Standards Board firms need to report disaggregated
information for segments that meet the 10 percent materiality condition. Hence the maximum
number of industries that can be observed for any firm is 10. Again due to managerial
discretion often the actual number of segments is not reported. This happens even more when
industries are defined at the four-digit SIC code level of precision as in COMPUSTAT. The
second problem relates to the way segment is defined in the Statement of Financial
Accounting Standards (SFAS). Accordingly a segment can be an aggregation of two or more
activities which are either horizontally or vertically related. It is often found that firms report
segments which operate in sometimes totally unrelated activities. Hence comparing such
segments might not provide a true picture about the relatedness of these segments. Lastly
firms often change the segments they report even when there is no real change in their
operations. Thus instances of diversification or refocusing in COMPUSTAT are often simply
reporting changes.
These three problems can have serious implications for the excess value measures of
diversification. This is because the firms can often get misallocated to industries and
vice-versa. Firms which belong to more than one industry might often be misrepresented which
can affect the industry mean or median qs. The single segment firms which are reported in
COMPUSTAT might often have operations in different businesses. Hence calculations of
pure play qs using segment data from COMPUSTAT might not be accurate. Villalonga
(2004) uses a new data source, Business Information Tracking Series (BITS), which can
correct the problems in COMPUSTAT. Villalonga (2004) follow the methodology used by
Lang and Stulz (1994) and Servaes (1996).
Villalonga (2004) uses varied measures of diversification in order to calculate the
diversification discount/premium. She uses the multi-segment or the multi-business dummy
as a primary measure of diversification like several other studies before her. However she
uses five other measures to check the validity of her results. Besides using a discreet measure
such as number of business units in the firm, she uses four continuous measures where higher
levels of diversification lead to higher values. These continuous measures are: 1 minus
Herfindahl index and three measures of entropy. The three entropy measures include total
entropy, unrelated entropy and related entropy. Total entropy measure is very similar to
18
a two-digit SIC level and related entropy is the difference between total entropy and unrelated
[image:19.595.74.527.135.762.2]entropy.
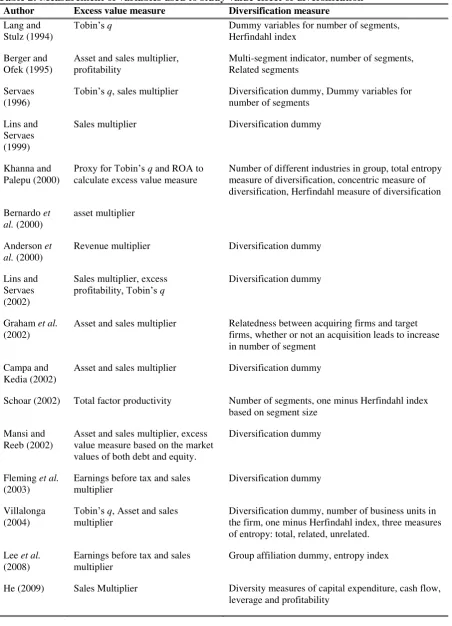
Table 2: Measurement of variables used to study value effect of diversification
Author Excess value measure Diversification measure
Lang and Stulz (1994)
Tobin‟s q Dummy variables for number of segments,
Herfindahl index Berger and
Ofek (1995)
Asset and sales multiplier, profitability
Multi-segment indicator, number of segments, Related segments
Servaes (1996)
Tobin‟s q, sales multiplier Diversification dummy, Dummy variables for number of segments
Lins and Servaes (1999)
Sales multiplier Diversification dummy
Khanna and Palepu (2000)
Proxy for Tobin‟s q and ROA to calculate excess value measure
Number of different industries in group, total entropy measure of diversification, concentric measure of diversification, Herfindahl measure of diversification Bernardo et
al. (2000)
asset multiplier
Anderson et al. (2000)
Revenue multiplier Diversification dummy
Lins and Servaes (2002)
Sales multiplier, excess
profitability, Tobin‟s q
Diversification dummy
Graham et al.
(2002)
Asset and sales multiplier Relatedness between acquiring firms and target firms, whether or not an acquisition leads to increase in number of segment
Campa and Kedia (2002)
Asset and sales multiplier Diversification dummy
Schoar (2002) Total factor productivity Number of segments, one minus Herfindahl index based on segment size
Mansi and Reeb (2002)
Asset and sales multiplier, excess value measure based on the market values of both debt and equity.
Diversification dummy
Fleming et al.
(2003)
Earnings before tax and sales multiplier
Diversification dummy
Villalonga (2004)
Tobin‟s q, Asset and sales multiplier
Diversification dummy, number of business units in the firm, one minus Herfindahl index, three measures of entropy: total, related, unrelated.
Lee et al.
(2008)
Earnings before tax and sales multiplier
Group affiliation dummy, entropy index
19
Table 2 summarises the variables used to study the value effect of diversification. The
majority of studies in this area use Tobin‟s q and asset or sales multiplier as excess value measure after its introduction by Lang and Stulz (1994) and Berger and Ofek (1995). The
exception is Schoar (2002) who employs total factor productivity. Diversification dummy,
number of segments and Herfindahl index are the most common measures of diversification.
However Berger and Ofek (1995) use related segments and Khanna and Palepu (2000)
employ number of different industries in group, total entropy measure of diversification,
concentric measures of diversification. Graham et al. (2002) employ completely different
diversification measures like relatedness between acquiring firms and target firms, whether or
not an acquisition leads to increase in number of segments. Villalonga (2004) uses entropy
measures along with the conventional measures of diversification. Lee et al. (2008) use a
diversification dummy to account for relatedness across companies and two entropy indices
to capture organisational structure and complexity. He (2009) uses different diversity
measures such as capital expenditure, cash flow, leverage and profitability to account to
measure their effects on firm value.
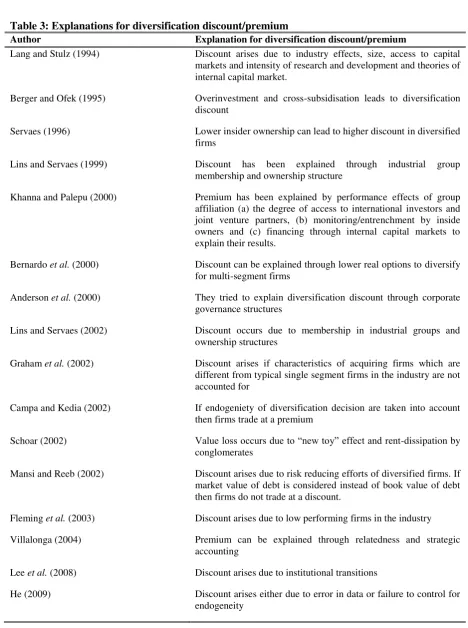
3.3. How can Diversification Discount/Premium be explained?
It is not sufficient to calculate whether diversified firms trade at a discount or premium.
It is important to delve deeper into the problem to understand the factors which are driving
the results. If it is possible to identify factors which are responsible for diversification
discount then that might enable firms to take measures to increase their firm value. On the
other hand, if factors generating a diversification premium can be identified then they can be
applied to firms which are trading at a discount. This section discusses how different authors
have tried to explain their results. Table 3 below summarises the explanations for
diversification discount/premium from all relevant studies in the literature.
Lang and Stultz (1994) explain this diversification discount through industry effects,
size, access to capital markets, intensity of research and development and theories of internal
capital market. Industry effects may be able to explain the negative relation between Tobin‟s
q and degree of diversification. Diversified firms are concentrated in industries with fewer
growth opportunities. They account for industry effects by constructing portfolios of
specialised firms that match the industry composition of diversified firms. Industry effects
reduce the magnitude of the diversification discount but even after correcting for the industry
20
fail to explain this discount another attempt is made to explain it through variables which are
[image:21.595.62.531.127.756.2]known to affect Tobin‟s q, such as size, access to capital markets and intensity of research and development.
Table 3: Explanations for diversification discount/premium
Author Explanation for diversification discount/premium
Lang and Stulz (1994) Discount arises due to industry effects, size, access to capital markets and intensity of research and development and theories of internal capital market.
Berger and Ofek (1995) Overinvestment and cross-subsidisation leads to diversification discount
Servaes (1996) Lower insider ownership can lead to higher discount in diversified firms
Lins and Servaes (1999) Discount has been explained through industrial group membership and ownership structure
Khanna and Palepu (2000) Premium has been explained by performance effects of group affiliation (a) the degree of access to international investors and joint venture partners, (b) monitoring/entrenchment by inside owners and (c) financing through internal capital markets to explain their results.
Bernardo et al. (2000) Discount can be explained through lower real options to diversify for multi-segment firms
Anderson et al. (2000) They tried to explain diversification discount through corporate governance structures
Lins and Servaes (2002) Discount occurs due to membership in industrial groups and ownership structures
Graham et al. (2002) Discount arises if characteristics of acquiring firms which are different from typical single segment firms in the industry are not accounted for
Campa and Kedia (2002) If endogeniety of diversification decision are taken into account then firms trade at a premium
Schoar (2002) Value loss occurs due to “new toy” effect and rent-dissipation by conglomerates
Mansi and Reeb (2002) Discount arises due to risk reducing efforts of diversified firms. If market value of debt is considered instead of book value of debt then firms do not trade at a discount.
Fleming et al. (2003) Discount arises due to low performing firms in the industry Villalonga (2004) Premium can be explained through relatedness and strategic
accounting
Lee et al. (2008) Discount arises due to institutional transitions
21
It is assumed in the study of Lang and Stultz (1994) that diversified firms do a better
job of capital allocation through an efficient internal capital market. This market enables the
various divisions of a diversified firm to invest up to the point at which the marginal return
on capital equals the cost of capital and ensures that their cost of capital is lower relative to
their stand-alone cost of capital because of the lesser impact of informational asymmetries.
Hence, relative to stand-alone specialised firms, the conglomerates invest more and may
therefore have lower qs since their marginal return to capital will be lower. With the above
findings, one will expect average q to exceed one for conglomerates because their market
value will capitalise the contribution to shareholder wealth of the reduction in informational
asymmetries if there is no error in computing q. Hence it can be concluded that the benefit
from the reduction in informational asymmetries for conglomerates is dominated by
inefficiencies such as influence costs and agency costs.
Berger and Ofek (1995) argue that overinvestment and cross-subsidisation contribute
towards the value loss of diversification. They further show that this loss is reduced by the
tax benefits of diversification. Overinvestment is measured as a sum of the
depreciation-adjusted capital expenditures of all segments of the firm operating in industries whose
median Tobin‟s q is below 0.76 and scaled by total sales. Calculation of this variable is restricted to un-related multi-segment firms. Higher values of the overinvestment variable
will imply more unprofitable investment. The negative sign on the coefficient of
overinvestment will imply that, higher overinvestment means lower excess values for
multi-segment firms with unrelated multi-segments. The regression estimates predict that the difference
in overinvestment of 3.6% of sales will indicate an excess value loss of 1.4% to 3.3% for low
investment opportunity segments of diversified firms.
Another explanation put forward in favour of value loss from diversification is
cross-subsidisation. It is often argued that cross-subsidisation of poorly performing segments in a
multi-segment firm often leads to value loss for diversified firms. Berger and Ofek (1995) use
negative cash flow as a proxy for poor performance irrespective of the fact that this would be
a noisy measure of poorly performing segments if managers had a tendency for falsely
reporting the poorly performing segments. They try to examine whether the presence of
negative cash flow has more negative impact on diversified firm value as compared to value
of a focused firm. This will capture whether poorly performing segments of diversified firms
draw resources from other segments in a diversified firm. They find that diversified firms
with negative cash flow segments have significantly lower excess values than diversified
22
In addition, they argue that increased debt capacity and reduced tax payments may
lower the value loss from diversification. If firms diversify in businesses which have uneven
returns then that increases the debt capacity of the firm. As a result diversified firms can
borrow more which leads to higher interest tax shields. Diversified firms can offset the losses
of some segments through gains in other segments and hence can create tax advantage for the
firm as a whole.
Servaes (1996) finds that during the period 1961 to 1970, when diversification discount
was high, single segment firms have higher insider ownership than multi-segment firms. This
also suggests that firms which have low insider ownership choose to diversify more as
compared to firms with higher insider ownership. However from 1970 onwards level of
ownership also increased in multi-segment firms and diversification discount declined. It can
be concluded that firms with higher insider ownership choose to diversify when they do not
suffer from financial problems. The study conducted by Servaes (1996) can partially explain
why firms became more diversified over the period of his study but cannot explain why there
is diversification discount at the beginning and what causes it to decline over time.
Lins and Servaes (1999) explain the existence of diversification discount in Germany,
Japan and the U.K. through ownership structure and industrial group membership. Ownership
concentration is highest in Germany and lowest in the UK. Diversification discount is present
in Germany only when insider ownership is below 5%. On the contrary, insider ownership
does not affect the diversification discount in Japan and the UK. One distinguishing feature
of Japanese firms is their link to industrial groups known as keiretsu organisations. Studies
are conducted for Japanese firms to see whether industrial group membership affects
diversification discount. Their results show that diversified firms trade at a discount of 30%
when they have strong links to an industrial group. Their results establish the fact that
corporate governance structures indeed play a role in determining diversification discount but
there is no fixed pattern present for different countries.
Indian business groups possess features of both conglomerates and LBO associations.
There are both costs and benefits associated with group affiliation. However group affiliation
can be advantageous in emerging markets like India. Emerging markets are characterised by
market failures caused by information and agency problems and intermediary institutions
such as financial analysts, mutual funds, investment bankers, venture capitalists, and financial
press are well developed. Under these circumstances an enterprise which is a part of a large
diversified business group can act as an intermediary between individual entrepreneurs and
23
Khanna and Palepu (2000) examine three potential sources of performance effects of
group affiliation: (a) the degree of access to international investors and joint venture partners,
(b) monitoring/entrenchment by inside owners and (c) financing through internal capital
markets to explain their results. Business groups are found to have better access to
international capital markets which is consistent with the fact that these organisations provide
an extrajudicial mechanism for property rights enforcement, either by investing in reputation
or due to close relationship with the bureaucracy. Mixed evidence was found from the joint
venture data. Providers of technology are more unwilling to deal with groups, though partial
evidence shows that larger groups appear to facilitate member‟s access to international joint
venture markets. Insider ownership is found to be positively related to performance of both
affiliated and unaffiliated firms. Internal capital market is found to exhibit the same
investment sensitivities for both affiliated and unaffiliated firms. So these findings suggest
that the results are driven not only by institutional context but also by differences in
organisational structure.
Bernardo et al. (2000) explain diversification discount through real options. Their
conjecture is based on the argument that the market value of single segment firms still
includes the real options to diversify and expand in other segments whereas multi-segment
diversified firms have already exhausted their options to diversify and expand into more
segments. They use variables like R&D/assets and age of single segment firms to proxy for
real options. They use three different methods to test their argument. Firstly, if it is true that
single-segment firms include the value of real options to diversify and expand into future
lines of businesses then there should be a positive relationship between a measure of the
firm‟s real options and the future number of segments in which the firm operates. Secondly, they generate some firms by adding up single segment firms which operate in similar
segments as multi-segment firms. They find that multi-segment firms have smaller real
options compared to these synthesised firms as diversified firms spend less on R&D, have
larger fractions of assets that are tangible, generate larger cash flows and are bigger in size
compared to the equivalent synthesised firms. Finally, the relationship between
diversification discount and the proxy for real options is examined. They find that
diversification discount increases with the proxy for real options. More specifically
diversification discount is increasing with R&D expenditures of single-segment firms,
decreasing with the age of the single segment firms, and increasing with market volatility.
Anderson et al. (2000) use CEO compensation and other CEO characteristics to see
24
the product of inefficient corporate governance structures which enable managerial
entrenchment and help managers to reap private benefits at the cost of shareholders. The
differences between focused and diversified firms were identified and whether these
differences are compatible with the agency cost explanation of diversification were tested.
Their findings suggest that on average diversified firms have a higher fraction of
outsiders on their board of directors, similar ownership by outside block holders, and similar
sensitivity of managerial turnover to performance relative to their single-segment
counterparts. In addition, their paper examines whether changes in diversification over their
sample period can be explained by the ownership and governance characteristics of the firm.
Contrary to the managerial agency arguments of diversification they find that firms that
increase their level of diversification over the sample period have governance and
performance characteristics that are similar to firms that retain their focus. More specifically,
firms that reduce their level of diversification are observed to have lower insider ownership
but more equity based compensation compared to more focused firms. There is no systematic
relationship between diversification and choice of governance structure. Further, the evidence
is suggestive of a positive role of equity based compensation in increasing firm value. Higher
equity based compensation may motivate the low ownership CEOs to reduce value
decreasing activities and undertake activities that leads to higher value for the firm. But their
overall results cannot find a significant relation between corporate governance characteristics
and diversification discount.
Graham et al. (2002) show that diversification discount is not due to diversification
itself but rather due to acquisition of low performing businesses. The discount arises due to
the characteristics of the acquired units. When a firm increases its number of segments
without acquisitions its excess value is not reduced but when there is increase in number of
segments through acquisitions huge discounts are created for the diversifying firm. The
problem in the literature is that the valuation methodologies treat the divisions of
conglomerates as similar to benchmarked stand-alone firms. But the divisions of the
conglomerate have several characteristics which are different from these stand-alone firms
which are generally not accounted for while calculating excess value. Unless these
characteristics are accounted for the effects of corporate diversification on firm value will
show erroneous results due to sample selection bias.
Campa and Kedia (2002) argue that firms choose to diversify when the benefits of
diversification outweigh the costs of diversification. The benefits from diversification can
25
resources through internal capital markets, ability of diversified firms to internalise market
failures and many other factors. The costs from diversification can arise from inefficient
allocation of resources through internal capital market, difficulty in providing optimal
incentive contracts, information gap between the central management and division managers,
rent-seeking activities by division managers, and so on. These costs and benefits of
diversification may create diversification discount. So it is important to take into account
such characteristics which can affect both the firm value and the firm‟s decision to diversify.
They control for the endogeneity of the diversification decision of the firm and find a strong
negative correlation between a firm‟s decision to diversify and firm value. After controlling
for the endogeneity of diversification decision and certain firm characteristics the discount
turned into a premium.
Theoretical literature on diversification discount argues that firms diversify in order to
reduce risk. Mansi and Reeb (2002) argue in their empirical paper that diversification
discount arises due to the risk-reducing tendencies of the conglomerates. They further argue
that diversification reduces shareholder value on the one hand but increases the bondholder
value due to the reduction in risk. As a result it may be expected that more diversification
discount exists in firms with debt as compared to all equity firms. After using the Berger and
Ofek (1995) methodology they find a discount of 4.5% in firms with more than average debt
levels whereas no discount is found for all equity firms. This result suggests that debt is an
important factor in determining firm diversification. They also show that using book values
of debt instead of market values of debt for calculating excess value undervalues diversified
firms. Finally they try to examine the joint impact of diversification on debt and equity
holders. Their results show that diversification reduces shareholder value, increases
bondholder value but has no impact on total firm value.
Schoar (2002) identifies two sources of value loss for diversified firms. The first is the
“new toy” effect as explained in the previous section. The second is rent dissipation by
conglomerates. He finds that diversified firms pay their workers 8% more in the form of
fringe benefits or supplementary labour costs as compared to similar stand-alone firms. This
wage gap can account for 30% of the discount. He translates the 7% higher productivity as
10% higher annual profit for the diversified firm, whereas a discount of 10% is interpreted as
10% lower annual profit. If a firm earns 10% higher profits annually then for that firm to
show a reduction in profit of 10% it must dissipate 20% of its profits. Given this scenario,