Copyright © 2003, American Society for Microbiology. All Rights Reserved.
Use of Fourier-Transform Infrared Spectroscopy for Typing of
Candida albicans
Strains Isolated in Intensive Care Units
C. Sandt,
1G. D. Sockalingum,
1D. Aubert,
2H. Lepan,
2C. Lepouse,
3M. Jaussaud,
3A. Leon,
3J. M. Pinon,
2M. Manfait,
1and D. Toubas
2*
Unite´ Me´DIAN CNRS UMR 6142, IFR 53, UFR de Pharmacie, Universite´ de Reims-Champagne Ardenne, 51096
Reims Cedex,1and Laboratoire de Parasitologie-Mycologie, Hoˆpital Maison-Blanche, EA 2070,
IFR 53, UFR de Me´decine, Universite´ de Reims-Champagne Ardenne,2and De´partement
d’Anesthe´sie-Re´animation, Hoˆpital Robert Debre´,351092 Reims Cedex, France
Received 29 July 2002/Returned for modification 12 October 2002/Accepted 12 December 2002
Comparative studies ofCandida albicansstrains are essential for proving cross-infections in epidemiological
investigations. Typing ofC.albicansstrains is mainly based on genotypic methods. Fourier-transform infrared
(FTIR) spectroscopy is described in this study as a novel phenotypic approach to the typing ofC.albicans. The
first step in the approach was the standardization of sample preparation (culture conditions and sampling parameters) and acquisition and classification parameters (spectral acquisition, spectral window selection, classification algorithm, and heterogeneity threshold). The second step consisted of validating the established
parameters with a set of 79 strains ofC.albicansisolated over 4 months from nine patients hospitalized in two
intensive care units. Strains were isolated from multiple anatomical sites with repeated sampling. FTIR spectroscopy results were compared to randomly amplified polymorphic DNA (RAPD) results; this analysis showed that the amplification patterns of strains isolated from a given patient were identical and that different patients had different profiles. FTIR spectroscopy data were analyzed by hierarchical clustering performed with the second-derivative spectra. This classification revealed nine groups, one per patient. Only one spectrum out of 79 was misclassified by the FTIR spectroscopy method. RAPD and FTIR spectroscopy results were in good agreement, showing that, when nosocomial candidiasis transmission is suspected and urgent information is needed, this technique may be useful as a quick identification tool to give solid clues before confirmation by a genotypic method.
Fungal infections occur mainly in immunodeficient patients or those harboring several risk factors, such as broad-spectrum antibiotic therapy, digestive surgery, catheter implantation, or graft transplantation. Thus, intensive care unit (ICU) patients are high-risk patients since they generally have several of these factors.Candidaspp. constitute the third or fourth most com-mon cause of nosocomial infections in ICUs, according to data from the National Nosocomial Infections Surveillance System and the European Prevalence of Infection in Intensive Care (1,
22).Candida albicansis generally responsible for up to 50 to
70% of the infections, and its endogenous origin is generally implicated (3, 7, 21, 23). However, cases of exogenous contam-ination have been described (4, 6, 13, 14, 16). Demonstration of the exogenous origin of a contaminant pathogen is based on the identification and comparison of strains. Among the dif-ferent techniques used, genotypic methods are favored over phenotypic methods. Randomly amplified polymorphic DNA (RAPD) and other DNA fingerprinting methods, PCR-restric-tion fragment length polymorphism analysis, multilocus en-zyme electrophoresis, DNA sequencing, and pulsed-field gel electrophoresis are generally used to check strain identity. These techniques are successful but require time, expensive consumables, and highly trained staff to be performed ade-quately.
In this study, we applied a novel phenotypic approach based on infrared absorption spectroscopy to the typing ofC.albicans
isolates collected over a 4-month period from longitudinally monitored patients in two ICUs. Fourier-transform infrared (FTIR) spectroscopy allows analysis of molecular composition through the interaction between the infrared radiation and the sample. This promising method has been demonstrated able to identify microbial genera and species with a high degree of confidence (10, 11, 19). FTIR spectroscopy has been proven very simple to use and very sensitive to small changes in the composition of cells (5, 12), leading to the conjecture that the identification of yeasts at the strain level might be possible under well-controlled conditions (15, 19, 20). Here, RAPD and FTIR spectroscopy analyses were performed in parallel, and the results are discussed in view of evaluating the potential of FTIR spectroscopy for typing strains belonging to the same species.
MATERIALS AND METHODS
Origins and identification of the strains.C.albicansstrains were collected by the mycology laboratory of Reims University Hospital, Reims, France. Patients in two ICUs were placed under systematic surveillance for the detection and prevention of fungal infections. For each patient, different anatomical sites (e.g., trachea, throat, rectum, and surgical site) were sampled every 10 days or more frequently if required; each positive culture was classically identified by culturing onAlbicansID chromogenic medium (bioMe´rieux, Marcy l’Etoile, France) and by testing for germ tube formation and chlamydospore formation. For each positiveC.albicansculture, a single colony was isolated and stored before analysis by both the RAPD method and FTIR spectroscopy. During this 4-month study, 79 strains ofC.albicanswere obtained from nine ICU patients whose
* Corresponding author. Mailing address: Laboratoire de Parasi-tologie-Mycologie, Hoˆpital Maison-Blanche, 45 Rue Cognacq-Jay, 51092 Reims Cedex, France. Phone: (33) 326784224. Fax: (33) 326787328. E-mail: dtoubas@chu-reims.fr.
954
on May 15, 2020 by guest
http://jcm.asm.org/
duration of stay exceeded 2 weeks (Table 1). In addition, four C.albicans collection strains, ATCC 10231, ATCC 90028, ATCC 28367, and ATCC 38696, were used. One strain from patient 4 was arbitrarily chosen for reproducibility testing. For blind-test experiments, 40 samples originating from an unknown (to the experimenter) number of strains were provided by the mycology laboratory.
Culture conditions and sample preparation for FTIR spectroscopy.Two cell preservation modes were tested. Strains were stored either at⫺80°C in Sab-ouraud-glucose broth (Merck, Nogent sur Marne, France) with 10% glycerol (Sigma, St. Quentin Fallavier, France) or at room temperature in water prior to spectroscopic identification. For frozen samples, overnight thawing on Sab-ouraud-gentamicin-chloramphenicol agar (bioMe´rieux) was performed. For both types of samples, culturing was carried out with the same medium at 37°C for 24 or 48 h. Cells were harvested by carefully scraping the agar plate with a 10-l plastic loop and were resuspended in 1 ml of distilled water. The concen-tration of each suspension was spectrophotometrically measured (Uvikon; Kon-tron Instruments, Thiais, France) at 500 nm and adjusted to an optical density of 3 to control film thickness. Thirty-five microliters of each suspension was depos-ited on a sample carrier and desiccated under a mild vacuum to form a thin film of biological material suitable for FTIR spectroscopy measurements (8). Sample desiccation was necessary to avoid strong water absorption in the protein region of the infrared spectra.
FTIR spectroscopy, data treatment, and analysis.Mid-infrared spectra were recorded by using an Equinox 55 (Bruker, Wissemburg, France) spectrometer equipped with a KBr beam splitter, a deuterated triglycine sulfate detector, and a MICOR-ID sample changer compartment and by using a zinc selenide (ZnSe) sample carrier with 15 positions. The spectrometer is continuously purged with dry air generated by a model 75-62 FTIR spectroscopy purge gas generator (Whatman, Villeneuve d’Ascq, France).
Spectra were recorded from 500 to 4,000 cm⫺1, and 64 or 256 scans were averaged at a resolution of 6 or 4 cm⫺1. A zero filling factor was applied to give a final resolution of one point per wave number. Spectra were analyzed with Opus NT 3.1 software (Bruker). Derivation of the spectra to the second order was used to increase the number of discriminative features present in the spectra, and this goal was achieved by using a Savitsky-Golay algorithm with a nine-point filter. Spectra were classified by using Opus Ident cluster analysis based on a hierarchical classification algorithm (8) and implemented in the Opus NT 3.1 software.
RAPD analysis.After samples were cultured on Sabouraud-gentamicin-chlor-amphenicol agar, a suspension of 2⫻108yeasts/ml was prepared. DNA was extracted with a QIAmp DNA mini kit (Qiagen, Courtaboeuf, France). Briefly, after centrifugation of the suspension (5,000⫻gfor 5 min), the pellet was incubated with tissue lysis buffer and proteinase K for 1 h. DNA treatment with lysis buffer (70°C for 10 min) was followed by ethanol precipitation. The lysate was bound to microcentrifugation columns, washed twice, and finally eluted with H2O.
For the analysis, we used a Ready to go RAPD Analysis Beads kit (Amersham Pharmacia Biotech). The two oligonucleotides used as primers, B03 (5⬘-CATC CCCCTG-3⬘) and B12 (5⬘-CCTTGACGCA-3⬘), were selected from 25 tested. The DNA content was measured photometrically at 260 nm. PCR was performed with 20 ng of DNA as a template in a final volume of 25l. Samples were denatured at 95°C for 5 min with a Hybaid thermocycler; this step was followed by 45 cycles of 1 min at 95°C, 1 min at 36°C, and 2 min at 72°C. The PCR products were analyzed under UV light after electrophoresis through 1.6% (wt/vol) agarose gels containing ethidium bromide. Patterns were digitized by
using a FluorS Multimager (Bio-Rad, Ivry sur Seine, France) with QuantityOne 4.1.0 software (Bio-Rad) and analyzed by using Biodiversity 2.20 (Bio-Rad).
RESULTS AND DISCUSSION
FTIR spectroscopy is increasingly being used for the iden-tification of microorganisms at the species level, but it has been proven to have the potential to discriminate between strains of the same species (9, 17, 18, 20). In this study, we aimed to investigate the capability of this technique to compare strains
of C. albicans, a widely occurring yeast and opportunistic
pathogen, in a clinical setting. To do so, we studied isolates from ICU patients and evaluated the ability of this phenotypic technique to detect interpatient fungal transmission.
Methodology standardization. Differentiation of yeast
strains by phenotypic methods is complex, since variability can be introduced at the two main stages of the protocol, the culture stage and the analysis stage. Indeed, FTIR spectra can reflect small variations due to culture parameters (e.g., culture time, medium composition, medium pH, temperature, humid-ity, and storage mode). Our first goal was to standardize cul-ture and sample preparation conditions. As a result, only spec-tra recorded for the same batch of culture medium, at the same temperature, and during the same precise culture time were compared, as described elsewhere (8, 11).
It was also found that spectra were different when the strains were stored at ⫺80°C in 10% glycerol or were simply con-served in water. Consequently, to standardize this step, we compared only spectra of strains that were stored and pro-cessed in the same way, i.e., conserved in water.
Both spectral acquisition parameters and sample prepara-tion are important for the reproducibility of spectra. Dehy-drated films with a homogeneous thickness are used for FTIR spectroscopy measurements. When the suspension concentra-tion was adjusted manually, the reproducibility ofC.albicans
films was insufficient for consistent typing. Thus, it was neces-sary to measure and adjust the density of the cell suspension to control the thickness of the deposit. The density at 500 nm was adjusted from 2.99 to 3.01 by using a spectrophotometer prior to film formation and infrared measurements. Desiccation was performed for 15 samples under a weak vacuum at approxi-mately 0.2 bar (1 bar⫽105Pa) for 45 min. Although
[image:2.603.44.549.81.193.2]hetero-geneity due to culture conditions cannot be completely elimi-nated and therefore does still influence spectral variability, a
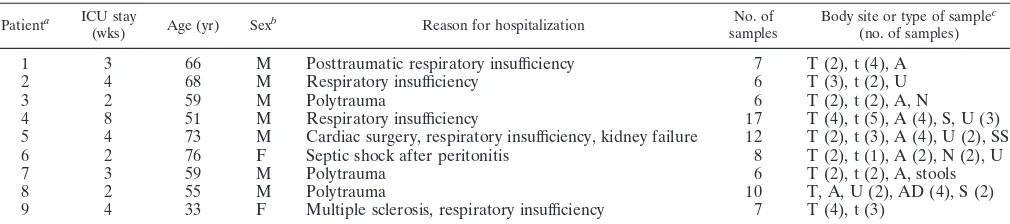
TABLE 1. Origins of isolates and clinical characteristics of patients
Patienta ICU stay
(wks) Age (yr) Sexb Reason for hospitalization samplesNo. of Body site or type of sample
c
(no. of samples)
1 3 66 M Posttraumatic respiratory insufficiency 7 T (2), t (4), A
2 4 68 M Respiratory insufficiency 6 T (3), t (2), U
3 2 59 M Polytrauma 6 T (2), t (2), A, N
4 8 51 M Respiratory insufficiency 17 T (4), t (5), A (4), S, U (3)
5 4 73 M Cardiac surgery, respiratory insufficiency, kidney failure 12 T (2), t (3), A (4), U (2), SS
6 2 76 F Septic shock after peritonitis 8 T (2), t (1), A (2), N (2), U
7 3 59 M Polytrauma 6 T (2), t (2), A, stools
8 2 55 M Polytrauma 10 T, A, U (2), AD (4), S (2)
9 4 33 F Multiple sclerosis, respiratory insufficiency 7 T (4), t (3)
aPatients 1, 3, 4, 5, 6, and 8 were in the first ICU, and patients 2, 7, and 9 were in the second ICU. bM, male; F, female.
cT, trachea; t, throat; A, perianal swab; U, urine; N, nasal swab; S, stoma; AD, abdominal drain; SS, sternotomy scar swab.
on May 15, 2020 by guest
http://jcm.asm.org/
level of reproducibility sufficient for strain typing can be achieved by abiding by procedures compatible with clinical laboratory practices.
Another task was to determine the parameters allowing the identification of the strains on the bases of the spectral infor-mation: acquisition of the spectra, selection of the spectral features allowing the differentiation of strains, classification algorithms, and heterogeneity threshold. To do so, a set of test strains was used in a preliminary study. Spectra were recorded by using two different sets of acquisition parameters, and the zero filling factor was adjusted to maintain the same number of points per spectrum: 6-cm⫺1 resolution and 64 scans and
4-cm⫺1resolution and 256 scans. For each strain, three
inde-pendent cultures were used and spectra were recorded over the range of 500 to 4,000 cm⫺1. Only discrete windows in the
spectral range of 750 to 3,100 cm⫺1 were selected for strain
classification by using the cluster analysis of the Opus NT 3.1 Ident module. Since the raw spectra were very similar, the classification scheme had to be enhanced by use of second-derivative spectra, which revealed small hypervariable regions spread over the spectral window mentioned above. Part of this spectrum is depicted in Fig. 1 for clarity. These regions allowed us to regroup samples according to strain identity. Correct classification could be attained either with 4-cm⫺1-resolution
spectra and 256 scans or with 6-cm⫺1-resolution spectra and 64
scans after both 24 and 48 h of culturing. We found that the accumulation of 256 scans only moderately enhanced repro-ducibility while greatly increasing acquisition time. The
in-creased resolution did not reveal new discriminative features. Hence, we continued this study by using the following condi-tions: 64 accumulations, 6-cm⫺1resolution, and 48 h of
cultur-ing (for commonality with the RAPD protocol). This set of parameters was previously described for species identification (8), and we show here that strain identification can be achieved as well. The two analyses can thus be performed in one step. The reproducibility of FTIR spectroscopy data was investi-gated by the iterative analysis of a collection strain (ATCC 10231) and an arbitrarily chosen clinical strain over several months. For each of these strains, spectra remained identical over several repeated measurements. However, care must be taken when spectra are compared over longer periods of time because some spectral variations could arise from different medium batches or other environmental conditions of cultur-ing. It is worth noting that standardization could be further improved by the use of synthetic culture media, a controlled atmosphere (CO2and humidity) (allowing better management
of culture conditions), and automation at some stages of the protocol (e.g., suspension deposit on the infrared window).
Blind tests.After standardization of the culture conditions
[image:3.603.84.504.73.359.2]and the sample preparation and acquisition parameters, we tested the robustness of the method by performing a series of four blind tests. In each of these tests, 10 samples originating from an unknown number of strains were analyzed by FTIR spectroscopy. In order to determine the number of strains, an internal heterogeneity threshold based on the maximum vari-ability within a cluster of the same sample was defined. One
FIG. 1. Second-derivative FTIR spectra in the polysaccharide absorption region (900 to 1,200 cm⫺1). The polysaccharide region, characterizing
essentially cell wall structure and composition, is a primary feature for strain delineation. For each of the two patients considered here (grey lines and black lines), second-derivative spectra of samples isolated from different body sites and on different sampling days are shown.
on May 15, 2020 by guest
http://jcm.asm.org/
hundred percent correct identification could be achieved for spectra measured from single cultures. For one of these tests, the rate of correct identification fell to 96% when three inde-pendent cultures of the same sample were compared. This result emphasizes that interculture variability can influence classification results. Despite this observation, we used three independent cultures for the clinical trial because this ap-proach allows monitoring of spectral variability.
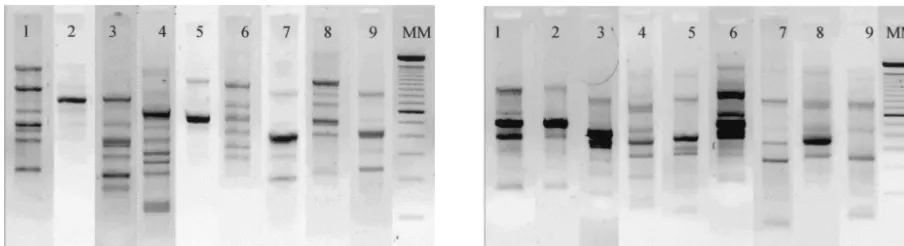
Clinical trial.In this study, which lasted 4 months, we
mon-itored several patients who were placed under ongoing myco-logical surveillance in two ICUs of Reims University Hospital. For nine of them, colonization by C. albicanswas systemati-cally observed during their hospitalization period, and collec-tion of several isolates from different anatomical sites was possible for each patient. Isolates from these patients were investigated by both FTIR spectroscopy and RAPD methods. The RAPD study showed that the amplification patterns of strains isolated from a given patient were identical and that different patients had different profiles (Fig. 2). For FTIR spectroscopy analysis, three to five spectra, representing inde-pendent cultures, were averaged for each isolate, and the means of the second-derivative spectra were calculated. The spectra exhibited small differences over the range of 750 to 3,100 cm⫺1, particularly in the polysaccharide region (900 to
1,200 cm⫺1).
We used multivariate statistical classification to perform ac-curate and objective clustering of spectra. The classification algorithm used when a small number of strains was involved (standardization and blind tests) had to be improved for a larger set of 79 strains, and some feature selection procedures were used. The variance was computed at every point of the mean spectra. Regions of high interpatient variance were used in the classification. Each of these regions was given equal weighting in the classification, reflecting the facts that inter-strain differences were unpredictable and that genetically un-related strains might differ only in small parts of the spectra. The whole spectral range (700 to 900 cm⫺1, 900 to 1,200 cm⫺1,
1,200 to 1,290 cm⫺1, 1,290 to 1,380 cm⫺1, 1,380 to 1,720 cm⫺1,
and 2,800 to 3,000 cm⫺1) was used, except for the lipid ester
region (1,720 to 1,760 cm⫺1). This region, containing
absorp-tion from the CAO bond of fatty acid esters, was highly vari-able, reflecting the dependence of fungal lipid content on cul-ture conditions (2). Furthermore, this region was found to be highly influenced by a light diffraction phenomenon. Other
spectral windows, such as the mixed region (1,360 to 1,480 cm⫺1) and the region from 2,800 to 3,000 cm⫺1, also contained
important contributions from the absorption of lipids, but their variability was attenuated by the absorption of other cell com-ponents.
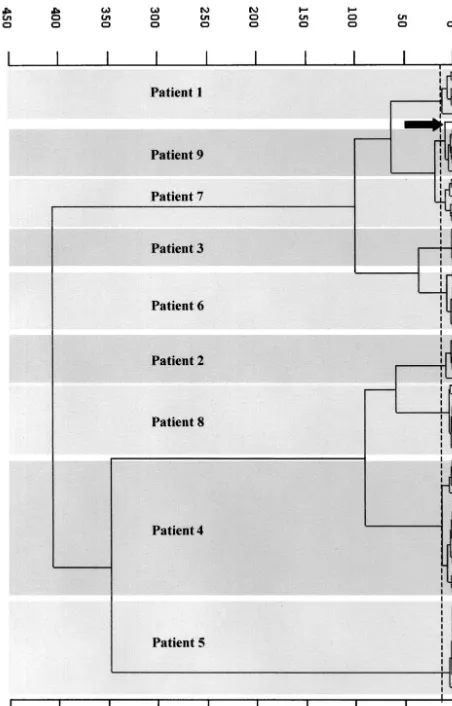
Hierarchical classification of the infrared data gave nine distinct groups, one per patient, and only one spectrum (that for patient 1) was misclassified (Fig. 3). However, this strain did not exhibit different RAPD patterns irrespective of the primer used. No strain obtained from different patients had a spectral signature identical to that of any other strain. The heterogeneity of each group was 7.9⫾3.3 (mean and standard deviation) (maximum, 13.7), meaning that a correlation coef-ficient of greater than 98% was achieved between spectra for a given patient over the wave number range used in the classi-fication algorithm. Interpatient spectral heterogeneity was found to be between 19 and 400. The highest within-patient heterogeneity of 13.7 was obtained for patient 4, who had the highest number of isolates. Two subgroups of 12 and 5 spectra could be distinguished. The former subgroup was composed of spectra recorded from isolates collected during the first 6 weeks of hospitalization, and the latter subgroup was com-posed of spectra recorded from isolates collected in the last 2 weeks. RAPD analysis did not reveal differences in the ampli-fication patterns of strains isolated from this patient. Thus, we assume (i) that this subgrouping did not originate from colo-nization by two unrelated strains but could have been due to mild modifications of the strain phenotype over a long period of time and (ii) that the FTIR spectroscopy method detects subtle strain changes that cannot be detected by the RAPD method.
[image:4.603.66.518.69.192.2]A comparison of RAPD and FTIR spectroscopy results ob-tained during blind tests and the clinical trial reveals the re-spective advantages of the two methods. The RAPD technique is less hindered by the variations in culture conditions that are the main limitations of phenotypic methods. However, the multiplicity of steps in the RAPD protocol (DNA extraction, amplification, migration, and visualization) hampers reproduc-ibility and rapidity. The protocol for FTIR spectroscopy is simpler and involves fewer steps. The interpretation of RAPD patterns can sometimes be difficult because of variations in band intensities. In our analysis, this problem was addressed by using the criterion that two isolates corresponded to the same strain even when their patterns differed by one weak band.
FIG. 2. Ethidium bromide-stained gels showing representative RAPD patterns forC.albicansstrains from nine patients (lanes 1 to 9) with each of the two primers used: primer B03 (left) and primer B12 (right). Lane MM, molecular weight marker.
on May 15, 2020 by guest
http://jcm.asm.org/
Spectral analysis can be performed in a more straightforward and objective manner with the procedures implemented here. Moreover, if there is doubt, samples can be quickly reanalyzed by FTIR spectroscopy at virtually no cost. It is noteworthy that, although the FTIR spectroscopy measurements were obtained for 48-h-old cultures for comparison with the RAPD tech-nique, similar reproducible results have been obtained for 24-h-old cultures (data not shown).
Taken together, the results obtained in this study showed that neither the FTIR spectroscopy method nor the RAPD method detected any cross-contamination, leading to the con-clusion that colonization and infection of these patients were of endogenous origin. FTIR spectroscopy combines rapidity, sensitivity, and reproducibility, making it an inexpensive typing method for performing epidemiological comparisons in an au-tomated and objective way. It offers the possibility of rapidly obtaining information on strain relatedness, allowing adapted measures to be taken in case of an outbreak. In situations in which there is doubt, further analysis could necessitate the use of more costly and time-consuming methods, such as genotypic ones. FTIR spectroscopy allows a high number of samples to
be processed in one working day. The number of analyses could, in the long run, be increased by 1 order of magnitude relative to that for genotypic methods. FTIR spectroscopy re-quires no specific consumables and can therefore be applied to any cultivable microorganism. Thus, this technique could be extended to non-C.albicans Candidatyping with no or minor changes in the experimental protocol.
Other fields of application, including phenotypic character-ization ofC.albicansstrains involved in pathogenicity, detec-tion of virulence markers, and resistance to antifungal agents, are being considered.
ACKNOWLEDGMENTS
This work was supported by a Projet Hospitalier de Recherche Clinique National 1998-2001 grant from the French Health Depart-ment and by a Projet Hospitalier de Recherche Clinique Local 1998 grant from Reims University Hospital.
REFERENCES
1. Beck-Sague´, C., and W. R. Jarvis.1993. Secular trends in the epidemi-ology of nosocomial fungal infections in the United States, 1980–1990. National Nosocomial Infection Surveillance System. J. Infect. Dis.167:
1247–1251.
2. Chatterjee, M. T., S. A. Khalawan, and B. P. Curran.2001. Subtle alterations in growth medium composition can dramatically alter the percentage of unsaturated fatty acids in the yeastSaccharomyces cerevisiae. Yeast18:81–88. 3. Daniels, W., D. D. Glover, M. Essmann, and B. Larsen.2001. Candidiasis during pregnancy may result from isogenic commensal strain. Infect. Dis. Obstet. Gynecol.9:65–73.
4. Fanello, S., J. P. Bouchara, N. Jousset, V. Delbos, and A. M. LeFlohic.
2001. NosocomialCandida albicansacquisition in a geriatric unit: epide-miology and evidence for person-to-person transmission. J. Hosp. Infect.
47:46–52.
5. Galichet, A., G. D. Sockalingum, A. Belarbi, and M. Manfait.2001. FTIR spectroscopic analysis ofSaccharomyces cerevisiae cell walls: study of an anomalous strain exhibiting a pink-colored cell phenotype. FEMS Microbiol. Lett.197:179–186.
6. Hamal, P., R. Kappe, and D. Rimek.2001. Rate of transmission and endog-enous origin ofCandida albicansandCandida glabrataon adult intensive care units studied by pulsed field gel electrophoresis. J. Hosp. Infect.49:37– 42.
7. Hedderwick, S. A., M. J. Lyon, M. Liu, J. A. Vazquez, and C. A. Kauffman.
2000. Epidemiology of yeast colonization in the intensive care unit. Eur. J. Clin. Microbiol. Infect. Dis.19:663–670.
8. Helm D., H. Labischinski, G. Schallehn, and D. Naumann.1991. Classifi-cation and identifiClassifi-cation of bacteria by Fourier-transform infrared spectros-copy. J. Gen. Microbiol.137:69–79.
9. Irmscher, H. M., R. Fischer, W. Beer, and G. Seltmann.1999. Character-ization of nosocomialSerratia marcescensisolates: comparison of Fourier-transform infrared spectroscopy with pulsed-field gel electrophoresis of genomic DNA fragments and multilocus enzyme electrophoresis. Zentbl. Bakteriol.289:249–263.
10. Kirschner, C., K. Maquelin, P. Pina, N. A. NgoThi, L. P. Choo-Smith, G. D. Sockalingum, C. Sandt, D. Ami, F. Orsini, S. M. Doglia, P. Allouch, M. Manfait, G. J. Puppels, and D. Naumann.2001. Classification and Identifi-cation of enterococci: a comparative phenotypic, genotypic, and vibrational spectroscopy study. J. Clin. Microbiol.39:1763–1770.
11. Ku¨mmerle, M., S. Scherer, and H. Seiler.1998. Rapid and reliable identi-fication of food-borne yeasts by Fourier-transform infrared spectroscopy. Appl. Environ. Microbiol.64:2207–2214.
12. Orsini, F., D. Ami, A. M. Villa, G. Sala, M. G. Belloti, and S. M. Doglia.2000. FT-IR microspectroscopy for microbiological studies. J. Microbiol. Methods
42:17–27.
13. Pertowski, C. A., R. C. Baron, B. A. Lasker, S. B. Werner, and W. R. Jarvis.1995. Nosocomial outbreak ofCandida albicans sternal wound infections following cardiac surgery traced to a scrub nurse. J. Infect. Dis.
172:817–822.
14. Pfaller, M. A., S. A. Messer, A. Houston, M. S. Rangel-Frausto, T. Wiblin, H. M. Blumberg, J. E. Edwards, W. Jarvis, M. A. Martin, H. C. Neu, L. Saiman, J. E. Patterson, J. C. Dibb, C. M. Roldan, M. G. Rinaldi, and R. P. Wenzel.1998. National epidemiology of mycoses survey: a multicenter study of strain variation and antifungal susceptibility among isolates ofCandida species. Diagn. Microbiol. Infect. Dis.31:289–296.
15. Schmalreck, A. F., P. Trankle, E. Vanca, and R. Blaschke-Hellmessen.1998. Differenciation and characterization of yeast pathogenic for humans ( Can-dida albicans,Exophiala dermatitidis) and algae pathogenic for animals ( Pro-FIG. 3. Dendrogram showing the hierarchical clustering obtained
from the means of the second-derivative spectra of the 79 isolates from patients 1 to 9. Heterogeneity ranged from 19 to 400. Only one spec-trum (patient 1) was misclassified (arrow).
on May 15, 2020 by guest
http://jcm.asm.org/
[image:5.603.54.280.72.425.2]tothecaspp.) using Fourier transform infrared spectroscopy (FTIR) in com-parison with conventional methods. Mycoses41(Suppl. 1):71–77. 16. Schmid, J., Y. P. Tay, L. Wan, M. Carr, D. Parr, and W. McKinney.1995.
Evidence for nosocomial transmission ofCandida albicansobtained by Ca3 fingerprinting. J. Clin. Microbiol.33:1223–1230.
17. Seltmann, G., W. Beer, H. Claus, and H. Seifert.1995. Comparative classi-fication ofAcinetobacter baumanniistrains using seven different typing meth-ods. Zentbl. Bakteriol.282:372–383.
18. Sockalingum, G. D., W. Bouhedja, P. Pina, P. Allouch, C. Mandray, R. Labia, J. M. Millot, and M. Manfait.1997. ATR-FTIR spectroscopic inves-tigation of imipenem-susceptible and -resistantPseudomonas aeruginosa iso-genic strains. Biochem. Biophys. Res. Commun.232:240–246.
19. Sockalingum, G. D., C. Sandt, D. Toubas, J. Gomez, P. Pina, I. Beguinot, F. Witthuhn, D. Aubert, P. Allouch, J. M. Pinon, and M. Manfait.2002. FTIR characterization ofCandidaspecies: a study on some reference strains and
pathogenicC.albicansisolates from HIV⫹patients. Vib. Spectrosc.28:137– 146.
20. Timmins, E. M., D. E. Quains, and R. Goodacre.1998. Differentiation of brewing yeast strains by pyrolysis mass spectrometry and Fourier transform infrared spectroscopy. Yeast14:885–893.
21. Verduyn-Lunel, F. M., J. F. Meis, and A. Voss.1999. Nosocomial fungal infections: candidemia. Diagn. Microbiol. Infect. Dis.34:213–220. 22. Vincent, J. L., D. J. Bihari, P. M. Suter, H. A. Bruining, J. White, M. H.
Nicolas-Chanoin, M. Wolff, R. C. Spencer, and M. Hemmer.1995. The prevalence of nosocomial infection in intensive care units in Europe—the results of the EPIC study. JAMA274:639–644.
23. Vrioni, G., and P. Matsiota-Bernard.2001. Molecular typing ofCandida isolates from patients hospitalized in an intensive care unit. J. Infect.42:50– 56.